SlideShare a Scribd company logo
1 of 2
1) The following data represents individual observations of molecular weight taken hourly
      from a chemical process


Observation      x      Observation       x      Observation       x      Observation       x
    no                      no                       no                       no
     1         1045          6          1008         11          1139         16          1125
     2         1055          7          1050         12          1169         17          1163
     3         1037          8          1087         13          1151         18          1188
     4         1064          9          1125         14          1128         19          1146
     5         1095         10          1146         15          1238         20          1167

      The target value of the molecular weight is 1050 and process standard deviation is
      thought to be 25.setup a tabular CUSUM for the mean of this process. Design CUSUM to
      detect a shift of about 1.0 times standard deviation in the process mean.

   2) A Shewhart X bar chart has centre line at 10 with UCL = 16, and LCL = 4. Suppose you
      wish to supplement this chart with an EWMAcontrol chart using /(lambda) =0.1 and the
      same control limit width in Sigma units as employed on the X bar chart. What are the
      values of the study state upper and lower control limits on the EWMA chart
   3) Analysis the data using a Moving average control chart with w = 5,

     sample No                    x                    sample No                    x
         1                       8.00                     13                       8.05
         2                       8.01                     14                       8.04
         3                       8.02                     15                       8.03
         4                       8.01                     16                       8.05
         5                       8.00                     17                       8.06
         6                       8.01                     18                       8.04
         7                       8.06                     19                       8.05
         8                       8.07                     20                       8.06
         9                       8.01                     21                       8.04
        10                       8.04                     22                       8.02
        11                       8.02                     23                       8.03
        12                       8.01                     24                       8.05


   4) The data shown here come from a production process with two observable quality
      characteristics x1, x2. The data are sample means of each quality characteristic, based on
      the samples of size n=25. Assume that mean value of the quality characteristics and the
      co variance matrix were computed from 50 preliminary samples.
      X
Observation no        X1             X2        Observation no         X1        X2
      1               58             32              9                46        25
      2               60             33             10                50        29
      3               50             27             11                49        27
      4               54             31             12                57        30
      5               63             38             13                58        33
      6               53             30             14                75        45
      7               42             20             15                55        27
      8               55             31


Means values of X1 and X2 are 55 and 30 respectively.


S= 200      130
   130      120

Construct a T2 control chart using this data. Use the phase 2 control limits.

More Related Content

Similar to Qce

Similar to Qce (7)

Spss Desti
Spss DestiSpss Desti
Spss Desti
 
Jhon
JhonJhon
Jhon
 
Engagement metrics Oct 2011
Engagement metrics Oct 2011Engagement metrics Oct 2011
Engagement metrics Oct 2011
 
8 dimension and properties table of equal leg angle
8 dimension and properties table of equal leg angle8 dimension and properties table of equal leg angle
8 dimension and properties table of equal leg angle
 
IMD51 - Carry Marks
IMD51 - Carry MarksIMD51 - Carry Marks
IMD51 - Carry Marks
 
20110218 ku-librarians #132: ILL in 90 minutes
20110218 ku-librarians #132: ILL in 90 minutes20110218 ku-librarians #132: ILL in 90 minutes
20110218 ku-librarians #132: ILL in 90 minutes
 
Ch08 1
Ch08 1Ch08 1
Ch08 1
 

Recently uploaded

The basics of sentences session 2pptx copy.pptx
The basics of sentences session 2pptx copy.pptxThe basics of sentences session 2pptx copy.pptx
The basics of sentences session 2pptx copy.pptx
heathfieldcps1
 
Russian Escort Service in Delhi 11k Hotel Foreigner Russian Call Girls in Delhi
Russian Escort Service in Delhi 11k Hotel Foreigner Russian Call Girls in DelhiRussian Escort Service in Delhi 11k Hotel Foreigner Russian Call Girls in Delhi
Russian Escort Service in Delhi 11k Hotel Foreigner Russian Call Girls in Delhi
kauryashika82
 
Activity 01 - Artificial Culture (1).pdf
Activity 01 - Artificial Culture (1).pdfActivity 01 - Artificial Culture (1).pdf
Activity 01 - Artificial Culture (1).pdf
ciinovamais
 

Recently uploaded (20)

Food Chain and Food Web (Ecosystem) EVS, B. Pharmacy 1st Year, Sem-II
Food Chain and Food Web (Ecosystem) EVS, B. Pharmacy 1st Year, Sem-IIFood Chain and Food Web (Ecosystem) EVS, B. Pharmacy 1st Year, Sem-II
Food Chain and Food Web (Ecosystem) EVS, B. Pharmacy 1st Year, Sem-II
 
TỔNG ÔN TẬP THI VÀO LỚP 10 MÔN TIẾNG ANH NĂM HỌC 2023 - 2024 CÓ ĐÁP ÁN (NGỮ Â...
TỔNG ÔN TẬP THI VÀO LỚP 10 MÔN TIẾNG ANH NĂM HỌC 2023 - 2024 CÓ ĐÁP ÁN (NGỮ Â...TỔNG ÔN TẬP THI VÀO LỚP 10 MÔN TIẾNG ANH NĂM HỌC 2023 - 2024 CÓ ĐÁP ÁN (NGỮ Â...
TỔNG ÔN TẬP THI VÀO LỚP 10 MÔN TIẾNG ANH NĂM HỌC 2023 - 2024 CÓ ĐÁP ÁN (NGỮ Â...
 
Measures of Dispersion and Variability: Range, QD, AD and SD
Measures of Dispersion and Variability: Range, QD, AD and SDMeasures of Dispersion and Variability: Range, QD, AD and SD
Measures of Dispersion and Variability: Range, QD, AD and SD
 
Unit-V; Pricing (Pharma Marketing Management).pptx
Unit-V; Pricing (Pharma Marketing Management).pptxUnit-V; Pricing (Pharma Marketing Management).pptx
Unit-V; Pricing (Pharma Marketing Management).pptx
 
microwave assisted reaction. General introduction
microwave assisted reaction. General introductionmicrowave assisted reaction. General introduction
microwave assisted reaction. General introduction
 
The basics of sentences session 2pptx copy.pptx
The basics of sentences session 2pptx copy.pptxThe basics of sentences session 2pptx copy.pptx
The basics of sentences session 2pptx copy.pptx
 
Russian Escort Service in Delhi 11k Hotel Foreigner Russian Call Girls in Delhi
Russian Escort Service in Delhi 11k Hotel Foreigner Russian Call Girls in DelhiRussian Escort Service in Delhi 11k Hotel Foreigner Russian Call Girls in Delhi
Russian Escort Service in Delhi 11k Hotel Foreigner Russian Call Girls in Delhi
 
2024-NATIONAL-LEARNING-CAMP-AND-OTHER.pptx
2024-NATIONAL-LEARNING-CAMP-AND-OTHER.pptx2024-NATIONAL-LEARNING-CAMP-AND-OTHER.pptx
2024-NATIONAL-LEARNING-CAMP-AND-OTHER.pptx
 
Key note speaker Neum_Admir Softic_ENG.pdf
Key note speaker Neum_Admir Softic_ENG.pdfKey note speaker Neum_Admir Softic_ENG.pdf
Key note speaker Neum_Admir Softic_ENG.pdf
 
Unit-IV- Pharma. Marketing Channels.pptx
Unit-IV- Pharma. Marketing Channels.pptxUnit-IV- Pharma. Marketing Channels.pptx
Unit-IV- Pharma. Marketing Channels.pptx
 
Ecological Succession. ( ECOSYSTEM, B. Pharmacy, 1st Year, Sem-II, Environmen...
Ecological Succession. ( ECOSYSTEM, B. Pharmacy, 1st Year, Sem-II, Environmen...Ecological Succession. ( ECOSYSTEM, B. Pharmacy, 1st Year, Sem-II, Environmen...
Ecological Succession. ( ECOSYSTEM, B. Pharmacy, 1st Year, Sem-II, Environmen...
 
ICT Role in 21st Century Education & its Challenges.pptx
ICT Role in 21st Century Education & its Challenges.pptxICT Role in 21st Century Education & its Challenges.pptx
ICT Role in 21st Century Education & its Challenges.pptx
 
Explore beautiful and ugly buildings. Mathematics helps us create beautiful d...
Explore beautiful and ugly buildings. Mathematics helps us create beautiful d...Explore beautiful and ugly buildings. Mathematics helps us create beautiful d...
Explore beautiful and ugly buildings. Mathematics helps us create beautiful d...
 
Introduction to Nonprofit Accounting: The Basics
Introduction to Nonprofit Accounting: The BasicsIntroduction to Nonprofit Accounting: The Basics
Introduction to Nonprofit Accounting: The Basics
 
psychiatric nursing HISTORY COLLECTION .docx
psychiatric  nursing HISTORY  COLLECTION  .docxpsychiatric  nursing HISTORY  COLLECTION  .docx
psychiatric nursing HISTORY COLLECTION .docx
 
This PowerPoint helps students to consider the concept of infinity.
This PowerPoint helps students to consider the concept of infinity.This PowerPoint helps students to consider the concept of infinity.
This PowerPoint helps students to consider the concept of infinity.
 
Role Of Transgenic Animal In Target Validation-1.pptx
Role Of Transgenic Animal In Target Validation-1.pptxRole Of Transgenic Animal In Target Validation-1.pptx
Role Of Transgenic Animal In Target Validation-1.pptx
 
Activity 01 - Artificial Culture (1).pdf
Activity 01 - Artificial Culture (1).pdfActivity 01 - Artificial Culture (1).pdf
Activity 01 - Artificial Culture (1).pdf
 
Grant Readiness 101 TechSoup and Remy Consulting
Grant Readiness 101 TechSoup and Remy ConsultingGrant Readiness 101 TechSoup and Remy Consulting
Grant Readiness 101 TechSoup and Remy Consulting
 
INDIA QUIZ 2024 RLAC DELHI UNIVERSITY.pptx
INDIA QUIZ 2024 RLAC DELHI UNIVERSITY.pptxINDIA QUIZ 2024 RLAC DELHI UNIVERSITY.pptx
INDIA QUIZ 2024 RLAC DELHI UNIVERSITY.pptx
 

Qce

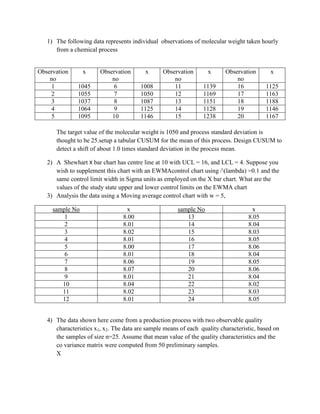
  • 1. 1) The following data represents individual observations of molecular weight taken hourly from a chemical process Observation x Observation x Observation x Observation x no no no no 1 1045 6 1008 11 1139 16 1125 2 1055 7 1050 12 1169 17 1163 3 1037 8 1087 13 1151 18 1188 4 1064 9 1125 14 1128 19 1146 5 1095 10 1146 15 1238 20 1167 The target value of the molecular weight is 1050 and process standard deviation is thought to be 25.setup a tabular CUSUM for the mean of this process. Design CUSUM to detect a shift of about 1.0 times standard deviation in the process mean. 2) A Shewhart X bar chart has centre line at 10 with UCL = 16, and LCL = 4. Suppose you wish to supplement this chart with an EWMAcontrol chart using /(lambda) =0.1 and the same control limit width in Sigma units as employed on the X bar chart. What are the values of the study state upper and lower control limits on the EWMA chart 3) Analysis the data using a Moving average control chart with w = 5, sample No x sample No x 1 8.00 13 8.05 2 8.01 14 8.04 3 8.02 15 8.03 4 8.01 16 8.05 5 8.00 17 8.06 6 8.01 18 8.04 7 8.06 19 8.05 8 8.07 20 8.06 9 8.01 21 8.04 10 8.04 22 8.02 11 8.02 23 8.03 12 8.01 24 8.05 4) The data shown here come from a production process with two observable quality characteristics x1, x2. The data are sample means of each quality characteristic, based on the samples of size n=25. Assume that mean value of the quality characteristics and the co variance matrix were computed from 50 preliminary samples. X
  • 2. Observation no X1 X2 Observation no X1 X2 1 58 32 9 46 25 2 60 33 10 50 29 3 50 27 11 49 27 4 54 31 12 57 30 5 63 38 13 58 33 6 53 30 14 75 45 7 42 20 15 55 27 8 55 31 Means values of X1 and X2 are 55 and 30 respectively. S= 200 130 130 120 Construct a T2 control chart using this data. Use the phase 2 control limits.