SlideShare a Scribd company logo
1 of 35
Adding the Domestic Private Sector
         Financial Balance
                              Fiscal Surplus

          DPSFB = CUB - GFB


   Current Account                             Current Account
   Deficit                                     Surplus


Domestic Private Sector
Financial Balance = 0


                              Fiscal Deficit
Portugal


                                                                                    Government Surplus
                                                                              5%


                                                                              3%


                                           Current Account Deficit                                            Current Account Surplus
                                                                              1%


-15%   -13%   -11%            -9%          -7%          -5%      -3%        -1%                          1%       3%         5%
                                                                              -1%

                 2000                            2003
               2001     2005               2004
       2008                                                                  -3%
               2009                 1999      1998
                  2007                2002              1997                                                                            Unemployment >= 7.5%
                                                                     1996    -5%
                                                                                                                                        Unemployment < 7.5%

               2006                                                                                                                     Private Sector Balance = 0


                                                                                    Government Deficit
                                                                             -7%


                     2011                                                    -9%

                       2010

                                                                            -11%


                                                                            -13%


                                                                            -15%
Portugal
                  4%


                  2%


                  0%
                        1996   1997   1998   1999   2000   2001   2002   2003   2004   2005   2006   2007   2008   2009   2010   2011


                 -2%
Percent of GDP


                 -4%                                                                                                                    Government Balance
                                                                                                                                        Private Balance


                 -6%


                 -8%


                 -10%


                 -12%
                                                                            Year
Italy
                                                         6%


                                                              Government Surplus
                                                         4%


                                                         2%


                                                         0%
-4%             -3%           -2%             -1%             0%                            1%             2%            3%        4%
      Current Account Deficit                          2001                                              Current Account Surplus        Unemployment >= 7.5%
                                                                                                                                        Unemployment < 7.5%
      2008
                                                2000                                                                                    Private Sector Balance = 0
                                                        -2%

      2009                                                                         1999           1998
                                    2003
                                             2002
                     2007
                                                              Government Deficit


                                           2004
                                    2005                -4%
                2006
               2011

              2010
                                                        -6%


                                                                                                                 1997
                                                                                                                        1996
                                                        -8%
Italy
                 12%


                 10%


                  8%


                  6%


                  4%
Percent of GDP


                  2%
                                                                                                                                        Government Balance

                  0%                                                                                                                    Private Balance

                        1996   1997   1998   1999   2000   2001   2002   2003   2004   2005   2006   2007   2008   2009   2010   2011

                 -2%


                 -4%


                 -6%


                 -8%


                 -10%
                                                                            Year
Ireland
                                                                         15%
Government Surplus


                                                                         10%


                                                                       2001
                                                                          5%
                           2007                                                1999
                                               2005                   2000
                                                               2002                      1998
                                  2008     2006                           0%    2003                        1997
-8%                  -6%                 -4%             -2%            2004 0%                 2%              4%
                                                                                                          1996
                                                                         -5%

                                                      2009
                                                                                                                       Unemployment >= 7.5%
                                                                        -10%
                                                                                                                       Unemployment < 7.5%
                                                                                                                       Private Sector Balance = 0
                                                                                      2010
Government Deficit


                                                                        -15%


                                                                        -20%


                                                                        -25%


                                                                        -30%
                                                                                2011


                     Current Account Deficit                            -35%                 Current Account Surplus
Ireland
                 40%


                 30%


                 20%


                 10%
Percent of GDP


                  0%                                                                                                                    Government Balance
                        1996   1997   1998   1999   2000   2001   2002   2003   2004   2005   2006   2007   2008   2009   2010   2011   Private Balance


                 -10%


                 -20%


                 -30%


                 -40%
                                                                            Year
Greece
                                                                                                             0%
   -16%                 -14%   -12%          -10%         -8%              -6%           -4%          -2%          0%


                                                                                                            -2%

                                                           2000
                                                               2001
                                                                                  1999
                                                                                                            -4%
                                                                2002
                                                                           2003
                      2007
                                      2006
                                                                            2004               1998         -6%
Government Deficit


                     2008
                                                                                          1997

                                                             2005                                           -8%         Unemployment >= 7.5%
                                                                                                                        Private Sector Balance = 0


                                                                                               1996
                                      2009                                                                  -10%


                                                         2011

                                                                                                            -12%


                                                                                                            -14%


                                               2010

                                                                                                            -16%
                                                 Current Account Deficit
Greece
                 10%


                  5%


                  0%
                        1996   1997   1998   1999   2000   2001   2002   2003   2004   2005   2006   2007   2008   2009   2010   2011
Percent of GDP


                 -5%                                                                                                                    Government Balance
                                                                                                                                        Private Balance


                 -10%


                 -15%


                 -20%
                                                                            Year
Spain


                                                                                                    Government Surplus
       2007      2008                                                                     2%


              2006

                               2005             2004
                                                                                          0%
-12%      -10%           -8%            -6%                -4%
                                                          2003       2002 -2%                  0%                        2%
                                                       2001
                                                       2000
                                                                                         -2%


                                                              1999
                                                                           1998
                                                                                         -4%                                      Unemployment >= 7.5%
                                          2009
                                                                                1997                                              Private Sector Balance = 0


                                                                                                    Government Deficit
                                                                                                                                  Series4

                                                                                         -6%
                                                                                       1996


                                                                                         -8%


                                          2011

                                                                                        -10%


                                         2010

                        Current Account Deficit                                         -12%                                  Current Account Surplus
Spain
                 10%


                  5%


                  0%
                        1996   1997   1998   1999   2000   2001   2002   2003   2004   2005   2006   2007   2008   2009   2010   2011
Percent of GDP


                                                                                                                                        Government Balance
                                                                                                                                        Private Balance


                 -5%


                 -10%


                 -15%
                                                                            Year
Germany
                                     2%


                                            Government Surplus
                                    2001
                                     1%


 Current Account Deficit                                          Current Account Surplus                          2008
                                     0%
                                                                                             2009
-4%               -2%                      0%                    2%              4%                       6%              8%


                                    -1%

                                                                                                                                 Unemployment >= 7.5%
                           2000
                                                                                                                          2007   Unemployment < 7.5%
                                                                                                                                 Private Sector Balance = 0
                                    -2%
                    1999

                           1998
                                            Government Deficit


                                                                      2002
                                    -3%
                                                                                                      2010
                             1997                                                                                2006

                                                                  2003
                                                                                                   2005
                                    -4%                                                     2004

                                                                                                          2011


                                    -5%
Germany
                 12%


                 10%


                 8%


                 6%
Percent of GDP


                 4%

                                                                                                                                Government Balance
                                                                                                                                Private Balance
                 2%


                 0%
                       1997   1998   1999   2000   2001   2002   2003   2004   2005   2006   2007   2008   2009   2010   2011


                 -2%


                 -4%


                 -6%
                                                                        Year
United Kingdom
                                                                                     6%


                                                                                     4%
                                    2001


                                                                                     2%


                            1999           2002
                                                                                     0%
                   2000
-4%          -3%                   -2%                          -1%                        0%

                                           2003
                                                                                    -2%
                     2007                         2008                       1998
      2006                          2004                                                        Unemployment >= 7.5%
                   2005                                                            -4%          Unemployment < 7.5%
                                                                               1997
                                                                                                Private Sector Balance = 0
                                                         2009

                                                                      1996          -6%


                                                                                    -8%


                                                                                    -10%
                                              2011

                                             2010
                                                                                    -12%


                                                                                    -14%
United Kingdom
                 15%


                 10%


                  5%
Percent of GDP


                  0%                                                                                                                    Government Balance
                        1996   1997   1998   1999   2000   2001   2002   2003   2004   2005   2006   2007   2008   2009   2010   2011   Private Sector Balance


                 -5%


                 -10%


                 -15%
                                                                            Year
Japan
                            1%


-1%                               0%   1%          2%                 3%                 4%      5%     6%
                           -1%

                                                                                                 2007


                                                                              2008
                                                            2009
                           -3%


                                                                           1998
      Government Deficit


                                            1996
                           -5%                              1997

                                                                   2002                                      Unemployment < 7.5%
                                                                                     2005
                                                                                                             Private Sector Balance = 0
                                                                                          2006
                           -7%                              2000
                                                                                  2004
                                                                   2010
                                                    2001
                                                                          2003
                                                           2011
                           -9%


                           -11%
                                                                   1999


                           -13%
                                                            Current Account Surplus
Japan
                 20%


                 15%


                 10%


                  5%
Percent of GDP


                                                                                                                                        Government Balance
                                                                                                                                        Private Balance
                  0%
                        1996   1997   1998   1999   2000   2001   2002   2003   2004   2005   2006   2007   2008   2009   2010   2011


                 -5%


                 -10%


                 -15%
                                                                            Year
Government Surplus                                                           United States
                                                                                                                     4%


                                                                                                                     2%
                                                                      2001

                                                               2000
                                                   2002                        1999
                                                                                                                     0%
-7%                     -6%                  -5%              -4%              -3%              -2%           -1%          0%

                                                                                         1998

                                                   2008                                               1997          -2%
                                     2007
Government Deficit


                                                      2003                                             1996
                              2006                                                                                              Unemployment >= 7.5%
                                                                                                                    -4%
                                                                                                                                Unemployment < 7.5%
                                                                                      2009
                     2005                                                                                                       Private Sector Balance = 0
                                            2004

                                                                                                                    -6%


                                                                                                                    -8%


                                                                                                                    -10%
                                                                             2011


                                                                              2010
                                                                                                                    -12%
                                                             Current Account Deficit
United States
                 10%


                  5%


                  0%
                        1996   1997   1998   1999   2000   2001   2002   2003   2004   2005   2006   2007   2008   2009   2010   2011
Percent of GDP


                                                                                                                                        Government Balance
                                                                                                                                        Private Balance


                 -5%


                 -10%


                 -15%
                                                                            Year
Current Account 1996
                 4.0%


                 3.0%


                 2.0%


                 1.0%
Percent of GDP


                 0.0%
                         Portugal   Italy   Ireland    Greece      Spain   Germany   France


                 -1.0%


                 -2.0%


                 -3.0%


                 -4.0%
Current Account 1997
                 4.0%


                 3.0%


                 2.0%


                 1.0%


                 0.0%
                         Portugal   Italy   Ireland    Greece      Spain   Germany   France
Percent of GDP


                 -1.0%


                 -2.0%


                 -3.0%


                 -4.0%


                 -5.0%


                 -6.0%


                 -7.0%
Current Account 1998
                 4.0%


                 2.0%


                 0.0%
                         Portugal   Italy   Ireland    Greece      Spain   Germany   France
Percent of GDP


                 -2.0%


                 -4.0%


                 -6.0%


                 -8.0%
Current Account 1999
                  4.0%


                  2.0%


                  0.0%
                          Portugal   Italy    Ireland   Greece      Spain   Germany   France


                  -2.0%
Percent of GDP


                  -4.0%


                  -6.0%


                  -8.0%


                 -10.0%
Current Account 2000
                  4.0%


                  2.0%


                  0.0%
                          Portugal   Italy    Ireland   Greece      Spain   Germany   France


                  -2.0%
Percent of GDP


                  -4.0%


                  -6.0%


                  -8.0%


                 -10.0%


                 -12.0%
Current Account 2001
                  4.0%


                  2.0%


                  0.0%
                          Portugal   Italy    Ireland   Greece      Spain   Germany   France


                  -2.0%
Percent of GDP


                  -4.0%


                  -6.0%


                  -8.0%


                 -10.0%


                 -12.0%
Current Account 2002
                  4.0%


                  2.0%


                  0.0%
                          Portugal   Italy    Ireland   Greece      Spain   Germany   France


                  -2.0%
Percent of GDP


                  -4.0%


                  -6.0%


                  -8.0%


                 -10.0%
Current Account 2003
                 3.0%


                 2.0%


                 1.0%


                 0.0%
                         Portugal   Italy   Ireland    Greece      Spain   Germany   France


                 -1.0%
Percent of GDP


                 -2.0%


                 -3.0%


                 -4.0%


                 -5.0%


                 -6.0%


                 -7.0%
Current Account 2004
                  6.0%


                  4.0%


                  2.0%


                  0.0%
                          Portugal   Italy    Ireland   Greece      Spain   Germany   France
Percent of GDP


                  -2.0%


                  -4.0%


                  -6.0%


                  -8.0%


                 -10.0%
Current Account 2005
                  6.0%


                  4.0%


                  2.0%


                  0.0%
                          Portugal   Italy    Ireland   Greece      Spain   Germany   France
Percent of GDP


                  -2.0%


                  -4.0%


                  -6.0%


                  -8.0%


                 -10.0%


                 -12.0%
Current Account 2006
                  8.0%


                  6.0%


                  4.0%


                  2.0%


                  0.0%
                          Portugal   Italy    Ireland   Greece      Spain   Germany   France
Percent of GDP


                  -2.0%


                  -4.0%


                  -6.0%


                  -8.0%


                 -10.0%


                 -12.0%


                 -14.0%
Current Account 2007
                 10.0%


                  5.0%


                  0.0%
                          Portugal   Italy    Ireland   Greece      Spain   Germany   France
Percent of GDP


                  -5.0%


                 -10.0%


                 -15.0%


                 -20.0%
Current Account 2008
                 10.0%


                  5.0%


                  0.0%
                          Portugal   Italy    Ireland   Greece      Spain   Germany   France
Percent of GDP


                  -5.0%


                 -10.0%


                 -15.0%


                 -20.0%
Current Account 2009
                  6.0%


                  4.0%


                  2.0%


                  0.0%
                          Portugal   Italy    Ireland   Greece      Spain   Germany   France


                  -2.0%
Percent of GDP


                  -4.0%


                  -6.0%


                  -8.0%


                 -10.0%


                 -12.0%


                 -14.0%
Current Account 2010
                  8.0%


                  6.0%


                  4.0%


                  2.0%


                  0.0%
                          Portugal   Italy    Ireland   Greece      Spain   Germany   France
Percent of GDP


                  -2.0%


                  -4.0%


                  -6.0%


                  -8.0%


                 -10.0%


                 -12.0%
Current Account 2011
                  8.0%


                  6.0%


                  4.0%


                  2.0%


                  0.0%
                          Portugal   Italy    Ireland   Greece      Spain   Germany   France
Percent of GDP


                  -2.0%


                  -4.0%


                  -6.0%


                  -8.0%


                 -10.0%


                 -12.0%

More Related Content

What's hot

Conference presentation draft v 4.11
Conference presentation draft v 4.11Conference presentation draft v 4.11
Conference presentation draft v 4.11Daniel Novichkov
 
capital oneSanford C. Bernstein & Co. Strategic Decisions Conference Presenta...
capital oneSanford C. Bernstein & Co. Strategic Decisions Conference Presenta...capital oneSanford C. Bernstein & Co. Strategic Decisions Conference Presenta...
capital oneSanford C. Bernstein & Co. Strategic Decisions Conference Presenta...finance13
 
Outsourcing Deal Activity – February 2012
Outsourcing Deal Activity – February 2012Outsourcing Deal Activity – February 2012
Outsourcing Deal Activity – February 2012Everest Group
 
2011 Annual Report Corporate Section
2011 Annual Report Corporate Section2011 Annual Report Corporate Section
2011 Annual Report Corporate SectionRecticel NV/SA
 
Pine Flash Note: Monetary Policy – walking on thin ice
Pine Flash Note: Monetary Policy – walking on thin icePine Flash Note: Monetary Policy – walking on thin ice
Pine Flash Note: Monetary Policy – walking on thin iceBanco Pine
 
Uk economic outlook peter matheson, economic counsellor - british embassy w...
Uk economic outlook   peter matheson, economic counsellor - british embassy w...Uk economic outlook   peter matheson, economic counsellor - british embassy w...
Uk economic outlook peter matheson, economic counsellor - british embassy w...Jessica Roch
 
MIPIM 2012 - Wrap-Up Keynote address from Mark Roberts
MIPIM 2012 - Wrap-Up Keynote address from Mark RobertsMIPIM 2012 - Wrap-Up Keynote address from Mark Roberts
MIPIM 2012 - Wrap-Up Keynote address from Mark RobertsMIPIMWorld
 
Outsourcing deal activity october 2011
Outsourcing deal activity   october 2011Outsourcing deal activity   october 2011
Outsourcing deal activity october 2011Everest Group
 
O'Shaughnessy's Four Value Factors
O'Shaughnessy's Four Value FactorsO'Shaughnessy's Four Value Factors
O'Shaughnessy's Four Value FactorsJustin Case
 
The Euro Area Crisis and Reforms Fiscal Discipline and Growth
The Euro Area Crisis and Reforms Fiscal Discipline and GrowthThe Euro Area Crisis and Reforms Fiscal Discipline and Growth
The Euro Area Crisis and Reforms Fiscal Discipline and GrowthIstituto Affari Internazionali
 
Outsourcing deal activity november 2011
Outsourcing deal activity  november 2011Outsourcing deal activity  november 2011
Outsourcing deal activity november 2011Everest Group
 
Outsourcing Deal Activity - January 2012
Outsourcing Deal Activity - January 2012Outsourcing Deal Activity - January 2012
Outsourcing Deal Activity - January 2012Everest Group
 
US & Intl Real Estate investments 2008
US & Intl Real Estate investments 2008US & Intl Real Estate investments 2008
US & Intl Real Estate investments 2008Marcusroberts
 
Think Canada! Why you should commercialize technology with Canadian partners.
Think Canada! Why you should commercialize technology with Canadian partners.Think Canada! Why you should commercialize technology with Canadian partners.
Think Canada! Why you should commercialize technology with Canadian partners.Michael Willmott
 
Population Volumes & Finance
Population Volumes & FinancePopulation Volumes & Finance
Population Volumes & FinanceRon_Janzen
 
Four key value factors in investing
Four key value factors in investingFour key value factors in investing
Four key value factors in investingJustin Case
 
Next generation Waterside Convention 10-2012 Amundi
Next generation Waterside Convention 10-2012 AmundiNext generation Waterside Convention 10-2012 Amundi
Next generation Waterside Convention 10-2012 AmundiMarnix van Eerde
 

What's hot (20)

Conference presentation draft v 4.11
Conference presentation draft v 4.11Conference presentation draft v 4.11
Conference presentation draft v 4.11
 
capital oneSanford C. Bernstein & Co. Strategic Decisions Conference Presenta...
capital oneSanford C. Bernstein & Co. Strategic Decisions Conference Presenta...capital oneSanford C. Bernstein & Co. Strategic Decisions Conference Presenta...
capital oneSanford C. Bernstein & Co. Strategic Decisions Conference Presenta...
 
Outsourcing Deal Activity – February 2012
Outsourcing Deal Activity – February 2012Outsourcing Deal Activity – February 2012
Outsourcing Deal Activity – February 2012
 
2011 Annual Report Corporate Section
2011 Annual Report Corporate Section2011 Annual Report Corporate Section
2011 Annual Report Corporate Section
 
Pine Flash Note: Monetary Policy – walking on thin ice
Pine Flash Note: Monetary Policy – walking on thin icePine Flash Note: Monetary Policy – walking on thin ice
Pine Flash Note: Monetary Policy – walking on thin ice
 
Uk economic outlook peter matheson, economic counsellor - british embassy w...
Uk economic outlook   peter matheson, economic counsellor - british embassy w...Uk economic outlook   peter matheson, economic counsellor - british embassy w...
Uk economic outlook peter matheson, economic counsellor - british embassy w...
 
MIPIM 2012 - Wrap-Up Keynote address from Mark Roberts
MIPIM 2012 - Wrap-Up Keynote address from Mark RobertsMIPIM 2012 - Wrap-Up Keynote address from Mark Roberts
MIPIM 2012 - Wrap-Up Keynote address from Mark Roberts
 
Outsourcing deal activity october 2011
Outsourcing deal activity   october 2011Outsourcing deal activity   october 2011
Outsourcing deal activity october 2011
 
O'Shaughnessy's Four Value Factors
O'Shaughnessy's Four Value FactorsO'Shaughnessy's Four Value Factors
O'Shaughnessy's Four Value Factors
 
The Euro Area Crisis and Reforms Fiscal Discipline and Growth
The Euro Area Crisis and Reforms Fiscal Discipline and GrowthThe Euro Area Crisis and Reforms Fiscal Discipline and Growth
The Euro Area Crisis and Reforms Fiscal Discipline and Growth
 
Q32009 Austin Real Estate Market Report
Q32009 Austin Real Estate Market ReportQ32009 Austin Real Estate Market Report
Q32009 Austin Real Estate Market Report
 
Outsourcing deal activity november 2011
Outsourcing deal activity  november 2011Outsourcing deal activity  november 2011
Outsourcing deal activity november 2011
 
Outsourcing Deal Activity - January 2012
Outsourcing Deal Activity - January 2012Outsourcing Deal Activity - January 2012
Outsourcing Deal Activity - January 2012
 
US & Intl Real Estate investments 2008
US & Intl Real Estate investments 2008US & Intl Real Estate investments 2008
US & Intl Real Estate investments 2008
 
San Diego ULI Young Leaders
San Diego ULI Young LeadersSan Diego ULI Young Leaders
San Diego ULI Young Leaders
 
Think Canada! Why you should commercialize technology with Canadian partners.
Think Canada! Why you should commercialize technology with Canadian partners.Think Canada! Why you should commercialize technology with Canadian partners.
Think Canada! Why you should commercialize technology with Canadian partners.
 
Population Volumes & Finance
Population Volumes & FinancePopulation Volumes & Finance
Population Volumes & Finance
 
2012 Q1 Report
2012 Q1 Report2012 Q1 Report
2012 Q1 Report
 
Four key value factors in investing
Four key value factors in investingFour key value factors in investing
Four key value factors in investing
 
Next generation Waterside Convention 10-2012 Amundi
Next generation Waterside Convention 10-2012 AmundiNext generation Waterside Convention 10-2012 Amundi
Next generation Waterside Convention 10-2012 Amundi
 

Viewers also liked

How to maintain balance between life and work
How to maintain balance between life and workHow to maintain balance between life and work
How to maintain balance between life and workAtul Mittal
 
Private sector banks swot analysis
Private sector banks swot analysisPrivate sector banks swot analysis
Private sector banks swot analysisAshish Pingale
 
Distinguish between Public Sector Banks & Private Sector Banks.
Distinguish between Public Sector Banks & Private Sector Banks. Distinguish between Public Sector Banks & Private Sector Banks.
Distinguish between Public Sector Banks & Private Sector Banks. Somnath Pagar
 
Trends in public and private sector in india
Trends in public and private sector in indiaTrends in public and private sector in india
Trends in public and private sector in indiaAshutosh Gupta
 
Privatization ppt
Privatization ppt Privatization ppt
Privatization ppt Kapil Pundir
 
Comparison between public sector & private sector
Comparison between public sector & private sectorComparison between public sector & private sector
Comparison between public sector & private sectorDharmik
 
Work life balance issues- How to deal with it.
Work life balance issues- How to deal with it.Work life balance issues- How to deal with it.
Work life balance issues- How to deal with it.Sandipan Samaddar
 
Work-Life Balance Presentation
Work-Life Balance PresentationWork-Life Balance Presentation
Work-Life Balance Presentationgrawitch
 
Public and private enterprises
Public and private  enterprisesPublic and private  enterprises
Public and private enterprisespurvashisb
 
work life balance ppt
work life balance pptwork life balance ppt
work life balance pptMudit Deval
 
Private Sector Contributions To International Development – McGill Executive ...
Private Sector Contributions To International Development – McGill Executive ...Private Sector Contributions To International Development – McGill Executive ...
Private Sector Contributions To International Development – McGill Executive ...Wayne Dunn
 
Project report on work life balance
Project report on work life balanceProject report on work life balance
Project report on work life balanceKhushbu Malara
 

Viewers also liked (16)

Berg fig 1
Berg fig 1Berg fig 1
Berg fig 1
 
How to maintain balance between life and work
How to maintain balance between life and workHow to maintain balance between life and work
How to maintain balance between life and work
 
Private sector banks swot analysis
Private sector banks swot analysisPrivate sector banks swot analysis
Private sector banks swot analysis
 
Distinguish between Public Sector Banks & Private Sector Banks.
Distinguish between Public Sector Banks & Private Sector Banks. Distinguish between Public Sector Banks & Private Sector Banks.
Distinguish between Public Sector Banks & Private Sector Banks.
 
Trends in public and private sector in india
Trends in public and private sector in indiaTrends in public and private sector in india
Trends in public and private sector in india
 
Privatization ppt
Privatization ppt Privatization ppt
Privatization ppt
 
Comparison between public sector & private sector
Comparison between public sector & private sectorComparison between public sector & private sector
Comparison between public sector & private sector
 
Privatization
PrivatizationPrivatization
Privatization
 
Work life balance issues- How to deal with it.
Work life balance issues- How to deal with it.Work life balance issues- How to deal with it.
Work life balance issues- How to deal with it.
 
Work life balance
Work life balanceWork life balance
Work life balance
 
Work-Life Balance Presentation
Work-Life Balance PresentationWork-Life Balance Presentation
Work-Life Balance Presentation
 
Public and private enterprises
Public and private  enterprisesPublic and private  enterprises
Public and private enterprises
 
work life balance ppt
work life balance pptwork life balance ppt
work life balance ppt
 
Private Sector Contributions To International Development – McGill Executive ...
Private Sector Contributions To International Development – McGill Executive ...Private Sector Contributions To International Development – McGill Executive ...
Private Sector Contributions To International Development – McGill Executive ...
 
Recitation of Public and Private Sector General Insurance Industry in Structu...
Recitation of Public and Private Sector General Insurance Industry in Structu...Recitation of Public and Private Sector General Insurance Industry in Structu...
Recitation of Public and Private Sector General Insurance Industry in Structu...
 
Project report on work life balance
Project report on work life balanceProject report on work life balance
Project report on work life balance
 

Similar to Adding the Domestic Private Sector Financial Balance

Telecom Italia 1Q 2012 Results - Operations - Marco Patuano (10/05/2012)
Telecom Italia 1Q 2012 Results - Operations - Marco Patuano (10/05/2012)Telecom Italia 1Q 2012 Results - Operations - Marco Patuano (10/05/2012)
Telecom Italia 1Q 2012 Results - Operations - Marco Patuano (10/05/2012)Gruppo TIM
 
Rr results q4_2012_en_final
Rr results q4_2012_en_finalRr results q4_2012_en_final
Rr results q4_2012_en_finalRamirent Group
 
2013 Economic Outlook (NCLGBA)
2013 Economic Outlook (NCLGBA)2013 Economic Outlook (NCLGBA)
2013 Economic Outlook (NCLGBA)PublicFinanceTV
 
April Investor Presentation
April Investor PresentationApril Investor Presentation
April Investor Presentationfinance7
 
Sun microsystems Q2 2009 earnings releases
Sun microsystems Q2 2009 earnings releasesSun microsystems Q2 2009 earnings releases
Sun microsystems Q2 2009 earnings releasesearningsreport
 
Bill Handel Discusses Loan Growth at Raddon’s CEO Forum
Bill Handel Discusses Loan Growth at Raddon’s CEO ForumBill Handel Discusses Loan Growth at Raddon’s CEO Forum
Bill Handel Discusses Loan Growth at Raddon’s CEO ForumRaddon Financial Group
 
Pakistan TV Industry Report 2011
Pakistan TV Industry Report 2011Pakistan TV Industry Report 2011
Pakistan TV Industry Report 2011Ejaz Asi
 
2011 Results 2012-2016 Plan
2011 Results 2012-2016 Plan 2011 Results 2012-2016 Plan
2011 Results 2012-2016 Plan Enel S.p.A.
 
Israel’s Economic Highlights Presentation, Q4 2011
Israel’s Economic Highlights Presentation, Q4 2011Israel’s Economic Highlights Presentation, Q4 2011
Israel’s Economic Highlights Presentation, Q4 2011Assaf Luxembourg
 
agilent Operating_Results_Q107_to_Q408
agilent Operating_Results_Q107_to_Q408agilent Operating_Results_Q107_to_Q408
agilent Operating_Results_Q107_to_Q408finance38
 
NewsLetter "Monthy Perspectives Fincor" Novembro 2012
NewsLetter "Monthy Perspectives Fincor" Novembro 2012NewsLetter "Monthy Perspectives Fincor" Novembro 2012
NewsLetter "Monthy Perspectives Fincor" Novembro 2012João Pinto
 
Unemployment reality
Unemployment realityUnemployment reality
Unemployment realityMike Jones
 
Apresentacao renda fixa_final.v2
Apresentacao renda fixa_final.v2Apresentacao renda fixa_final.v2
Apresentacao renda fixa_final.v2risantander
 
Apresentacao renda fixa_final.v2.11.02.11
Apresentacao renda fixa_final.v2.11.02.11Apresentacao renda fixa_final.v2.11.02.11
Apresentacao renda fixa_final.v2.11.02.11risantander
 

Similar to Adding the Domestic Private Sector Financial Balance (20)

Telecom Italia 1Q 2012 Results - Operations - Marco Patuano (10/05/2012)
Telecom Italia 1Q 2012 Results - Operations - Marco Patuano (10/05/2012)Telecom Italia 1Q 2012 Results - Operations - Marco Patuano (10/05/2012)
Telecom Italia 1Q 2012 Results - Operations - Marco Patuano (10/05/2012)
 
Rr results q4_2012_en_final
Rr results q4_2012_en_finalRr results q4_2012_en_final
Rr results q4_2012_en_final
 
Invest in Israel
Invest in IsraelInvest in Israel
Invest in Israel
 
2013 Economic Outlook (NCLGBA)
2013 Economic Outlook (NCLGBA)2013 Economic Outlook (NCLGBA)
2013 Economic Outlook (NCLGBA)
 
April Investor Presentation
April Investor PresentationApril Investor Presentation
April Investor Presentation
 
Sun microsystems Q2 2009 earnings releases
Sun microsystems Q2 2009 earnings releasesSun microsystems Q2 2009 earnings releases
Sun microsystems Q2 2009 earnings releases
 
Bill Handel Discusses Loan Growth at Raddon’s CEO Forum
Bill Handel Discusses Loan Growth at Raddon’s CEO ForumBill Handel Discusses Loan Growth at Raddon’s CEO Forum
Bill Handel Discusses Loan Growth at Raddon’s CEO Forum
 
Pakistan TV Industry Report 2011
Pakistan TV Industry Report 2011Pakistan TV Industry Report 2011
Pakistan TV Industry Report 2011
 
2011 Results 2012-2016 Plan
2011 Results 2012-2016 Plan 2011 Results 2012-2016 Plan
2011 Results 2012-2016 Plan
 
Tv Industry Report 2012
Tv Industry Report 2012Tv Industry Report 2012
Tv Industry Report 2012
 
Israel’s Economic Highlights Presentation, Q4 2011
Israel’s Economic Highlights Presentation, Q4 2011Israel’s Economic Highlights Presentation, Q4 2011
Israel’s Economic Highlights Presentation, Q4 2011
 
agilent Operating_Results_Q107_to_Q408
agilent Operating_Results_Q107_to_Q408agilent Operating_Results_Q107_to_Q408
agilent Operating_Results_Q107_to_Q408
 
avy-NR
avy-NRavy-NR
avy-NR
 
NewsLetter "Monthy Perspectives Fincor" Novembro 2012
NewsLetter "Monthy Perspectives Fincor" Novembro 2012NewsLetter "Monthy Perspectives Fincor" Novembro 2012
NewsLetter "Monthy Perspectives Fincor" Novembro 2012
 
3Q_2008_NR
3Q_2008_NR3Q_2008_NR
3Q_2008_NR
 
Full Year Analyst Briefing as at 31 March 2011
Full Year Analyst Briefing as at 31 March 2011Full Year Analyst Briefing as at 31 March 2011
Full Year Analyst Briefing as at 31 March 2011
 
T españa for_citi_10th_tconference_100323
T españa for_citi_10th_tconference_100323T españa for_citi_10th_tconference_100323
T españa for_citi_10th_tconference_100323
 
Unemployment reality
Unemployment realityUnemployment reality
Unemployment reality
 
Apresentacao renda fixa_final.v2
Apresentacao renda fixa_final.v2Apresentacao renda fixa_final.v2
Apresentacao renda fixa_final.v2
 
Apresentacao renda fixa_final.v2.11.02.11
Apresentacao renda fixa_final.v2.11.02.11Apresentacao renda fixa_final.v2.11.02.11
Apresentacao renda fixa_final.v2.11.02.11
 

More from Mitch Green

Two views of money
Two views of moneyTwo views of money
Two views of moneyMitch Green
 
This Could Change Everything
This Could Change EverythingThis Could Change Everything
This Could Change EverythingMitch Green
 
Money is No Object
Money is No ObjectMoney is No Object
Money is No ObjectMitch Green
 
Did Greenspan "Blow" It?
Did Greenspan "Blow" It?Did Greenspan "Blow" It?
Did Greenspan "Blow" It?Mitch Green
 
What You Know for Sure That Just Ain't So
What You Know for Sure That Just Ain't SoWhat You Know for Sure That Just Ain't So
What You Know for Sure That Just Ain't SoMitch Green
 
It's What You Know for Sure that Just Ain't So
It's What You Know for Sure that Just Ain't SoIt's What You Know for Sure that Just Ain't So
It's What You Know for Sure that Just Ain't SoMitch Green
 
Lesson 1: What is Money?
Lesson 1:  What is Money?Lesson 1:  What is Money?
Lesson 1: What is Money?Mitch Green
 
MMT Basics: You Cannot Consider the Deficit in Isolation
MMT Basics: You Cannot Consider the Deficit in IsolationMMT Basics: You Cannot Consider the Deficit in Isolation
MMT Basics: You Cannot Consider the Deficit in IsolationMitch Green
 
How Germany's Labor Market Reforms Crushed the French and the PIIGS
How Germany's Labor Market Reforms Crushed the French and the PIIGSHow Germany's Labor Market Reforms Crushed the French and the PIIGS
How Germany's Labor Market Reforms Crushed the French and the PIIGSMitch Green
 
Money is No Object: Why We Should and How We Can Achieve Full Employment
Money is No Object: Why We Should and  How We Can Achieve Full EmploymentMoney is No Object: Why We Should and  How We Can Achieve Full Employment
Money is No Object: Why We Should and How We Can Achieve Full EmploymentMitch Green
 
MODERN MONEY AND FUNCTIONAL FINANCE
MODERN MONEY AND FUNCTIONAL FINANCEMODERN MONEY AND FUNCTIONAL FINANCE
MODERN MONEY AND FUNCTIONAL FINANCEMitch Green
 
THE CREDIT MONEY, STATE MONEY, AND ENDOGENOUS MONEY APPROACHES
THE CREDIT MONEY, STATE MONEY, AND ENDOGENOUS MONEY APPROACHESTHE CREDIT MONEY, STATE MONEY, AND ENDOGENOUS MONEY APPROACHES
THE CREDIT MONEY, STATE MONEY, AND ENDOGENOUS MONEY APPROACHESMitch Green
 
How to Teach Money
How to Teach MoneyHow to Teach Money
How to Teach MoneyMitch Green
 
Who Says the Gov't Can't Create Jobs
Who Says the Gov't Can't Create JobsWho Says the Gov't Can't Create Jobs
Who Says the Gov't Can't Create JobsMitch Green
 

More from Mitch Green (15)

Two views of money
Two views of moneyTwo views of money
Two views of money
 
This Could Change Everything
This Could Change EverythingThis Could Change Everything
This Could Change Everything
 
War on Poverty
War on PovertyWar on Poverty
War on Poverty
 
Money is No Object
Money is No ObjectMoney is No Object
Money is No Object
 
Did Greenspan "Blow" It?
Did Greenspan "Blow" It?Did Greenspan "Blow" It?
Did Greenspan "Blow" It?
 
What You Know for Sure That Just Ain't So
What You Know for Sure That Just Ain't SoWhat You Know for Sure That Just Ain't So
What You Know for Sure That Just Ain't So
 
It's What You Know for Sure that Just Ain't So
It's What You Know for Sure that Just Ain't SoIt's What You Know for Sure that Just Ain't So
It's What You Know for Sure that Just Ain't So
 
Lesson 1: What is Money?
Lesson 1:  What is Money?Lesson 1:  What is Money?
Lesson 1: What is Money?
 
MMT Basics: You Cannot Consider the Deficit in Isolation
MMT Basics: You Cannot Consider the Deficit in IsolationMMT Basics: You Cannot Consider the Deficit in Isolation
MMT Basics: You Cannot Consider the Deficit in Isolation
 
How Germany's Labor Market Reforms Crushed the French and the PIIGS
How Germany's Labor Market Reforms Crushed the French and the PIIGSHow Germany's Labor Market Reforms Crushed the French and the PIIGS
How Germany's Labor Market Reforms Crushed the French and the PIIGS
 
Money is No Object: Why We Should and How We Can Achieve Full Employment
Money is No Object: Why We Should and  How We Can Achieve Full EmploymentMoney is No Object: Why We Should and  How We Can Achieve Full Employment
Money is No Object: Why We Should and How We Can Achieve Full Employment
 
MODERN MONEY AND FUNCTIONAL FINANCE
MODERN MONEY AND FUNCTIONAL FINANCEMODERN MONEY AND FUNCTIONAL FINANCE
MODERN MONEY AND FUNCTIONAL FINANCE
 
THE CREDIT MONEY, STATE MONEY, AND ENDOGENOUS MONEY APPROACHES
THE CREDIT MONEY, STATE MONEY, AND ENDOGENOUS MONEY APPROACHESTHE CREDIT MONEY, STATE MONEY, AND ENDOGENOUS MONEY APPROACHES
THE CREDIT MONEY, STATE MONEY, AND ENDOGENOUS MONEY APPROACHES
 
How to Teach Money
How to Teach MoneyHow to Teach Money
How to Teach Money
 
Who Says the Gov't Can't Create Jobs
Who Says the Gov't Can't Create JobsWho Says the Gov't Can't Create Jobs
Who Says the Gov't Can't Create Jobs
 

Recently uploaded

Referendum Party 2024 Election Manifesto
Referendum Party 2024 Election ManifestoReferendum Party 2024 Election Manifesto
Referendum Party 2024 Election ManifestoSABC News
 
Manipur-Book-Final-2-compressed.pdfsal'rpk
Manipur-Book-Final-2-compressed.pdfsal'rpkManipur-Book-Final-2-compressed.pdfsal'rpk
Manipur-Book-Final-2-compressed.pdfsal'rpkbhavenpr
 
N Chandrababu Naidu Launches 'Praja Galam' As Part of TDP’s Election Campaign
N Chandrababu Naidu Launches 'Praja Galam' As Part of TDP’s Election CampaignN Chandrababu Naidu Launches 'Praja Galam' As Part of TDP’s Election Campaign
N Chandrababu Naidu Launches 'Praja Galam' As Part of TDP’s Election Campaignanjanibaddipudi1
 
Brief biography of Julius Robert Oppenheimer
Brief biography of Julius Robert OppenheimerBrief biography of Julius Robert Oppenheimer
Brief biography of Julius Robert OppenheimerOmarCabrera39
 
Top 10 Wealthiest People In The World.pdf
Top 10 Wealthiest People In The World.pdfTop 10 Wealthiest People In The World.pdf
Top 10 Wealthiest People In The World.pdfauroraaudrey4826
 
Quiz for Heritage Indian including all the rounds
Quiz for Heritage Indian including all the roundsQuiz for Heritage Indian including all the rounds
Quiz for Heritage Indian including all the roundsnaxymaxyy
 
Opportunities, challenges, and power of media and information
Opportunities, challenges, and power of media and informationOpportunities, challenges, and power of media and information
Opportunities, challenges, and power of media and informationReyMonsales
 
Chandrayaan 3 Successful Moon Landing Mission.pdf
Chandrayaan 3 Successful Moon Landing Mission.pdfChandrayaan 3 Successful Moon Landing Mission.pdf
Chandrayaan 3 Successful Moon Landing Mission.pdfauroraaudrey4826
 
Dynamics of Destructive Polarisation in Mainstream and Social Media: The Case...
Dynamics of Destructive Polarisation in Mainstream and Social Media: The Case...Dynamics of Destructive Polarisation in Mainstream and Social Media: The Case...
Dynamics of Destructive Polarisation in Mainstream and Social Media: The Case...Axel Bruns
 
57 Bidens Annihilation Nation Policy.pdf
57 Bidens Annihilation Nation Policy.pdf57 Bidens Annihilation Nation Policy.pdf
57 Bidens Annihilation Nation Policy.pdfGerald Furnkranz
 
Global Terrorism and its types and prevention ppt.
Global Terrorism and its types and prevention ppt.Global Terrorism and its types and prevention ppt.
Global Terrorism and its types and prevention ppt.NaveedKhaskheli1
 
Different Frontiers of Social Media War in Indonesia Elections 2024
Different Frontiers of Social Media War in Indonesia Elections 2024Different Frontiers of Social Media War in Indonesia Elections 2024
Different Frontiers of Social Media War in Indonesia Elections 2024Ismail Fahmi
 
complaint-ECI-PM-media-1-Chandru.pdfra;;prfk
complaint-ECI-PM-media-1-Chandru.pdfra;;prfkcomplaint-ECI-PM-media-1-Chandru.pdfra;;prfk
complaint-ECI-PM-media-1-Chandru.pdfra;;prfkbhavenpr
 
HARNESSING AI FOR ENHANCED MEDIA ANALYSIS A CASE STUDY ON CHATGPT AT DRONE EM...
HARNESSING AI FOR ENHANCED MEDIA ANALYSIS A CASE STUDY ON CHATGPT AT DRONE EM...HARNESSING AI FOR ENHANCED MEDIA ANALYSIS A CASE STUDY ON CHATGPT AT DRONE EM...
HARNESSING AI FOR ENHANCED MEDIA ANALYSIS A CASE STUDY ON CHATGPT AT DRONE EM...Ismail Fahmi
 
AP Election Survey 2024: TDP-Janasena-BJP Alliance Set To Sweep Victory
AP Election Survey 2024: TDP-Janasena-BJP Alliance Set To Sweep VictoryAP Election Survey 2024: TDP-Janasena-BJP Alliance Set To Sweep Victory
AP Election Survey 2024: TDP-Janasena-BJP Alliance Set To Sweep Victoryanjanibaddipudi1
 
VIP Girls Available Call or WhatsApp 9711199012
VIP Girls Available Call or WhatsApp 9711199012VIP Girls Available Call or WhatsApp 9711199012
VIP Girls Available Call or WhatsApp 9711199012ankitnayak356677
 

Recently uploaded (16)

Referendum Party 2024 Election Manifesto
Referendum Party 2024 Election ManifestoReferendum Party 2024 Election Manifesto
Referendum Party 2024 Election Manifesto
 
Manipur-Book-Final-2-compressed.pdfsal'rpk
Manipur-Book-Final-2-compressed.pdfsal'rpkManipur-Book-Final-2-compressed.pdfsal'rpk
Manipur-Book-Final-2-compressed.pdfsal'rpk
 
N Chandrababu Naidu Launches 'Praja Galam' As Part of TDP’s Election Campaign
N Chandrababu Naidu Launches 'Praja Galam' As Part of TDP’s Election CampaignN Chandrababu Naidu Launches 'Praja Galam' As Part of TDP’s Election Campaign
N Chandrababu Naidu Launches 'Praja Galam' As Part of TDP’s Election Campaign
 
Brief biography of Julius Robert Oppenheimer
Brief biography of Julius Robert OppenheimerBrief biography of Julius Robert Oppenheimer
Brief biography of Julius Robert Oppenheimer
 
Top 10 Wealthiest People In The World.pdf
Top 10 Wealthiest People In The World.pdfTop 10 Wealthiest People In The World.pdf
Top 10 Wealthiest People In The World.pdf
 
Quiz for Heritage Indian including all the rounds
Quiz for Heritage Indian including all the roundsQuiz for Heritage Indian including all the rounds
Quiz for Heritage Indian including all the rounds
 
Opportunities, challenges, and power of media and information
Opportunities, challenges, and power of media and informationOpportunities, challenges, and power of media and information
Opportunities, challenges, and power of media and information
 
Chandrayaan 3 Successful Moon Landing Mission.pdf
Chandrayaan 3 Successful Moon Landing Mission.pdfChandrayaan 3 Successful Moon Landing Mission.pdf
Chandrayaan 3 Successful Moon Landing Mission.pdf
 
Dynamics of Destructive Polarisation in Mainstream and Social Media: The Case...
Dynamics of Destructive Polarisation in Mainstream and Social Media: The Case...Dynamics of Destructive Polarisation in Mainstream and Social Media: The Case...
Dynamics of Destructive Polarisation in Mainstream and Social Media: The Case...
 
57 Bidens Annihilation Nation Policy.pdf
57 Bidens Annihilation Nation Policy.pdf57 Bidens Annihilation Nation Policy.pdf
57 Bidens Annihilation Nation Policy.pdf
 
Global Terrorism and its types and prevention ppt.
Global Terrorism and its types and prevention ppt.Global Terrorism and its types and prevention ppt.
Global Terrorism and its types and prevention ppt.
 
Different Frontiers of Social Media War in Indonesia Elections 2024
Different Frontiers of Social Media War in Indonesia Elections 2024Different Frontiers of Social Media War in Indonesia Elections 2024
Different Frontiers of Social Media War in Indonesia Elections 2024
 
complaint-ECI-PM-media-1-Chandru.pdfra;;prfk
complaint-ECI-PM-media-1-Chandru.pdfra;;prfkcomplaint-ECI-PM-media-1-Chandru.pdfra;;prfk
complaint-ECI-PM-media-1-Chandru.pdfra;;prfk
 
HARNESSING AI FOR ENHANCED MEDIA ANALYSIS A CASE STUDY ON CHATGPT AT DRONE EM...
HARNESSING AI FOR ENHANCED MEDIA ANALYSIS A CASE STUDY ON CHATGPT AT DRONE EM...HARNESSING AI FOR ENHANCED MEDIA ANALYSIS A CASE STUDY ON CHATGPT AT DRONE EM...
HARNESSING AI FOR ENHANCED MEDIA ANALYSIS A CASE STUDY ON CHATGPT AT DRONE EM...
 
AP Election Survey 2024: TDP-Janasena-BJP Alliance Set To Sweep Victory
AP Election Survey 2024: TDP-Janasena-BJP Alliance Set To Sweep VictoryAP Election Survey 2024: TDP-Janasena-BJP Alliance Set To Sweep Victory
AP Election Survey 2024: TDP-Janasena-BJP Alliance Set To Sweep Victory
 
VIP Girls Available Call or WhatsApp 9711199012
VIP Girls Available Call or WhatsApp 9711199012VIP Girls Available Call or WhatsApp 9711199012
VIP Girls Available Call or WhatsApp 9711199012
 

Adding the Domestic Private Sector Financial Balance

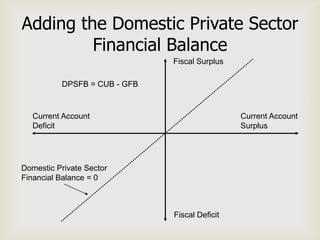
  • 1. Adding the Domestic Private Sector Financial Balance Fiscal Surplus DPSFB = CUB - GFB Current Account Current Account Deficit Surplus Domestic Private Sector Financial Balance = 0 Fiscal Deficit
  • 2. Portugal Government Surplus 5% 3% Current Account Deficit Current Account Surplus 1% -15% -13% -11% -9% -7% -5% -3% -1% 1% 3% 5% -1% 2000 2003 2001 2005 2004 2008 -3% 2009 1999 1998 2007 2002 1997 Unemployment >= 7.5% 1996 -5% Unemployment < 7.5% 2006 Private Sector Balance = 0 Government Deficit -7% 2011 -9% 2010 -11% -13% -15%
  • 3. Portugal 4% 2% 0% 1996 1997 1998 1999 2000 2001 2002 2003 2004 2005 2006 2007 2008 2009 2010 2011 -2% Percent of GDP -4% Government Balance Private Balance -6% -8% -10% -12% Year
  • 4. Italy 6% Government Surplus 4% 2% 0% -4% -3% -2% -1% 0% 1% 2% 3% 4% Current Account Deficit 2001 Current Account Surplus Unemployment >= 7.5% Unemployment < 7.5% 2008 2000 Private Sector Balance = 0 -2% 2009 1999 1998 2003 2002 2007 Government Deficit 2004 2005 -4% 2006 2011 2010 -6% 1997 1996 -8%
  • 5. Italy 12% 10% 8% 6% 4% Percent of GDP 2% Government Balance 0% Private Balance 1996 1997 1998 1999 2000 2001 2002 2003 2004 2005 2006 2007 2008 2009 2010 2011 -2% -4% -6% -8% -10% Year
  • 6. Ireland 15% Government Surplus 10% 2001 5% 2007 1999 2005 2000 2002 1998 2008 2006 0% 2003 1997 -8% -6% -4% -2% 2004 0% 2% 4% 1996 -5% 2009 Unemployment >= 7.5% -10% Unemployment < 7.5% Private Sector Balance = 0 2010 Government Deficit -15% -20% -25% -30% 2011 Current Account Deficit -35% Current Account Surplus
  • 7. Ireland 40% 30% 20% 10% Percent of GDP 0% Government Balance 1996 1997 1998 1999 2000 2001 2002 2003 2004 2005 2006 2007 2008 2009 2010 2011 Private Balance -10% -20% -30% -40% Year
  • 8. Greece 0% -16% -14% -12% -10% -8% -6% -4% -2% 0% -2% 2000 2001 1999 -4% 2002 2003 2007 2006 2004 1998 -6% Government Deficit 2008 1997 2005 -8% Unemployment >= 7.5% Private Sector Balance = 0 1996 2009 -10% 2011 -12% -14% 2010 -16% Current Account Deficit
  • 9. Greece 10% 5% 0% 1996 1997 1998 1999 2000 2001 2002 2003 2004 2005 2006 2007 2008 2009 2010 2011 Percent of GDP -5% Government Balance Private Balance -10% -15% -20% Year
  • 10. Spain Government Surplus 2007 2008 2% 2006 2005 2004 0% -12% -10% -8% -6% -4% 2003 2002 -2% 0% 2% 2001 2000 -2% 1999 1998 -4% Unemployment >= 7.5% 2009 1997 Private Sector Balance = 0 Government Deficit Series4 -6% 1996 -8% 2011 -10% 2010 Current Account Deficit -12% Current Account Surplus
  • 11. Spain 10% 5% 0% 1996 1997 1998 1999 2000 2001 2002 2003 2004 2005 2006 2007 2008 2009 2010 2011 Percent of GDP Government Balance Private Balance -5% -10% -15% Year
  • 12. Germany 2% Government Surplus 2001 1% Current Account Deficit Current Account Surplus 2008 0% 2009 -4% -2% 0% 2% 4% 6% 8% -1% Unemployment >= 7.5% 2000 2007 Unemployment < 7.5% Private Sector Balance = 0 -2% 1999 1998 Government Deficit 2002 -3% 2010 1997 2006 2003 2005 -4% 2004 2011 -5%
  • 13. Germany 12% 10% 8% 6% Percent of GDP 4% Government Balance Private Balance 2% 0% 1997 1998 1999 2000 2001 2002 2003 2004 2005 2006 2007 2008 2009 2010 2011 -2% -4% -6% Year
  • 14. United Kingdom 6% 4% 2001 2% 1999 2002 0% 2000 -4% -3% -2% -1% 0% 2003 -2% 2007 2008 1998 2006 2004 Unemployment >= 7.5% 2005 -4% Unemployment < 7.5% 1997 Private Sector Balance = 0 2009 1996 -6% -8% -10% 2011 2010 -12% -14%
  • 15. United Kingdom 15% 10% 5% Percent of GDP 0% Government Balance 1996 1997 1998 1999 2000 2001 2002 2003 2004 2005 2006 2007 2008 2009 2010 2011 Private Sector Balance -5% -10% -15% Year
  • 16. Japan 1% -1% 0% 1% 2% 3% 4% 5% 6% -1% 2007 2008 2009 -3% 1998 Government Deficit 1996 -5% 1997 2002 Unemployment < 7.5% 2005 Private Sector Balance = 0 2006 -7% 2000 2004 2010 2001 2003 2011 -9% -11% 1999 -13% Current Account Surplus
  • 17. Japan 20% 15% 10% 5% Percent of GDP Government Balance Private Balance 0% 1996 1997 1998 1999 2000 2001 2002 2003 2004 2005 2006 2007 2008 2009 2010 2011 -5% -10% -15% Year
  • 18. Government Surplus United States 4% 2% 2001 2000 2002 1999 0% -7% -6% -5% -4% -3% -2% -1% 0% 1998 2008 1997 -2% 2007 Government Deficit 2003 1996 2006 Unemployment >= 7.5% -4% Unemployment < 7.5% 2009 2005 Private Sector Balance = 0 2004 -6% -8% -10% 2011 2010 -12% Current Account Deficit
  • 19. United States 10% 5% 0% 1996 1997 1998 1999 2000 2001 2002 2003 2004 2005 2006 2007 2008 2009 2010 2011 Percent of GDP Government Balance Private Balance -5% -10% -15% Year
  • 20. Current Account 1996 4.0% 3.0% 2.0% 1.0% Percent of GDP 0.0% Portugal Italy Ireland Greece Spain Germany France -1.0% -2.0% -3.0% -4.0%
  • 21. Current Account 1997 4.0% 3.0% 2.0% 1.0% 0.0% Portugal Italy Ireland Greece Spain Germany France Percent of GDP -1.0% -2.0% -3.0% -4.0% -5.0% -6.0% -7.0%
  • 22. Current Account 1998 4.0% 2.0% 0.0% Portugal Italy Ireland Greece Spain Germany France Percent of GDP -2.0% -4.0% -6.0% -8.0%
  • 23. Current Account 1999 4.0% 2.0% 0.0% Portugal Italy Ireland Greece Spain Germany France -2.0% Percent of GDP -4.0% -6.0% -8.0% -10.0%
  • 24. Current Account 2000 4.0% 2.0% 0.0% Portugal Italy Ireland Greece Spain Germany France -2.0% Percent of GDP -4.0% -6.0% -8.0% -10.0% -12.0%
  • 25. Current Account 2001 4.0% 2.0% 0.0% Portugal Italy Ireland Greece Spain Germany France -2.0% Percent of GDP -4.0% -6.0% -8.0% -10.0% -12.0%
  • 26. Current Account 2002 4.0% 2.0% 0.0% Portugal Italy Ireland Greece Spain Germany France -2.0% Percent of GDP -4.0% -6.0% -8.0% -10.0%
  • 27. Current Account 2003 3.0% 2.0% 1.0% 0.0% Portugal Italy Ireland Greece Spain Germany France -1.0% Percent of GDP -2.0% -3.0% -4.0% -5.0% -6.0% -7.0%
  • 28. Current Account 2004 6.0% 4.0% 2.0% 0.0% Portugal Italy Ireland Greece Spain Germany France Percent of GDP -2.0% -4.0% -6.0% -8.0% -10.0%
  • 29. Current Account 2005 6.0% 4.0% 2.0% 0.0% Portugal Italy Ireland Greece Spain Germany France Percent of GDP -2.0% -4.0% -6.0% -8.0% -10.0% -12.0%
  • 30. Current Account 2006 8.0% 6.0% 4.0% 2.0% 0.0% Portugal Italy Ireland Greece Spain Germany France Percent of GDP -2.0% -4.0% -6.0% -8.0% -10.0% -12.0% -14.0%
  • 31. Current Account 2007 10.0% 5.0% 0.0% Portugal Italy Ireland Greece Spain Germany France Percent of GDP -5.0% -10.0% -15.0% -20.0%
  • 32. Current Account 2008 10.0% 5.0% 0.0% Portugal Italy Ireland Greece Spain Germany France Percent of GDP -5.0% -10.0% -15.0% -20.0%
  • 33. Current Account 2009 6.0% 4.0% 2.0% 0.0% Portugal Italy Ireland Greece Spain Germany France -2.0% Percent of GDP -4.0% -6.0% -8.0% -10.0% -12.0% -14.0%
  • 34. Current Account 2010 8.0% 6.0% 4.0% 2.0% 0.0% Portugal Italy Ireland Greece Spain Germany France Percent of GDP -2.0% -4.0% -6.0% -8.0% -10.0% -12.0%
  • 35. Current Account 2011 8.0% 6.0% 4.0% 2.0% 0.0% Portugal Italy Ireland Greece Spain Germany France Percent of GDP -2.0% -4.0% -6.0% -8.0% -10.0% -12.0%