Energy Cost Report Infographic
•
0 likes•501 views

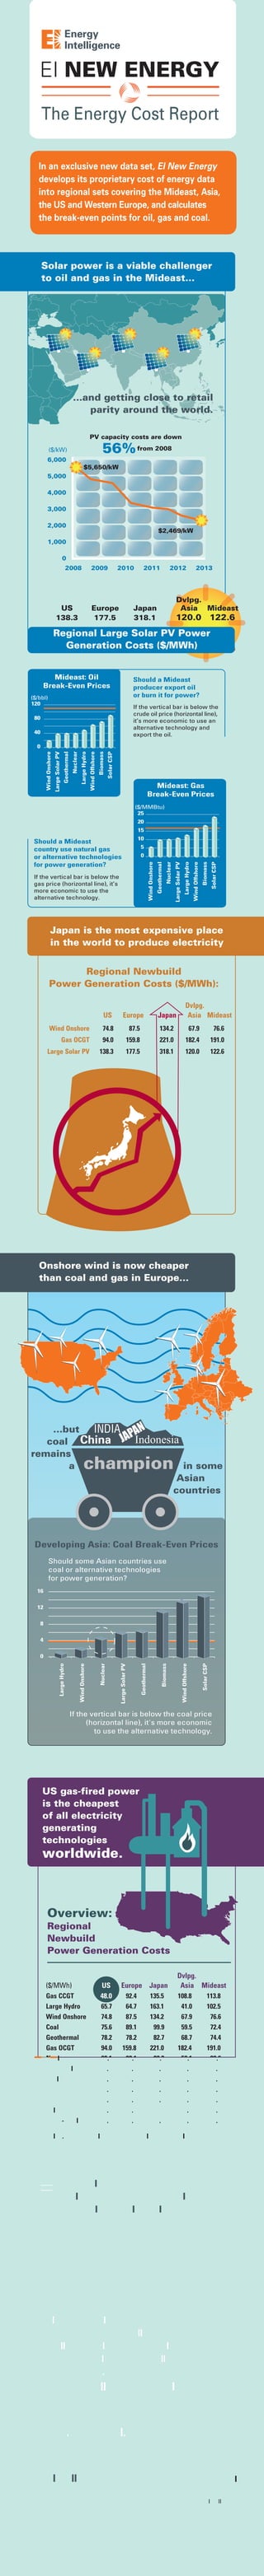
The document summarizes key findings from a new energy cost report by EI New Energy that analyzes the cost of generating electricity from different sources across various world regions. Some of the main points include: - Solar power is now cost competitive with oil and gas in the Middle East and nearing parity globally as PV costs have dropped 56% since 2008. - In many regions, the break-even price for solar and wind is below prevailing oil, gas, and coal prices, suggesting these alternatives are more economical for new power generation. - Gas-fired power is the cheapest option for new builds in the US while coal remains competitive in some Asian countries like China and India. - Japan has the highest costs

Recommended
More Related Content
What's hot
What's hot (20)
Viewers also liked
Viewers also liked (17)
Similar to Energy Cost Report Infographic
Similar to Energy Cost Report Infographic (20)
More from Energy Intelligence
More from Energy Intelligence (20)
Recently uploaded
Recently uploaded (20)
Energy Cost Report Infographic
- 1. The Energy Cost Report In an exclusive new data set, EI New Energy develops its proprietary cost of energy data into regional sets covering the Mideast, Asia, the US and Western Europe, and calculates the break-even points for oil, gas and coal. Solar power is a viable challenger to oil and gas in the Mideast... ...and getting close to retail parity around the world. PV capacity costs are down 56% from 2008 ($/kW) 6,000 $5,650/kW 5,000 4,000 3,000 2,000 $2,469/kW 1,000 0 2008 2009 2010 Europe 177.5 US 138.3 2011 2012 2013 Dvlpg. Asia Mideast Japan 318.1 120.0 122.6 Regional Large Solar PV Power Generation Costs ($/MWh) Mideast: Oil Break-Even Prices Should a Mideast producer export oil or burn it for power? ($/bbl) 120 If the vertical bar is below the crude oil price (horizontal line), it’s more economic to use an alternative technology and export the oil. 80 40 Solar CSP Biomass Wind Offshore Large Hydro Nuclear Geothermal Large Solar PV Wind Onshore 0 Mideast: Gas Break-Even Prices ($/MMBtu) 25 20 15 10 Should a Mideast country use natural gas or alternative technologies for power generation? 5 Solar CSP Biomass Wind Offshore Large Hydro Large Solar PV Nuclear If the vertical bar is below the gas price (horizontal line), it’s more economic to use the alternative technology. Geothermal Wind Onshore 0 Japan is the most expensive place in the world to produce electricity Regional Newbuild Power Generation Costs ($/MWh): Dvlpg. Asia Mideast US Europe Japan Wind Onshore 74.8 87.5 134.2 67.9 76.6 Gas OCGT 94.0 159.8 221.0 182.4 191.0 Large Solar PV 138.3 177.5 318.1 120.0 122.6 Onshore wind is now cheaper than coal and gas in Europe... ...but INDIA PAN coal China JA Indonesia remains in some a Asian countries champion Developing Asia: Coal Break-Even Prices Should some Asian countries use coal or alternative technologies for power generation? 16 12 8 4 Solar CSP Wind Offshore Biomass Geothermal Large Solar PV Nuclear Wind Onshore Large Hydro 0 If the vertical bar is below the coal price (horizontal line), it's more economic to use the alternative technology. US gas-fired power is the cheapest of all electricity generating technologies worldwide. Overview: Regional Newbuild Power Generation Costs ($/MWh) Gas CCGT Large Hydro Wind Onshore Coal Geothermal Gas OCGT Nuclear Large Solar PV Coal with CCS Biomass Wind Offshore Solar CSP Wave-Tidal US 48.0 65.7 74.8 75.6 78.2 94.0 98.1 138.3 147.0 149.0 177.7 222.6 288.3 Europe Japan Dvlpg. Asia Mideast 92.4 64.7 87.5 89.1 78.2 159.8 98.1 177.5 159.0 149.0 176.8 226.9 288.3 108.8 41.0 67.9 59.5 68.7 182.4 59.1 120.0 118.7 117.1 157.3 171.0 294.2 135.5 163.1 134.2 99.9 82.7 221.0 88.3 318.1 179.3 147.5 182.8 NA 276.1 113.8 102.5 76.6 72.4 74.4 191.0 80.6 122.6 135.8 136.6 141.2 185.3 285.1 Dvlpg. Asia = developing Asia, mostly China and India Should the Mideast use its oil and gas more efficiently, or should it deploy solar power at home, and export more to market? How do the economics stack up? $ € ¥ £ Uploaded weekly, the data measures both the investment cost of installing power capacity, in dollars per kilowatt, and the lifetime cost of generating electricity, in dollars per megawatt hour. To get the full picture download the Energy Cost Report from EI New Energy now at www.energyintel.com/newenergycosts @energyintel ©2014 Energy Intelligence