Cost Trend Update Bulletin July-2018
•
1 like•778 views

The Duff & Phelps cost trend update is now available for both the Construction Cost and Equipment Cost indices. This trend update dates back to 2015 and shows how the last four years has been relatively stable for construction after a decade of volatility, while the equipment cost indices continues to show moderate year-on-year changes. Please be reminded that these indices are just average indicators of change and they are not absolutes. Duff & Phelps advises that after five to seven years, you should establish a new replacement cost basis by using a qualified valuation professional. Please contact Brad Schulz at Duff & Phelps to discuss establishing a new replacement cost basis.

Recommended
Recommended
More Related Content
What's hot
What's hot (19)
Similar to Cost Trend Update Bulletin July-2018
Similar to Cost Trend Update Bulletin July-2018 (20)
More from Duff & Phelps
More from Duff & Phelps (20)
Recently uploaded
Recently uploaded (20)
Cost Trend Update Bulletin July-2018
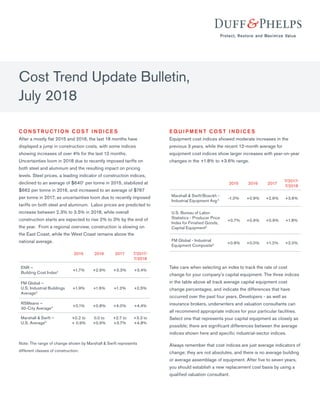
- 1. C O N S T R U C T I O N C OS T I N D I C E S After a mostly flat 2015 and 2016, the last 18 months have displayed a jump in construction costs, with some indices showing increases of over 4% for the last 12 months. Uncertainties loom in 2018 due to recently imposed tariffs on both steel and aluminum and the resulting impact on pricing levels. Steel prices, a leading indicator of construction indices, declined to an average of $6401 per tonne in 2015, stabilized at $662 per tonne in 2016, and increased to an average of $767 per tonne in 2017, as uncertainties loom due to recently imposed tariffs on both steel and aluminum. Labor prices are predicted to increase between 2.3% to 3.5% in 2018, while overall construction starts are expected to rise 2% to 3% by the end of the year. From a regional overview, construction is slowing on the East Coast, while the West Coast remains above the national average. 2015 2016 2017 7/2017- 7/2018 ENR – Building Cost Index2 +1.7% +2.9% +3.3% +3.4% FM Global – U.S. Industrial Buildings Average3 +1.9% +1.6% +1.2% +2.5% RSMeans – 30-City Average4 +0.1% +0.8% +4.0% +4.4% Marshall & Swift – U.S. Average5 +0.2 to + 0.9% 0.0 to +0.9% +2.7 to +3.7% +3.3 to +4.8% Note: The range of change shown by Marshall & Swift represents different classes of construction. E Q U I P M E N T C OS T I N D I C E S Equipment cost indices showed moderate increases in the previous 3 years, while the recent 12-month average for equipment cost indices show larger increases with year-on-year changes in the +1.8% to +3.6% range. 2015 2016 2017 7/2017- 7/2018 Marshall & Swift/Boeckh - Industrial Equipment Avg.5 -1.0% +0.9% +2.6% +3.6% U.S. Bureau of Labor Statistics - Producer Price Index for Finished Goods, Capital Equipment6 +0.7% +0.9% +0.9% +1.8% FM Global - Industrial Equipment Composite3 +0.8% +0.0% +1.2% +2.0% Take care when selecting an index to track the rate of cost change for your company’s capital equipment. The three indices in the table above all track average capital equipment cost change percentages, and indicate the differences that have occurred over the past four years. Developers - as well as insurance brokers, underwriters and valuation consultants can all recommend appropriate indices for your particular facilities. Select one that represents your capital equipment as closely as possible; there are significant differences between the average indices shown here and specific industrial-sector indices. Always remember that cost indices are just average indicators of change; they are not absolutes, and there is no average building or average assemblage of equipment. After five to seven years, you should establish a new replacement cost basis by using a qualified valuation consultant. Cost Trend Update Bulletin, July 2018
- 2. Cost Trend Update Bulletin, July 2018 About Duff & Phelps Duff & Phelps is the global advisor that protects, restores and maximizes value for clients in the areas of valuation, corporate finance, investigations, disputes, cyber security, compliance and regulatory matters, and other governance-related issues. We work with clients across diverse sectors, mitigating risk to assets, operations and people. With Kroll, a division of Duff & Phelps since 2018, our firm has nearly 3,500 professionals in 28 countries around the world. For more information, visit www.duffandphelps.com. © 2018 Duff & Phelps, LLC. All rights reserved. DP181081 M&A advisory, capital raising and secondary market advisory services in the United States are provided by Duff & Phelps Securities, LLC. Member FINRA/SIPC. Pagemill Partners is a Division of Duff & Phelps Securities, LLC. M&A advisory, capital raising and secondary market advisory services in the United Kingdom are provided by Duff & Phelps Securities Ltd. (DPSL), which is authorized and regulated by the Financial Conduct Authority. M&A advisory and capital raising services in Germany are provided by Duff & Phelps GmbH, which is a Tied Agent of DPSL. Valuation Advisory Services in India are provided by Duff & Phelps India Private Limited under a category 1 merchant banker license issued by the Securities and Exchange Board of India. S O U R C E S 1. MEPS (International), Ltd, All carbon steel products composite price and index 2. Engineering News-Record, Monthly Construction Economics Report 3. FM Global, Industrial Cost Trends 4. RSMeans, Construction Cost Indices, 30-City Average 5. Marshall & Swift/Boeckh, Marshall Valuation Service, Quarterly Cost Index 6. US Bureau of Labor Statistics, Producer Price Index for Finished Goods - Capital Equipment C O N TAC T Brad Schulz Managing Director bradley.schulz@duffandphelps.com +1 630 541 4656