D&B Viability Rating Quick Guide
•
1 like•4,148 views

The D&B Viability Rating is a new evaluation tool that offers a comprehensive assessment of whether or not to do business with a company. Only the D&B Viability Rating combines the most comprehensive measures of risk to deliver a highly reliable rating analyzing the current and future health of a business.

Recommended
Recommended
More Related Content
Viewers also liked
Viewers also liked (15)
Similar to D&B Viability Rating Quick Guide
Similar to D&B Viability Rating Quick Guide (20)
More from Dun & Bradstreet
More from Dun & Bradstreet (20)
D&B Viability Rating Quick Guide
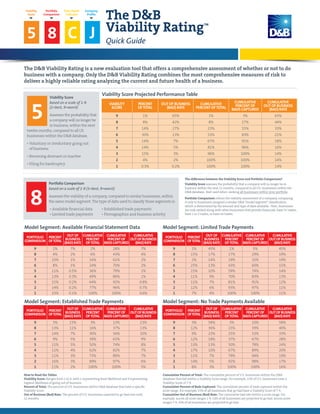
- 1. Viability Score 5 8 Portfolio Comparison C Data Depth Indicator J Company Profile The D&B Viability Rating is a new evaluation tool that offers a comprehensive assessment of whether or not to do business with a company. Only the D&B Viability Rating combines the most comprehensive measures of risk to deliver a highly reliable rating analyzing the current and future health of a business. Viability Score based on a scale of 1-9 (1=best, 9=worst) Assesses the probability that a company will no longer be in business, within the next twelve months, compared to all US businesses within the D&B database. • Voluntary or involuntary going out of business • Becoming dormant or inactive • Filing for bankruptcy VIABILITY SCORE PERCENT OFTOTAL OUT OF BUSINESS (BAD) RATE CUMULATIVE PERCENT OFTOTAL CUMULATIVE PERCENT OF BADS CAPTURED CUMULATIVE OUT OF BUSINESS (BAD) RATE 9 1% 65% 1% 3% 65% 8 8% 42% 8% 27% 44% 7 14% 27% 23% 55% 33% 6 30% 13% 53% 83% 21% 5 14% 7% 67% 91% 18% 4 14% 5% 81% 96% 16% 3 15% 3% 96% 100% 14% 2 4% 2% 100% 100% 14% 1 0.3% 0.2% 100% 100% 14% 5 Viability Score Projected Performance Table The DB Viability Rating™ Quick Guide PORTFOLIO COMPARISON PERCENT OFTOTAL OUT OF BUSINESS (BAD) RATE CUMULATIVE PERCENT OFTOTAL CUMULATIVE PERCENTOF BADSCAPTURED CUMULATIVE OUTOFBUSINESS (BAD)RATE 9 2% 7% 2% 28% 7% 8 4% 2% 6% 43% 4% 7 10% 1% 16% 61% 2% 6 8% 1% 24% 70% 2% 5 11% 0.5% 36% 79% 1% 4 13% 0.3% 49% 86% 1% 3 15% 0.2% 64% 92% 0.8% 2 14% 0.2% 77% 96% 0.7% 1 23% 0.1% 100% 100% 0.6% Model Segment: Available Financial Statement Data PORTFOLIO COMPARISON PERCENT OFTOTAL OUT OF BUSINESS (BAD) RATE CUMULATIVE PERCENT OFTOTAL CUMULATIVE PERCENTOF BADSCAPTURED CUMULATIVE OUTOFBUSINESS (BAD)RATE 9 3% 23% 3% 13% 23% 8 13% 11% 16% 37% 13% 7 14% 7% 30% 56% 10% 6 9% 5% 39% 65% 9% 5 11% 5% 50% 74% 8% 4 11% 4% 62% 82% 7% 3 11% 3% 73% 89% 7% 2 16% 3% 89% 97% 6% 1 11% 2% 100% 100% 5% Model Segment: Established Trade Payments PORTFOLIO COMPARISON PERCENT OFTOTAL OUT OF BUSINESS (BAD) RATE CUMULATIVE PERCENT OFTOTAL CUMULATIVE PERCENTOF BADSCAPTURED CUMULATIVE OUTOFBUSINESS (BAD)RATE 9 1% 45% 1% 5% 45% 8 15% 17% 17% 29% 19% 7 2% 14% 19% 32% 19% 6 25% 13% 43% 60% 15% 5 15% 10% 59% 74% 14% 4 11% 9% 70% 83% 13% 3 11% 7% 81% 91% 12% 2 12% 6% 93% 97% 11% 1 7% 4% 100% 100% 11% Model Segment: Limited Trade Payments PORTFOLIO COMPARISON PERCENT OFTOTAL OUT OF BUSINESS (BAD) RATE CUMULATIVE PERCENT OFTOTAL CUMULATIVE PERCENTOF BADSCAPTURED CUMULATIVE OUTOFBUSINESS (BAD)RATE 9 3% 58% 3% 10% 58% 8 12% 36% 15% 39% 40% 7 9% 23% 25% 53% 33% 6 12% 18% 37% 67% 28% 5 13% 13% 50% 78% 24% 4 17% 10% 67% 89% 20% 3 11% 7% 79% 94% 19% 2 14% 5% 92% 98% 17% 1 8% 3% 100% 100% 16% Model Segment: No Trade Payments Available Portfolio Comparison based on a scale of 1-9 (1=best, 9=worst) Assesses the viability of a company, compared to similar businesses, within the same model segment. The type of data used to classify these segments is: • Available financial data • Established trade payments • Limited trade payments • Firmographics and business activity 8 The difference between the Viability Score and Portfolio Comparison? Viability Score assesses the probability that a company will no longer be in business within the next 12 months, compared to all U.S. businesses within the DB database. Best used when ranking all businesses within your portfolio. Portfolio Comparison refines the viability assessment of a company, comparing it only to businesses assigned a similar DB “model segment”classification, which is determined by the amount and type of data available. Here, businesses are only ranked along with other businesses that provide financials, have 3+ trades, have 1 or 2 trades, or have no trades. How to Read the Tables Viability Score: Ranges from 1 to 9, with 1 representing least likelihood and 9 representing highest likelihood of going out of business. Percent of Total: The percent of U.S. businesses within DB database that have a specific Viability Score. Out of Business (Bad) Rate: The percent of U.S. businesses expected to go bad over next 12 months. Cumulative Percent of Total: The cumulative percent of U.S. businesses within the DB database that fall within a Viability Score range. For example, 23% of U.S. businesses have a Viability Score of 7-9. Cumulative Percent of Bads Captured: The cumulative percent of bads captured within the score range. For example, 55% of all businesses that go bad have a Viability Score of 7-9. Cumulative Out of Business (Bad) Rate: The cumulative bad rate within a score range. For example, across all score ranges 1-9, 14% of all businesses are projected to go bad. Across score ranges 7-9, 33% of all businesses are projected to go bad.
- 2. A Financials, large, established B Financials, large, young C Financials, medium, established D Financials, medium, young E Financials, small, established F Financials, small, young G 3+Trade, large, established H 3+Trade, large, young I 3+Trade, medium, established j 3+Trade, medium, young K 3+Trade, small, established L 3+Trade, small, young M 1-2Trade, large, established N 1-2Trade, large, young O 1-2Trade, medium, established P 1-2Trade, medium, young Q 1-2Trade, small, established R 1-2Trade, small, young S NoTrade, large, established T NoTrade, large, young U NoTrade, medium, established V NoTrade, medium, young W NoTrade, small, established X NoTrade, small, young Y Branch Z Subsidiary Company Profile based on a scale of A-Z Examines how established a company is based on a combination of categories including financial data, trade payments, and demographics on the different categories within the profile include: • Financial data • Trade payments • Years in business • Company size (number of employees or sales) • Firmographic Data J About Dun Bradstreet® (DB) Dun Bradstreet (NYSE:DNB) is the world’s leading source of commercial information and insight on businesses, enabling companies to Decide with Confidence® for 171 years. DB’s global commercial database contains more than 220 million business records. The database is enhanced by DB’s proprietary DUNSRight® Quality Process, which provides our customers with quality business information. This quality information is the foundation of our global solutions that customers rely on to make critical business decisions. For more information, please visit www.dnb.com. © Dun Bradstreet, Inc. 2013. All rights reserved. (DB-3522 6/13) Data Depth Indicator based on a scale of A-M Represents the level of predictive data available for a company. This indicator is based on a scale from A – G, where A indicates the greatest level of predictive data, such as financial statements, and G reflects a minimal level of data, such as firmographics only. Special categories H-M are assigned to businesses with special risk circumstances such as bankruptcy, business deterioration, severe risk and others. • Commercial trading activity • Financial attributes • Firmograpic data C DATA DEPTH DESCRIPTION LEVEL OF INSIGHT A Rich firmographics, extensive commercial trading activity, and comprehensive financial attributes Robust Predictions B Rich firmographics, extensive commercial trading activity, and/or basic financial attributes C Rich firmographics, extensive commercial trading activity, and no financial attributes Decision Support D Rich firmographics, partial commercial trading activity, and no financial attributes Directional E Rich firmographics, sparse commercial trading activity, and no financial attributes F Basic firmographics, trace commercial trading activity, and no financial attributes Basic G Basic firmographics, and no trade or financial attributes H Out of business I Unable to comfirm j Bankruptcy K High-risk - Severe risk L Self-reported DUNS Support Record M Business deterioriation –Severe Risk DescriptivePredictive Data Depth Indicator Detailed Table