More Related Content
Similar to Analyst Note February 2014 (20)
Analyst Note February 2014
- 1. Canada
February 2014
Here’s the Deal on Delivery
As a result, dealers have employed differing strategies
when it comes to the final vehicle delivery process, in
order to maximize both customer satisfaction as well the
bottom line. But among the strategies most often in place
(salesperson led delivery, employing a delivery specialist,
or a second delivery) which of these is most effective?
The 2013 Canadian Consumer Retail Experience Study
sheds light on this critical process and provides the
industry’s first look at a leading practice in this area.
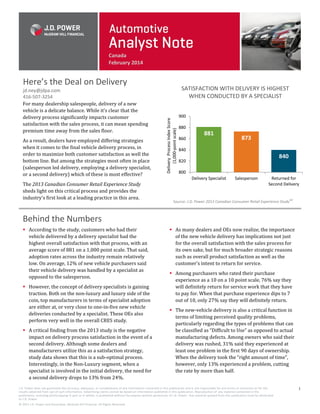
SATISFACTION WITH DELIVERY IS HIGHEST
WHEN CONDUCTED BY A SPECIALIST
Delivery Process Index Score
(1,000-point scale)
jd.ney@jdpa.com
416-507-3254
For many dealership salespeople, delivery of a new
vehicle is a delicate balance. While it’s clear that the
delivery process significantly impacts customer
satisfaction with the sales process, it can mean spending
premium time away from the sales floor.
900
880
860
881
873
840
840
820
800
Delivery Specialist
Salesperson
Returned for
Second Delivery
Source: J.D. Power 2013 Canadian Consumer Retail Experience StudySM
Behind the Numbers
According to the study, customers who had their
vehicle delivered by a delivery specialist had the
highest overall satisfaction with that process, with an
average score of 881 on a 1,000 point scale. That said,
adoption rates across the industry remain relatively
low. On average, 12% of new vehicle purchasers said
their vehicle delivery was handled by a specialist as
opposed to the salesperson.
However, the concept of delivery specialists is gaining
traction. Both on the non-luxury and luxury side of the
coin, top manufacturers in terms of specialist adoption
are either at, or very close to one-in-five new vehicle
deliveries conducted by a specialist. These OEs also
perform very well in the overall CRES study.
A critical finding from the 2013 study is the negative
impact on delivery process satisfaction in the event of a
second delivery. Although some dealers and
manufacturers utilize this as a satisfaction strategy,
study data shows that this is a sub-optimal process.
Interestingly, in the Non-Luxury segment, when a
specialist is involved in the initial delivery, the need for
a second delivery drops to 13% from 24%.
As many dealers and OEs now realize, the importance
of the new vehicle delivery has implications not just
for the overall satisfaction with the sales process for
its own sake, but for much broader strategic reasons
such as overall product satisfaction as well as the
customer’s intent to return for service.
Among purchasers who rated their purchase
experience as a 10 on a 10 point scale, 76% say they
will definitely return for service work that they have
to pay for. When that purchase experience dips to 7
out of 10, only 27% say they will definitely return.
The new-vehicle delivery is also a critical function in
terms of limiting perceived quality problems,
particularly regarding the types of problems that can
be classified as “Difficult to Use” as opposed to actual
manufacturing defects. Among owners who said their
delivery was rushed, 31% said they experienced at
least one problem in the first 90 days of ownership.
When the delivery took the “right amount of time”,
however, only 13% experienced a problem, cutting
the rate by more than half.
J.D. Power does not guarantee the accuracy, adequacy, or completeness of any information contained in this publication and is not responsible for any errors or omissions or for the
results obtained from use of such information. Advertising claims cannot be based on information published in this publication. Reproduction of any material contained in this
publication, including photocopying in part or in whole, is prohibited without the express written permission of J.D. Power . Any material quoted from this publication must be attributed
to J.D. Power.
© 2013 J.D. Power and Associates, McGraw Hill Financial. All Rights Reserved.
1
- 2. Brian Murphy
416-507-3253 ▪ brian.murphy1@jdpa.com
February, 2014
DAYS TO TURN
VEHICLE PURCHASE TYPE
Percent of Total Transactions (Past 12 Months)
New Vehicles
New
Used Vehicles
Used
70
66
3
62
20
19
61
58
49
48
54
Jan-14
Dec-13
Nov-13
Oct-13
Sep-13
Jul-13
Jun-13
Apr-13
Aug-13
Loan
May-13
Lease
Mar-13
Cash
Feb-13
Jan-13
50
MONTHLY PAYMENTS
VEHICLE PRICE VS. CUSTOMER FACING PRICE
Average per Customer
Data from JDPA PIN Incentive Spending Report (ISR)
New Lease
New Loan
Vehicle Price
Transaction Price
Jan-14
Dec-13
Nov-13
Oct-13
Sep-13
Aug-13
Jul-13
Jun-13
May-13
Apr-13
Mar-13
Feb-13
Jan-13
Jan-14
Dec-13
Nov-13
Oct-13
Sep-13
Aug-13
Jul-13
Jun-13
May-13
Apr-13
Feb-13
Mar-13
$34,000
$33,000
$32,000
$31,000
$30,000
$29,000
$28,000
$27,000
Jan-13
$590
$570
$550
$530
$510
$490
$470
PERCENT NEW-VEHICLE LOAN TERM
PERCENT NEGATIVE EQUITY & TRADE-IN
72 Months and Greater
Percentage of negative equity vehicles at trade-in
% Negative Equity
70%
57%
60%
Trade-In %
50%
50%
40%
40%
30%
30%
20%
10%
J.D. Power and Associates does not guarantee the accuracy, adequacy, or completeness of any information contained in this publication and is not responsible for any
errors or omissions or for the results obtained from use of such information. Advertising claims cannot be based on informati on published in this publication. Reproduction
of any material contained in this publication, including photocopying in part or in whole, is prohibited without the express written permission of J .D. Power and Associates.
Any material quoted from this publication must be attributed to J.D. Power and Associates.
©2014 J.D. Power and Associates, The McGraw-Hill Companies, Inc. All Rights Reserved.
Jan-14
Dec-13
Nov-13
Oct-13
Sep-13
Aug-13
Jul-13
Jun-13
May-13
Apr-13
Mar-13
Feb-13
2014
2013
2012
2011
2010
2009
Jan-13
20%
0%
2