All Roads lead to Sanna article
•
1 like•445 views

This is a network analysis addressing yemenia network, considering SANAA as the main hub of the airline, it use U curve, and developing optimum operating curve for yemenia - yemen airways

Recommended
More Related Content
More from Mohammed Hadi
More from Mohammed Hadi (20)
Recently uploaded
Recently uploaded (20)
All Roads lead to Sanna article
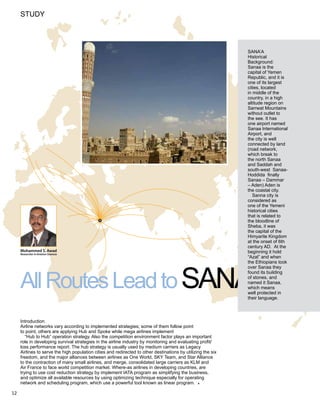
- 1. Study SANA’A Historical Background: Sanaa is the capital of Yemen Republic, and it is one of its largest cities, located in middle of the country, in a high altitude region on Sarrwat Mountains without outlet to the see. It has one airport named Sanaa International Airport, and the city is well connected by land (road network, which break to the north Sanaa and Saddah and south-west Sanaa- Hoddida finally Sanaa – Dammar – Aden) Aden is the coastal city. Sanna city is considered as one of the Yemeni historical cities that is related to the bloodline of Sheba, it was the capital of the Himyarite Kingdom at the onset of 6th century AD. At the Mohammed S. Awad beginning it hold Researcher in Aviation Sciences “Azal” and when All Routes Lead to SANA’A the Ethiopians took over Sanaa they found its building of stones, and named it Sanaa, which means well protected in their language. Introduction Airline networks vary according to implemented strategies; some of them follow point to point, others are applying Hub and Spoke while mega airlines implement “Hub to Hub” operation strategy. Also the competition environment factor plays an important role in developing survival strategies in the airline industry by monitoring and evaluating profit/ loss performance report. The hub strategy is usually used by medium carriers as Legacy Airlines to serve the high population cities and redirected to other destinations by utilizing the six freedom, and the major alliances between airlines as One World, SKY Team, and Star Alliance to the contraction of many small airlines, and merge, consolidated large carriers as KLM and Air France to face world competition market. Where-as airlines in developing countries, are trying to use cost reduction strategy by implement IATA program as simplifying the business, and optimize all available resources by using optimizing technique especially for operating network and scheduling program, which use a powerful tool known as linear program. 8 12
- 2. Study Fig. No. (2): Optimum Fig. No. ( 3 ): U Curve Fig. No. (4): Fleet Evaluation SANAA – Main Yemeina Hub Case Study by positioning two factors: seat Yemenia is counted on Hub Middle East Region: configuration and cost per ATK. and Spoke strategy and is also By studying the Yemenia 6- The one (aircraft) which is on 6th freedom policy, the 6th segment of Middle East close to the curve represents freedom policy is a gathering Region, i.e number of the right selection. In our case policy in Sanaa airport to passengers, applicable fare, A310-300 is the best one redirect them to others and distance covered; using compared with the other two. destinations. While the targeted 2007 data base, and the A330-200 indicates less cost market of Yemenia segment previous business model as it is long range operation is defined by Yemen Region, figure (1). Also equation (1) aircraft, with extra capacity, Saudia, African, Europe, Middle reflects Point To Point operating while B737-800 is having East and far east regions and Fig. No. (1): The Model model. We can develop the high cost with less in capacity that might be represented by: optimum operating curve, then as indicated in Fig (4). 1- SAH/DXB/SAH selecting the right aircraft, 2- SAH/BAH/SAH 1- U curve Technique: which will help in preparing Summary 3- SAH/AUH/SAH given passengers, fares, the scheduling of the network, The study shows the 4- SAH/CAI/SAH and distance, we can which will be as follows: importance of linear 5- SAH/DAM/SAH know the right capacity 1- All the routes and seat programming in practice 6- SAH/ADD/SAH and optimum frequency available are analyzed by especially for scheduling and 7- SAH/JIB/SAH to operate by constructing two costs – 1st : Cost of network problems, also it 8- SAH/JED/SAH a spread sheet model. available seat 2nd: Cost introduces the concept of U 9- SAH/BEY/SAH 2- Integer Program: of losing Opportunity. curve technique, which defines This is the main part of the 2- The outcome cost of the the right capacity consequently Business Model analysis, which builds up the two previous costs (Total deriving the optimum solution Most of the airlines are model that contains target Cost), which takes the shape curve which is considered as using a business model as (objective) and constrains of U and the minimum level the thumb for the airline for Point To Point, we can study the objective which is here of this cost reflects the best this market segment, this is Middle East segment of minimizing the Cost. decision of seat capacity applicable to the airline used Yemenia by implementing the 3- Optimum Solution Curve: to operate by using linear point to point operating model. relationship in equation (1): By introducing the cost in the programming as it is indicated We apply this approach for which explore the following? program as step function we in table (1) and figure (3). Middle East region of Yemenia can develop optimum solution 3- The difficulty of this analysis by developing optimum curve for the airline by studying denoted by the unknown figures solution for this region, the distance between city SAH of the cost requires to work indicating the best way to and the other destinations stepwise for the cost estimation select an aircraft for the market that Yemenia operated. (i.e step function): we can by showing the preference of Here we can compare and draw the optimum operating A310-300 over A330-200 and select the right aircraft to this curve, accordingly figure (4). B737-800 as shown in Fig.(4). market segment. Provided 4- The operating curve Despite the high capacity that we know the aircraft represents the best optimum of A330-200, the cost is less Equation No. (1): The capab ility range, so that the solution for that segment than A310-300; this gives more Right Capacity & Optimum comparison will be addressing and it covers all the opportunity to expand Yemenia Frequency is a function of the same families of aircraft. As expenses and revenue. network and serve markets in number of passengers, market compared in figure (2) between 5- It will be easy to select the the future especially for Multi fare, distance traveled, and A320 Family and B737 NG. aircraft which fits the market, Stops Operating Model. n applicable cost. Any airline can be defined by the market size, applicable fares, and distances between the sectors. While the cost is introduced as step function to develop optimum solution curve of the airline, this curve acts as a thumb that differ airline from others. The business model runs in a three phases: Table No. (1): Analysis of 13
- 3. Civil Aviation & Meteorology Authority, April - June 2010, issue 7 Hamed Faraj Elected as The Vice President of ACAC Executive Council Air travel disruption after the 2010 Eyjafjallajökull eruption Iceland Ash www.camamagazine.com