Fetal orbital diameter (mm)- gestational age
•
4 likes•802 views

Fetal orbital diameter (mm)- gestational age Microphthalmia

Recommended
More Related Content
What's hot
What's hot (20)
Viewers also liked
Viewers also liked (14)
Similar to Fetal orbital diameter (mm)- gestational age
Similar to Fetal orbital diameter (mm)- gestational age (20)
More from Asha Reddy
More from Asha Reddy (20)
Recently uploaded
Recently uploaded (20)
Fetal orbital diameter (mm)- gestational age
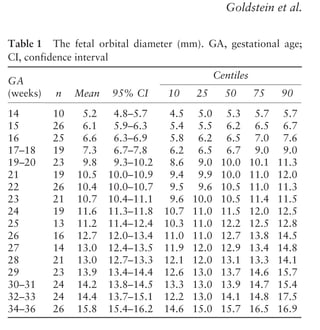
- 1. GA (weeks) Centiles n Mean 95% CI 10 25 50 75 90 14 15 16 17–18 19–20 21 22 23 24 25 26 27 28 29 30–31 32–33 34–36 10 26 25 19 23 19 26 21 19 13 16 14 21 23 24 24 26 5.2 6.1 6.6 7.3 9.8 10.5 10.4 10.7 11.6 11.2 12.7 13.0 13.0 13.9 14.2 14.4 15.8 4.8–5.7 5.9–6.3 6.3–6.9 6.7–7.8 9.3–10.2 10.0–10.9 10.0–10.7 10.4–11.1 11.3–11.8 11.4–12.4 12.0–13.4 12.4–13.5 12.7–13.3 13.4–14.4 13.8–14.5 13.7–15.1 15.4–16.2 4.5 5.4 5.8 6.2 8.6 9.4 9.5 9.6 10.7 10.3 11.0 11.9 12.1 12.6 13.3 12.2 14.6 5.0 5.5 6.2 6.5 9.0 9.9 9.6 10.0 11.0 11.0 11.0 12.0 12.0 13.0 13.0 13.0 15.0 5.3 6.2 6.5 6.7 10.0 10.0 10.5 10.5 11.5 12.2 12.7 12.9 13.1 13.7 13.9 14.1 15.7 5.7 6.5 7.0 9.0 10.1 11.0 11.0 11.4 12.0 12.5 13.8 13.4 13.3 14.6 14.7 14.8 16.5 5.7 6.7 7.6 9.0 11.3 12.0 11.3 11.5 12.5 12.8 14.5 14.8 14.1 15.7 15.4 17.5 16.9 Table 1 The fetal orbital diameter (mm). GA, gestational age; CI, confidence interval GA (weeks) Centiles n Mean 95% CI 10 25 50 75 90 14 15 16 17–18 19–20 21 22 23 24 25 26 27 28 29 30–31 32–33 34–36 10 26 25 19 23 19 26 21 19 13 16 14 21 23 24 24 26 16.4 19.1 20.7 22.9 30.6 32.9 32.6 33.7 36.3 37.5 40.0 40.7 40.8 43.7 44.58 45.3 49.7 15.1–17.8 18.4–19.8 19.9–21.6 21.2–24.6 29.3–31.9 31.5–34.3 31.5–33.6 32.6–34.8 35.4–37.2 35.8–39.1 37.8–42.1 39.0–42.4 39.9–41.7 42.2–45.1 43.5–45.6 43.0–47.5 48.5–50.8 14.1 17.0 18.1 19.3 26.9 29.4 29.7 30.2 33.5 32.4 34.7 37.4 38.0 39.6 41.9 38.3 46.0 15 17 19 20 28 31 30 31 35 36 36 38 39 40 42 41 47 16.5 19.5 20.4 20.9 31.4 31.4 33.0 33.0 36.1 38.3 39.8 40.5 41.0 42.9 43.8 44.4 49.4 17.9 20.4 21.9 28.3 31.7 34.6 34.5 35.8 37.7 39.3 43.4 42.0 41.6 45.9 46.0 46.4 51.7 17.9 21.0 23.8 28.3 35.5 37.7 35.4 36.1 39.3 40.3 45.5 46.4 44.4 49.4 48.2 54.9 52.9 Table 2 The fetal orbital circumference (mm). GA, gestational age; CI, confidence interval 0.6 0.5 0.4 0.3 0.2 10 20 30 40 (a) Lensdiameter/ orbitaldiameter r = 0.55 p < 0.00001 y = 0.53 −0.05 × GA 0.3 0.4 0.5 0.6 10 20 30 40 (b) Lenscircumference/ orbitalcircumference r = 0.57 p < 0.00001 y = 0.54 −0.05 × GA 0.3 0.4 0.2 0.1 0.0 10 20 30 40 (c) Lensarea/orbitalarea r = 0.57 p < 0.00001 y = 0.3 −0.04 × GA Gestational age (weeks) Figure 5 Relationships between the fetal lens/orbital diameter ratio (a), lens/orbital circumference ratio (b) and lens/orbital area ratio (c) and gestational age (GA) GA (weeks) Centiles n Mean 95% CI 10 25 50 75 90 14 15 16 17–18 19–20 21 22 23 24 25 26 27 28 29 30–31 32–33 34–36 10 26 25 19 23 19 26 21 19 13 16 14 21 23 24 24 26 21.6 29.2 34.4 42.7 75.3 86.5 84.9 90.5 105.2 112.2 128.2 132.4 132.6 152.5 158.3 165.1 196.6 18.0–25.2 27.1–31.3 31.6–37.3 36.2–49.3 68.7–81.8 79.0–94.1 79.4–90.4 84.6–96.5 100.2–110.3 102.8–121.5 114.4–142.0 120.8–144.0 127.0–138.3 142.0–162.9 150.5–166.2 148.2–182.1 187.9–205.3 15.9 23.0 26.2 29.7 57.4 68.7 70.2 72.4 89.1 84.2 95.8 111.0 114.0 124.0 139.0 117.0 167.0 19.3 23.8 30.2 33.2 63.6 76.2 72.8 79.8 100.0 103.0 106.0 116.0 124.0 131.0 143.0 137.0 181.0 21.7 30.2 32.9 34.7 78.6 78.6 86.6 86.6 103.0 116.0 126.0 130.0 133.0 146.0 152.0 156.0 194.0 25.5 32.9 38.2 63.6 80.2 95.1 94.4 102.1 113.1 122.8 149.7 140.4 137.9 167.5 168.8 170.9 212.6 25.5 35.1 44.9 63.6 100.5 113.1 99.5 103.9 122.8 129.2 165.2 170.9 157.0 194.3 185.1 240.0 222.9 Table 3 The fetal orbital area (mm2 ). GA, gestational age; CI, confidence interval A96/186 Fetal orbits and lens in normal pregnancies Goldstein et al. AMA: First Proof 178 Ultrasound in Obstetrics and Gynecology