Visualizing the genome: Techniques for presenting genome data and annotations
•
2 likes•311 views

This document discusses techniques for visualizing genome data and annotations in genome browsers. It describes three key techniques: 1. Semantic zooming allows biologists to inspect both large genomic structures like introns and exons as well as closer details of sequences. 2. Sorting annotations into adjustable and movable tiers helps organize dense information and make patterns more visible. 3. Displaying protein motifs alongside gene structures allows biologists to quickly assess how alternative splicing impacts protein function.
Recommended

Recommended
More Related Content
Viewers also liked
Viewers also liked (19)
Similar to Visualizing the genome: Techniques for presenting genome data and annotations
Similar to Visualizing the genome: Techniques for presenting genome data and annotations (20)
More from Ann Loraine
More from Ann Loraine (14)
Recently uploaded
Recently uploaded (20)
Visualizing the genome: Techniques for presenting genome data and annotations
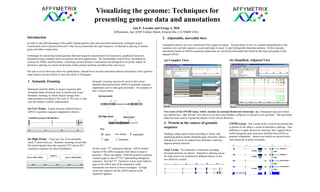
- 1. Ann E. Loraine and Gregg A. Helt Affymetrix, Inc. 6550 Vallejo Street, Emeryville, CA 94608 USA Introduction In order to take full advantage of the public human genome data and associated annotations, biologists require visualization tools ("genome browsers") that can accommodate the high frequency of alternative splicing in human genes and other complexities. Techniques for presenting human genome data and sequence annotations in an interactive, graphical format are illustrated using examples from two genome browser applications: The Neomorphic GeneViewer, developed on contract for TIGR, and ProtAnnot, a prototype protein domain visualization tool designed to reveal the impact of alternative splicing on conserved domains within protein isoforms encoded at the same locus. Our aim is not to showcase these two applications, instead but to provide interested software developers with a guide to what features are most likely to meet the needs of biologists. Two views of the SNURF locus, which encodes an unusual bicistronic transcript. (a) Annotation types are sorted into labeled tiers. (b) Several tiers shown in (a) have been hidden, collapsed, or moved to new positions. The horizontal slider has been used to expand the display in the vertical direction. Visualizing the genome: Techniques for presenting genome data and annotations 1. Semantic Zooming Biologists need the ability to inspect sequence data alongside larger structures such as introns and exons. Semantic zooming, in which objects change their representation according to the scale of the view, is one way this feature could be implemented. (a) Low Zoom. A gene structure inferred from a cDNA-to-genomic sequence alignment is shown. (b) High Zoom. Close-up view of an unusually small 3' intron from (a). Semantic zooming reveals that this intron departs from the expected "GT-intron-AG" consensus sequence for intron boundaries. Semantic zooming can also be used to show more detailed information about cDNA-to-genomic sequence alignments used to infer gene structures. An example of this is shown below. (a) Complex View (b) Simplified, Adjusted View CD79b Locus. One variant lacks a conserved domain that is present in the others, a result of alternative splicing. This difference is made obvious by showing "hits" against these motifs alongside gene structures inferred from cDNA-to- genomic alignments. Amino acid motifs are shown below each transcript as green rectangles. 2. Adjustable, moveable tiers Annotation density can vary enormously from region to region. Sorting items in rows or columns perpendicular to the sequence axis can help organize a scene and make it easier to spot biologically important patterns. In this example, annotations based on cDNA-to-genome alignments are sorted into horizontal tiers based on the type and quality of the aligned cDNAs. 3. Protein in the context of genomic sequence Shading coding region exons according to frame, and displaying protein motifs alongside gene structures, allows biologists to assess at a glance how alternative splicing impacts protein function. Arg1 Locus. Two alternative transcripts encoding divergent proteins are shown. Alternative splicing causes the final exon to be translated in different frames in the two different variants. At low zoom, "V" characters indicate "cDNA inserts," regions of the cDNA sequence that failed to align to genomic. These can appear when the genomic sequence contains gaps or runs of "N's" representing ambiguous sequence. Inverted "V" characters at low zoom indicate gaps in the cDNA part of the alignment, while mismatches are shown as black rectangles. At high zoom, the sequence for the cDNA partner in the alignment appears.