
Recommended
More Related Content
What's hot
What's hot (20)
Similar to Hispanic heritage month 1-population
Similar to Hispanic heritage month 1-population (20)
More from ARCResearch
More from ARCResearch (20)
Recently uploaded
Recently uploaded (20)
Hispanic heritage month 1-population
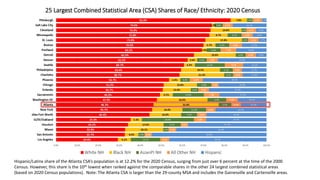
- 1. 25 Largest Combined Statistical Area (CSA) Shares of Race/ Ethnicity: 2020 Census Hispanic/Latinx share of the Atlanta CSA’s population is at 12.2% for the 2020 Census, surging from just over 6 percent at the time of the 2000 Census. However, this share is the 10th lowest when ranked against the comparable shares in the other 24 largest combined statistical areas (based on 2020 Census populations). Note: The Atlanta CSA is larger than the 29-county MSA and includes the Gainesville and Cartersville areas.
- 2. Change in Population by Race/ Ethnicity 25 Largest CSAs: 2020 Census Hispanic/Latinx population increased in each of the 25 largest CSAs 2010-2020, while White Non-Hispanic population declined in eight of the CSAs. Hispanic increase led race/ ethnicity categories in net increase in 14 of the 25 CSAs. In Atlanta, the Black population grew substantially faster, and Asian and multiracial growth approached absolute increase for Hispanic/Latinx.
- 3. 2020 Census Race/Ethnicity Totals: State of Georgia and Subareas Hispanic/Latinx concentration as of the 2020 Census is significantly higher in the Atlanta MSA (at 12% of total population) than in the rest of the state of Georgia (at 8.2%). Hispanic/Latinx share of the five core counties was highest among the “larger than county” aggregations, at 14%. At the county level, nearly 1 in 4 Gwinnett residents reported as Hispanic/Latinx. The City of Atlanta (at 6%) and Henry County (at 7.7%) have the lowest Hispanic shares among ARC jurisdictions.
- 4. 2020 Public School Enrollment by District: 13-County Atlanta Area So we just saw that Hispanic/Latinx population represents healthy shares of total populations of counties in the Atlanta area. And yet the shares are significantly higher—in each area—when the public school enrollment is assessed. Hispanic/Latinx children are more than 1 in 5 of all October 2020 enrollees in Marietta and Buford City, as well as in Gwinnett, Clayton, Cobb, and Cherokee County public schools. Only Decatur and Atlanta City schools have less than 10% Hispanic/Latinx students.
- 5. Change in Population by Race/Ethnicity Totals: 2010-20: State of Georgia and Subareas Hispanic/Latinx populations accounted for more than 1 in 5 of net new persons in the 11-county region between 2010 and 2020. In Gwinnett County, nearly 4 of 10 net new residents in 2010-2020 was Hispanic/Latino, and over 1 in 3 were such in Cobb County. In the state outside the Atlanta MSA, with many counties declining in size overall in 2010-20, Hispanic population was the group that provided the second largest source of population increase. Only in Fulton County as a whole, driven by low inflow of Hispanics to the City of Atlanta, were fewer than 1 in 10 of net new residents Hispanic. While only the City of Atlanta and Cherokee added white, non-Hispanic populations, every jurisdiction added Hispanic/ Latinx.
- 6. Percentage Increase, 2010-2020 by Race/ Ethnicity: 11-County Area As noted on the prior slide, Hispanic/ Latinx populations grew in every 11-county jurisdiction from 2010-2020, surging by more than 50 percent in Cherokee, Forsyth, and Henry Counties. These areas were (in 2010) some of the area with the lowest shares of Hispanic population overall and remain so—even with the rapid increases of the last decade—in 2020. In Cherokee County, Hispanic populations grew faster than any other race/ethnic group. In most others, percentage increases trailed those of Asian, non-Hispanic and Non-Hispanic Other (including multiracial).
- 7. Percentage Point Increases in Race/ Etnhnicity Shares, 2010-2020: Comparative Areas Hispanic populations (light blue shading) increased their share of population in every area analyzed above, and by the most in Gwinnett County (3 percent) . But in all areas, other race/ethnic groups gained more population share than did Hispanic/ Latinx—an indication that while growth is very strong, it is beginning to slow in a relative sense over the past decade.