SlideShare a Scribd company logo
1 of 43
Download to read offline
WHITESTONE REIT
INVESTOR PRESENTATION
NYSE: WSR
December 2017
CREATING COMMUNITIES IN OUR PROPERTIESTM
The Shops at Starwood, Frisco, TX
The Living Room, Market Street at DC Ranch, Scottsdale, AZ
1
Market Street at DC Ranch, Scottsdale, AZ
BLVD Place, Houston, TX
Forward Looking Statements
2
This presentation contains forward-looking statements within the meaning of Section 27A of the Securities Act of 1933, as amended, and Section 21E of the Securities
Exchange Act of 1934, as amended. Forward-looking statements provide our current expectations or forecasts of future events and are not statements of historical fact. These
forward-looking statements include information about possible or assumed future events, including, among other things, discussion and analysis of the financial condition,
pending acquisitions and the impact of such acquisitions on Whitestone REIT, or the Company, including expected financing developments, capitalization rates and internal
rates of return, the financial condition and results of operations of the Company, anticipated capital expenditures required to complete projects, amounts of anticipated cash
distributions to the Company’s shareholders in the future and other matters. These forward-looking statements are not historical facts but are the intent, belief or current
expectations of the Company’s management based on its knowledge and understanding of the Company’s business and industry. Forward-looking statements are typically
identified by the use of terms such as “may,” “will,” “should,” “potential,” “predicts,” “anticipates,” “expects,” “intends,” “plans,” “believes,” “seeks,” “estimates” or the negative of
such terms and variations of these words and similar expressions, although not all forward-looking statements include these words. These statements are not guarantees of
future performance and are subject to risks, uncertainties and other factors, some of which are beyond the Company’s control, are difficult to predict and could cause actual
results to differ materially from those expressed or forecasted in the forward-looking statements.
Forward-looking statements that were true at the time made may ultimately prove to be incorrect or false. You are cautioned not to place undue reliance on forward-looking
statements. The Company undertakes no obligation to update or revise forward-looking statements to reflect changed assumptions, the occurrence of unanticipated events or
changes to future operating results. Factors that could cause actual results to differ materially from any forward-looking statements made in this presentation include the
Company’s ability to successfully finance and complete its pending acquisitions and related developments and, if completed, the ability of such newly acquired properties to
perform as expected, including with respect to rates of return; the imposition of federal taxes if the Company fails to qualify as a REIT in any taxable year or foregoes an
opportunity to ensure REIT status; uncertainties related to the national economy, the real estate industry in general and in the Company’s specific markets; legislative or
regulatory changes, including changes to laws governing REITs; adverse economic or real estate developments in Texas, Arizona or Illinois; increases in interest rates and
operating costs; availability and terms of capital and financing, both to fund the Company’s operations and to refinance its indebtedness as it matures; decreases in rental rates
or increases in vacancy rates; litigation risks; lease-up risks, including leasing risks arising from exclusivity and consent provisions in leases with significant tenants; the
Company’s inability to renew tenant leases or obtain new tenants upon the expiration of existing leases; the Company’s inability to generate sufficient cash flows due to market
conditions, competition, uninsured losses, changes in tax or other applicable laws; and the need to fund tenant improvements or other capital expenditures out of operating
cash flow. The forward-looking statements should be read in light of these factors and the factors identified in the “Risk Factors” included in the Company’s most recent Annual
Report on Form 10-K, Quarterly Reports on Form 10-Q and other reports and information that it files with the Securities and Exchange Commission, or the SEC.
This presentation is not an offer to sell, nor a solicitation of an offer to buy securities, nor shall there be any sale of securities in any state or jurisdiction in which the offer,
solicitation or sale would be unlawful prior to registration or qualification under the securities laws of such state or jurisdiction.
The Company obtained the industry, market and competitive position data used in this presentation from (i) its own internal estimates and research of third-party company
websites and other sources, (ii) industry and general publications and research or (iii) studies and surveys conducted by third parties. Such sources generally do not guarantee
the accuracy or completeness of included information. While the Company believes that the information included in this presentation from such publications, research, studies,
surveys and websites is reliable, it has not independently verified data from these third-party sources. While the Company believes its internal estimates and research are
reliable, neither such estimates and research nor such definitions have been verified by any independent source.
This presentation contains supplemental financial measures that are not calculated pursuant to U.S. generally accepted accounting principles, or GAAP, including EBITDA,
FFO, FFO Core, and NOI. These non-GAAP measures are in addition to, not a substitute for or superior to, measures of financial performance prepared in accordance with
GAAP. A reconciliation of non-GAAP measures to GAAP measures is contained in the Appendix to this presentation.
➢ Growth and Value Investment Opportunity
➢ Retail REIT with High Quality Properties in Affluent and High
Growth Markets
➢ E-Commerce Resistant Tenant Mix; Providing Services and
Necessities to the Community
➢ Strong Operations with Increasing Occupancies and Rents
➢ Solid Capital Structure Positioned For Growth
➢ Proven and Experience Management Team/Board of Trustees and
institutional-quality platform
72 properties (2)
6.6 million GLA (2)
1,649 tenants (2)
90% occupancy (3)
$18.84 ABR per sq. ft. (3)(4)
+4.7% SS NOI Growth (3)(5)
$586 million
(Equity Market Cap) (6)
$1.2 billion
(Enterprise Value) (6)
NYSE: WSR
IPO - August 2010
(1) As of Sept 30, 2017 except where indicated.
(2) Includes properties owned through Pillarstone Capital REIT Operating Partnership LP as of Sept 30, 2017.
(3) Excludes properties owned through Pillarstone Capital REIT Operating Partnership LP as of Sept 30, 2017.
(4) Annualized base rent (“ABR”) represents monthly base rent as of Sept 30, 2017 multiplied by 12.
(5) Represents same store (“SS”) net operating income (“NOI”) growth for Q3-17 vs. Q3-16.
(6) Calculated using closing price of WSR common shares on November 24, 2017 of $14.79 per share.
Whitestone REIT: Unique Story and Opportunity
3
Fast Facts
Existing Portfolio (1)
Financial Highlights
4
25% growth in Revenue
27% growth in NOI (1)
25% growth in FFO (2)
33% growth in FFO Core (2)
9% growth in FFO Core per Share(2)
(1) The Company defines NOI as operating revenues (rental and other revenues) less property and related expenses (property operation and maintenance and real estate taxes). NOI is a non-GAAP
measure. A reconciliation of non-GAAP measures to GAAP measures is contained in the Appendix to this presentation.
(2) The Company defines FFO as defined by NAREIT, which states that FFO should represent net income available to common shareholders (computed in accordance with GAAP) excluding gains or
losses from sales of operating assets, impairment charges and extraordinary items, plus depreciation and amortization of operating properties, including the Company's share of unconsolidated real
estate joint ventures and partnerships. The Company defines FFO Core as FFO excluding certain non-cash and non-comparable items that affect the Company's period-over-period performance,
including, but not limited to, legal settlements, non-cash share-based compensation expense, rent support agreement payments received from sellers on acquired assets and acquisition costs. FFO
and FFO Core are non-GAAP measures. A reconciliation of non-GAAP measures to GAAP measures is contained in the Appendix to this presentation.
(3) Source: SNL, as of November 24, 2017
(4) Timeframe Jan 1, 2011 through Dec 31, 2016
CAGR - Five Years Ended December 31, 2016(4)
1 Year: 18% #1 of 17
3 Year: 28% #2 of 16
5 Year: 63% #4 of 15
Rank Amount Public REIT
Shopping Centers (3)
Total Shareholder Return(3)
Proven Track Record of Growth
5
Revenue
Gross Assets
Note: Dollars in millions, CAGR Timeframe Jan 1, 2011 through Dec 31,2016.
$34.9
$46.6
$62.1
$72.4
$93.4
$104.4
$134.6
2011 2012 2013 2014 2015 2016 Q3-17
(A)
Proven Track Record of Growth
6
FFO Core / Share
NOI
Note: Dollars in millions, CAGR Timeframe Jan 1, 2011 through Dec 31, 2016
$21.6
$28.2
$37.8
$47.2
$62.1
$70.3
$89.5
2011 2012 2013 2014 2015 2016 Q3-17
(A)
Proven Ability to MANAGE & SUSTAIN Growth
7
Note: Dollars in millions. 2017 Annualized-3Q17 times 4
2010 IPO YEAR-END 2013 2017(ANNUALIZED)
Annual FFO Core (millions) $7.9 $20.8 $52.4
Annual NOI (millions) $19.3 $37.8 $89.5
Dividends Paid to Shareholders
(millions)
$7.4 $21.0 $43.8
# of Properties 37 60 72
# of Tenants 770 1,243 1,649
# of Employees 50 68 106
Gross Leasable Area 3,014,264 4,966,330 6,547,658
Gross Real Estate Assets $205.0 $546.3 $1,144.5
Identified Disruption in the Retail Landscape
8
BOOMERS
• Time Constrained Consumers = Demand Greater Convenience
• Spending Growth on Services
• Downsizing Living Space Flows through to Downsizing in Retail
MILLENNIALS
• Lifestyle Revolves Around Mobility and Flexibility
• Comfortable with the Sharing/Smaller Space Economy
• Need for Connection is Stronger
• Changing the Demand for Purchasing Soft and Hard Goods
DUAL INCOME HOUSEHOLDS
• More Profound Impact on Household Spending
• Entertaining More Outside the Smaller Home
• Experiential Dynamic of Consumption has Increased
AMAZON
• Dominates the Purchase and Delivery of Hard and Soft Goods
• Expanding their Delivery of Need-Based Items with the Purchase of Whole Foods
The 19 properties include: Heritage Trace Plaza, The Strand at Huebner Oaks, The Promenade at Fulton Ranch, Fulton Ranch Towne Center, Fulton Ranch TC Hard Corner, Williams
Trace Plaza, The Shops at Williams Trace, Dana Park Pad, City View Village, Davenport Village, Parkside Village South, Parkside Village North, Gilbert Hard Corner, Quinlan Crossing,
Keller Place, La Mirada, Scottsdale Seville, BLVD Place and Eldorado Plaza
9
Selectively Acquired Targeted Properties
19
Closed
Unlevered Project Internal Rate of Return of 15%
1,626
Transactions
Pass Initial Triage
• Business-friendly
states
• Local
• Community-centered
• Service-focused
271
Underwritten
• Dense populated
Sunbelt
• Generally 50k – 200k
RSF, sometimes
larger
43
Offers Made
• Attractive price
• Value-add
opportunities
(excess land /new
pads)
• Potential for service-
based tenant mix
• Potential for lease
normalization
• Target unlevered IRR
above cost of capital
• Acquired 19
properties from
20141 to 2017
• Total Purchase
Price $560M
• Total GLA of 1.8m
square feet
Acquisition Activity Robust and Well Timed with Capital
10
• Whitestone continues to make acquisitions in its core markets
• Expanding footprint yielding cost synergies at the corporate level
• Market share gains driving pricing power at the leasing level
0 2 4 6 8
Population in millions
Focused on High Growth Markets
27 Properties
44 Properties
6.6%
9.7%
8.6%
8.0%
9.7%Austin
Phoenix
San Antonio
Houston
Dallas-Fort Worth
11
Note: Portfolio includes 1 property in Chicago;
(1) Source: The Atlantic CityLab 2013 to 2014.
(2) Source: Claritas, as of April 2017.
(3) As a percentage of portfolio NOI for quarter ended Sept 30, 2017. Amounts proforma for full quarter NOI
from Q3-17 Acquisitions. Excludes properties owned through Pillarstone Capital REIT Operating Partnership LP.
2017E MSA Population (mm) (2)
% Growth ’17E - ’22E
Net Total Migration (1)
Phoenix
2016 and 2017
Acquisitions
Existing Properties
San
Antonio
Austin
Geographic Exposure (3)
+100,000
-100,000
+50,000
-50,000
+10,000
-10,000
Business-Friendly. Attractive Demographics.
12
AUSTIN
#1 Next Biggest
Boom Town
#1 Fastest Growing City in the U.S.
for the 4th Consecutive Year
DALLAS
#1 Top Emerging Real Estate Market in
2016
#1 Most Business Friendly City
in America
#1 Great Cities for Starting a Business
PHOENIX
#3 Largest Labor Pool in the West
#5 Fastest Growing Tech Market
SAN ANTONIO
Top 10 Fastest
Growing City
113,000 jobs created in
the last 5 years, with +25,000
in 2016
HOUSTON
#1 in the world in GDP
per capita
+1,500 significant corporate
relocations or expansions since 2009
#1 in job creation among MSAs over
the past 15 years
Meeting the Needs of Affluent Communities
While Reducing Risks
13Note: Definitions sourced from ULI
Services &
Entertainment…
Dining
22%
Specialty
Retail
17%
Health &
Wellness
16%
Grocery
11%
Education
6%
14
Capitalized on the Disruption in the Retail Industry
Focused on Local Services & Experiences
Complemented by Brands You Know & Trust
85%
SERVICE-BASED AND
OPTIMIZED TENANT
COMPOSITION
15%
13%
12%
5%
32%
23%
Only two
tenants with
more than
2% ABR
Safeway (2.5%)
Whole Foods(2.1%)
Diverse, Ecommerce-Resistant Tenant Base (1)
(1) As of Sept 30, 2017. Excludes properties owned through Pillarstone Capital REIT Operating Partnership LP.
Strong Household Income Leads to Greater
Discretionary Spending(2)
15
(1) Source: S&P Global Market Nov 2017 .
(2) Retail portfolio only. Excludes properties owned through Pillarstone Capital REIT Operating Partnership LP.
$94,232
$81,910
$80,950
$72,950
$67,297
$63,931
$60,049
$50,000
$60,000
$70,000
$80,000
$90,000
$100,000
FRT WSR REG KIM DDR WRI BRX
MedianHouseholdIncome(3-mileradius)(1)
Peer Average: $74,474
Attractive Demographic Drivers vs. Peers
16
Source: Claritas, SNL Financial and Wall Street Research as of May 2016.
Highly Educated Workforce. High Household Income. Strong Population Growth.
Limited Exposure to Power Centers Relative to
Peers (1)
17
Source: Green Street Advisors (11-24-2017) and Company Filings.
(1) Percentages shown represent percentage of total properties. WSR total properties include properties owned through Pillarstone Capital REIT
Operating Partnership LP as of September 30, 2017.
1%
23%
44%
45% 46%
51%
86%
0%
10%
20%
30%
40%
50%
60%
70%
80%
90%
100%
WSR REG FRT WRI BRX KIM DDR
PercentofPowerCenters
Peer Average:
49%
5.1%
3.5% 3.3% 3.1% 2.8%
2.5%
2.0%
WSR REG WRI FRT KIM BRX DDR
Strong Internal Growth
18
Attractive Same-Store NOI Growth (1)
Increasing Occupancy Growing Rent Levels
Total Occupancy (2) ABR per Sq. Ft. (2)
.
(1) For WSR excludes investment in Pillarstone Capital REIT Operating Partnership LP; Source: various company filings.
(2) Occupancy and ABR per sq. ft. as of September 30, 2017. Excludes properties owned through Pillarstone Capital REIT Operating Partnership LP.
SS NOI Growth Rate – 2016 Growth Rates (1)
80.3%
90.1%
3Q10 3Q17
$10.43
$18.84
3Q10 3Q17
Peer Average 2.9%
Leasing Activity and Spreads (1) (Sq. Ft. in 000’s) Upcoming Lease Expirations (Sq. Ft. in 000’s)
Strong Leasing Activity
19
Note: Does not represent pro forma numbers for BLVD Place and Eldorado Plaza acquisitions.
(1) Annual leasing spread represent the year-over-year percentage increase in contractual rent per square foot for lease renewals and new leases executed during the
trailing twelve months for the respective period.
(2) Includes properties owned through Pillarstone Capital REIT Operating Partnership LP.
+2.1% +9.4%+2.0% +7.9% +8.2%
(1)
(1)
− Weighted Average Remaining Lease Term: 4.2 Years
− Potential to capture growth from below market leases
Executed Leases – Sq. Ft. (New and Renewal) (2) Expiring Leases – Sq. Ft. (2)
+7.6%
685
835 862
966
1,121
727
2012 2013 2014 2015 2016 9ME Q3-17
Increasing ABR Per Sq. Ft. (1)
Strong Growth with Moderate ABR vs. Peers
20
(1) ABR per Sq. Ft. for the portfolio as of Sept 30, 2017. Excludes properties owned through Pillarstone Capital REIT Operating Partnership LP.
(2) Source: various company filings.
ABR Per Sq. Ft. (2)
Peer Average: $18.44
$26.72
$20.61
$18.84 $18.58
$16.16 $15.33
$13.28
$-
$5.00
$10.00
$15.00
$20.00
$25.00
$30.00
FRT REG WSR WRI DDR KIM BRX
$11.21
$12.21
$13.04
$14.82
$15.75
$17.33
$18.84
2011 2012 2013 2014 2015 2016 Q3-17
(1) Other liabilities includes accounts payable and accrued expenses, tenants’ security deposits and dividends and distributions payable.
(2) Other assets includes marketable securities, escrows and acquisition deposits, accrued and accounts receivable, net of allowance for doubtful accounts and prepaid expenses
and other assets.
(3) Source: S&P Global, November 24, 2017.
(4) Retail portfolio only.
(5) Source: Claritas, SNL Financial and Wall Street Research as of May 2016.
(6) Source: Green Street Advisors (11/24/2017). Percentages shown represent percentage of total properties. WSR total properties include properties owned through Pillarstone
Capital REIT Operating Partnership LP as of Sept 30, 2017.
(7) Estimated 2018 Cash NOI represents Q3 ‘17 NOI of $22.4 annualized, adjusted for straight line rents, FAS 141 adjustment and partial period acquisitions and grown at 4.5%
annual same-store growth rate.
Unique Opportunity with Attractive Entry Point
Illustrative Implied Cap Rate
21
Proven Track Record of Increasing Yield on Cost
22
Acquisitions from 2010 to 2013 have improved yields by 168bps on average
Potential to improve yields on more recent acquisitions (2014 – 2017)
Number of
GLA
Sq. Ft. in Yield on Total Cost
Acquisitions (000's) Initial(1) Current(2) Change (bps)
2010/2011 10 596 7.1% 8.9% +178 bps
2012 5 675 7.2% 9.5% +237 bps
2013 6 690 7.2% 7.9% +67 bps
'10-'13 Total / W.A.(3) 21 1,961 7.2% 8.7% +154 bps
Number of
GLA
Sq. Ft. in
Yield on Total Cost
Acquisitions (000's) Initial(1)
Current(2) Change (bps)
2014 8 631 7.5% 7.5% - bps
2015 7 482 6.7% 5.9% - 76 bps
'14-'17 Total / W.A.(3) 19 1,789 6.8% 6.9% +14bps
2016/2017 4 676 6.5% 7.2% +72 bps
Source: Company management.
(1) Initial yield calculated as described in note 2 on page 7.
(2) Current yield defined as Q3 ‘17 property-level NOI annualized divided by gross book value of real estate assets, undepreciated as of September 30, 2017.
(3) Weighted average calculated based on gross invested capital (purchase price plus additional investment)
Optimizing Our Capital Structure
23
24%
19%
39%
16%
1%
33%
3%53%
11%
Equity - Retail Investors Equity - Institutional Investors Unsecured Debt Mortgage Debt Non-Controlling Interest
18%
28%
34%
$191.4M
ENTERPRISE
VALUE
• EV +6x
• More Stable
Capital Structure
• Institutional
Quality Balance
Sheet
$1.25B
ENTERPRISE
VALUE
IPO 2010
CURRENT (1)
19%
(1) As of November 24, 2017
Limited Near Term Debt Maturities (1)
24
Note: Debt maturity schedule excludes scheduled amortization payment; does not represent pro forma numbers for BLVD and Eldorado acquisitions
(1) As of Sept 30, 2017.
(2) Revolving Credit Facility includes an accordion feature that will allow the Operating Partnership to increase the borrowing capacity by an additional $200 million, upon
the satisfaction of certain conditions.
(3) Revolving Credit Facility matures in October 2019 with a one year extension option. Chart assumes extension option is exercised.
Total Debt: $656mm
Unused Revolver Capacity
(2)
$73mm
Wtd. Avg. Fixed Maturity: ~5.4 Years
Wtd. Avg. Fixed Interest Rate: 3.9%
Floating
33%
Fixed
67%
(3)
8.3x (0.6x)
(0.7x)
7.0x
Reduction of Debt/EBITDA Ratio – Pro Forma (1)
WSR will seek to organically reduce its Debt / EBITDA ratio over the next 24 months
3Q-2017 Projected Same Store
NOI Growth(2)
Projected Lease-up to 95%
Occupancy(3)
Pro Forma
(1) Adjusted for projected same store NOI growth and projected lease-up. Assumes debt remains at Sept 30, 2017 levels, except as described in note 3 below.
(2) Assumes 4.0% annual same store NOI growth for two years.
(3) Assumes incremental EBITDA of $10 million from the lease up of the total portfolio to 95% at an average rental rate, including triple net reimbursements of $20 per
square foot. Also assumes incremental debt of $9.9 million to fund tenant improvements and lease commissions for lease-up. The Company defines EBITDA as
operating revenues (rental and other revenues) less property and related expenses (property operation and maintenance and real estate taxes) and general and
administrative expenses. EBITDA is a non-GAAP measure. A reconciliation of non-GAAP measures to GAAP measures is contained in the Appendix to this
presentation.
25
Strong Organic Growth Drives
Significant Deleveraging
Committed to Attaining
Investment Grade Rating
Steady Improvement of Dividend Payout Ratio
26
✓ Approximately $7 million of FFO Core in excess of dividends in 2016
✓ Dividend / FFO Core Payout Ratio of 83% in 2016
Since 2011 WSR has increased dividends and FFO Core while improving Dividend Payout Ratio
Source: Company Filings
➢ Growth and Value Investment Opportunity
➢ Retail REIT with High Quality Properties in Affluent and High
Growth Markets
➢ E-Commerce Resistant Tenant Mix; Providing Services and
Necessities to the Community
➢ Strong Operations with Increasing Occupancies and Rents
➢ Solid Capital Structure Positioned For Growth
➢ Proven and Experience Management Team/Board of Trustees and
institutional-quality platform
Whitestone REIT: Unique Story and Opportunity
27
WHITESTONE IN PICTURES
29
Whitestone Properties
BLVD PLACE | Houston, TX BLVD PLACE | Houston, TX
30
Whitestone Properties
BLVD PLACE | Houston, TX BLVD PLACE | Houston, TX
31
Whitestone Properties
ELDORADO PLAZA | McKinney, TX ELDORADO PLAZA | McKinney, TX
32
Whitestone Properties
Village Square | Mesa, Arizona Village Square Development | Mesa, Arizona
33
Whitestone Properties
Davenport Village | Austin, TX Quinlan | Austin, TX
34
Starwood | DALLAS, TX Headquarters | DALLAS, TX
Whitestone Properties
35
Headquarters Village| DALLAS, TX La Mirada | SCOTTSDALE, AZ
Whitestone Properties
36
Dana Park | MESA, AZ
Whitestone Properties
The Promenade at Fulton Ranch | CHANDLER, AZ
37
Market Street at DC Ranch | SCOTTSDALE, AZ Market Street at DC Ranch | SCOTTSDALE, AZ
Whitestone Properties
38
Scottsdale Seville | SCOTTSDALE, AZ Sunset | SCOTTSDALE, AZ
Whitestone Properties
39
The Promenade at Fulton Ranch | CHANDLER, AZ The Promenade at Fulton Ranch | CHANDLER, AZ
Whitestone Properties
40
Appendix
Appendix: FFO (1) And FFO CORE (2) Reconciliation
41
(1) FFO: Management believes that FFO is a useful measure of the Company's operating performance. The Company computes FFO as defined by NAREIT, which states
that FFO should represent net income available to common shareholders (computed in accordance with GAAP) excluding gains or losses from sales of operating
assets, impairment charges and extraordinary items, plus depreciation and amortization of operating properties, including the Company's share of unconsolidated real
estate joint ventures and partnerships. FFO does not represent cash flows from operating activities determined in accordance with GAAP and should not be considered
an alternative to net income as an indication of the Company's performance or to cash flow from operations as a measure of liquidity or ability to make distributions and
service debt. Management considers FFO a useful additional measure of performance for an equity REIT because it facilitates an understanding of the operating
performance of its properties without giving effect to real estate depreciation and amortization, which assumes that the value of real estate assets diminishes
predictably over time. Since real estate values have historically risen or fallen with market conditions, management believes that FFO provides a more meaningful and
accurate indication of the Company's performance and useful information for the investment community to compare Whitestone to other REITs since FFO is generally
recognized as the industry standard for reporting the operations of REITs. Other REITs may use different methodologies for calculating FFO, and accordingly, the
Company's FFO may not be comparable to other REITs. The Company presents FFO per diluted share calculations that are based on the outstanding dilutive common
shares plus the outstanding OP units for the periods presented.
(2) FFO Core: Management believes that the computation of FFO in accordance with NAREIT's definition includes certain non-cash and non-comparable items that affect
the Company's period-over-period performance. These items include, but are not limited to, legal settlements, non-cash share-based compensation expense, rent
support agreement payments received from sellers on acquired assets and acquisition costs. In addition, the Company believes that FFO Core is a useful supplemental
measure for the investing community to use in comparing the Company to other REITs as many REITs provide some form of adjusted or modified FFO. However, other
REITs may use different adjustments, and the Company's FFO Core may not be comparable to the adjusted or modified FFO of other REITs.
Appendix: NOI Reconciliation (1)
42
(1) NOI: Management believes that NOI is a useful measure of the Company's property operating performance. The Company defines NOI as operating revenues (rental
and other revenues) less property and related expenses (property operation and maintenance, insurance and real estate taxes). Because NOI excludes general and
administrative expenses, depreciation and amortization, involuntary conversion, interest expense, interest income, provision for income taxes, gain or loss on sale or
disposition of assets and capital expenditures and leasing costs, it provides a performance measure that, when compared year over year, reflects the revenues and
expenses directly associated with owning and operating commercial real estate properties and the impact to operations from trends in occupancy rates, rental rates
and operating costs, providing perspective not immediately apparent from net income. The Company uses NOI to evaluate its operating performance since NOI allows
the Company to evaluate the impact of factors, such as occupancy levels, lease structure, lease rates and tenant base, have on the Company's results, margins and
returns. In addition, management believes that NOI provides useful information to the investment community about the Company's property and operating performance
when compared to other REITs since NOI is generally recognized as a standard measure of property performance in the real estate industry. However, NOI should not
be viewed as a measure of the Company's overall financial performance since it does not reflect general and administrative expenses, depreciation and amortization,
involuntary conversion, interest expense, interest income, provision for income taxes, gain or loss on sale or disposition of assets, and the level of capital expenditures
and leasing costs necessary to maintain the operating performance of the Company's properties. Other REITs may use different methodologies for calculating NOI, and
accordingly, the Company's NOI may not be comparable to that of other REITs.
Appendix: EBITDA (1) Reconciliation
43
(1) EBITDA: Management believes that EBITDA is an appropriate supplemental measure of operating performance to net income attributable to the Company. The
Company defines EBITDA as operating revenues (rental and other revenues) less property and related expenses (property operation and maintenance, insurance and
real estate taxes) and general and administrative expenses. Management believes that EBITDA provides useful information to the investment community about the
Company's operating performance when compared to other REITs since EBITDA is generally recognized as a standard measure. However, EBITDA should not be
viewed as a measure of the Company's overall financial performance since it does not reflect depreciation and amortization, involuntary conversion, interest expense,
provision for income taxes, gain or loss on sale or disposition of assets, and the level of capital expenditures and leasing costs necessary to maintain the operating
performance of the Company's properties. Other REITs may use different methodologies for calculating EBITDA and, accordingly, the Company's EBITDA may not be
comparable to other REITs.

More Related Content

What's hot

4 q17 earnings presentation final
4 q17 earnings presentation final4 q17 earnings presentation final
4 q17 earnings presentation finalmgm2017ir
 
Earnings2014 2qpresentationfinal-141029070000-conversion-gate01
Earnings2014 2qpresentationfinal-141029070000-conversion-gate01Earnings2014 2qpresentationfinal-141029070000-conversion-gate01
Earnings2014 2qpresentationfinal-141029070000-conversion-gate01OUTFRONTMediaIR
 
November 2016 general investor presentation v final
November 2016 general investor presentation v finalNovember 2016 general investor presentation v final
November 2016 general investor presentation v finalirbgcpartners
 
US Tax Reform - Jan. 2018
US Tax Reform - Jan. 2018US Tax Reform - Jan. 2018
US Tax Reform - Jan. 2018Mark MacIsaac
 
Cpi card group presentation 9.2.16
Cpi card group presentation 9.2.16Cpi card group presentation 9.2.16
Cpi card group presentation 9.2.16cpi2016ir
 
Real matters q1 2018 conference call update final
Real matters q1 2018 conference call update finalReal matters q1 2018 conference call update final
Real matters q1 2018 conference call update finalrealmatters2016
 
Franklin resources q1 2017
Franklin resources q1 2017Franklin resources q1 2017
Franklin resources q1 2017franklinresources
 
Barclays global financial services conference sep. 13 2016 final
Barclays global financial services conference sep. 13 2016 finalBarclays global financial services conference sep. 13 2016 final
Barclays global financial services conference sep. 13 2016 finalfirstamericaninvestors
 
Sem group earnings presentation 3q 2017 final
Sem group earnings presentation 3q 2017 finalSem group earnings presentation 3q 2017 final
Sem group earnings presentation 3q 2017 finalSemGroupCorporation
 
Sem group earnings presentation 3q 2017 final
Sem group earnings presentation 3q 2017 finalSem group earnings presentation 3q 2017 final
Sem group earnings presentation 3q 2017 finalSemGroupCorporation
 
Cpi card group presentation 9.15.16
Cpi card group presentation 9.15.16Cpi card group presentation 9.15.16
Cpi card group presentation 9.15.16cpi2016ir
 
MGM Second Quarter 2017 Earnings
MGM Second Quarter 2017 EarningsMGM Second Quarter 2017 Earnings
MGM Second Quarter 2017 Earningsmgm2017ir
 
Sem group investor presentation november 2017 final
Sem group investor presentation november 2017 finalSem group investor presentation november 2017 final
Sem group investor presentation november 2017 finalSemGroupCorporation
 
Management Investor Presentation - Q3 2016
Management Investor Presentation - Q3 2016Management Investor Presentation - Q3 2016
Management Investor Presentation - Q3 2016RioCan
 
QTS Q4 2020 Earnings Presentation
QTS Q4 2020 Earnings PresentationQTS Q4 2020 Earnings Presentation
QTS Q4 2020 Earnings PresentationKelly Michael
 
January 2017 investor presentation final
January 2017 investor presentation finalJanuary 2017 investor presentation final
January 2017 investor presentation finalSemGroupCorporation
 
4Q 2018 Earnings Conference Call Presentation
4Q 2018 Earnings Conference Call Presentation 4Q 2018 Earnings Conference Call Presentation
4Q 2018 Earnings Conference Call Presentation investors_principalfinancial
 
1Q 2017 Earnings Conference Call Presentation
1Q 2017 Earnings Conference Call Presentation 1Q 2017 Earnings Conference Call Presentation
1Q 2017 Earnings Conference Call Presentation investors_principalfinancial
 
SemGroup Earnings Presentation First Quarter 2017
SemGroup Earnings Presentation First Quarter 2017 SemGroup Earnings Presentation First Quarter 2017
SemGroup Earnings Presentation First Quarter 2017 SemGroupCorporation
 

What's hot (20)

4 q17 earnings presentation final
4 q17 earnings presentation final4 q17 earnings presentation final
4 q17 earnings presentation final
 
Earnings2014 2qpresentationfinal-141029070000-conversion-gate01
Earnings2014 2qpresentationfinal-141029070000-conversion-gate01Earnings2014 2qpresentationfinal-141029070000-conversion-gate01
Earnings2014 2qpresentationfinal-141029070000-conversion-gate01
 
November 2016 general investor presentation v final
November 2016 general investor presentation v finalNovember 2016 general investor presentation v final
November 2016 general investor presentation v final
 
US Tax Reform - Jan. 2018
US Tax Reform - Jan. 2018US Tax Reform - Jan. 2018
US Tax Reform - Jan. 2018
 
Cpi card group presentation 9.2.16
Cpi card group presentation 9.2.16Cpi card group presentation 9.2.16
Cpi card group presentation 9.2.16
 
Real matters q1 2018 conference call update final
Real matters q1 2018 conference call update finalReal matters q1 2018 conference call update final
Real matters q1 2018 conference call update final
 
Franklin resources q1 2017
Franklin resources q1 2017Franklin resources q1 2017
Franklin resources q1 2017
 
Barclays global financial services conference sep. 13 2016 final
Barclays global financial services conference sep. 13 2016 finalBarclays global financial services conference sep. 13 2016 final
Barclays global financial services conference sep. 13 2016 final
 
Sem group earnings presentation 3q 2017 final
Sem group earnings presentation 3q 2017 finalSem group earnings presentation 3q 2017 final
Sem group earnings presentation 3q 2017 final
 
Sem group earnings presentation 3q 2017 final
Sem group earnings presentation 3q 2017 finalSem group earnings presentation 3q 2017 final
Sem group earnings presentation 3q 2017 final
 
Cpi card group presentation 9.15.16
Cpi card group presentation 9.15.16Cpi card group presentation 9.15.16
Cpi card group presentation 9.15.16
 
MGM Second Quarter 2017 Earnings
MGM Second Quarter 2017 EarningsMGM Second Quarter 2017 Earnings
MGM Second Quarter 2017 Earnings
 
Sem group investor presentation november 2017 final
Sem group investor presentation november 2017 finalSem group investor presentation november 2017 final
Sem group investor presentation november 2017 final
 
Management Investor Presentation - Q3 2016
Management Investor Presentation - Q3 2016Management Investor Presentation - Q3 2016
Management Investor Presentation - Q3 2016
 
QTS Q4 2020 Earnings Presentation
QTS Q4 2020 Earnings PresentationQTS Q4 2020 Earnings Presentation
QTS Q4 2020 Earnings Presentation
 
January 2017 investor presentation final
January 2017 investor presentation finalJanuary 2017 investor presentation final
January 2017 investor presentation final
 
4Q 2018 Earnings Conference Call Presentation
4Q 2018 Earnings Conference Call Presentation 4Q 2018 Earnings Conference Call Presentation
4Q 2018 Earnings Conference Call Presentation
 
1Q 2017 Earnings Conference Call Presentation
1Q 2017 Earnings Conference Call Presentation 1Q 2017 Earnings Conference Call Presentation
1Q 2017 Earnings Conference Call Presentation
 
SemGroup Earnings Presentation First Quarter 2017
SemGroup Earnings Presentation First Quarter 2017 SemGroup Earnings Presentation First Quarter 2017
SemGroup Earnings Presentation First Quarter 2017
 
1 new ir 03-31-16
1 new ir 03-31-161 new ir 03-31-16
1 new ir 03-31-16
 

Similar to Whitestone REIT Investor Presentation Highlights Growth and Value

2Q 2017 Earnings Conference Call Presentation
2Q 2017 Earnings Conference Call Presentation 2Q 2017 Earnings Conference Call Presentation
2Q 2017 Earnings Conference Call Presentation investors_principalfinancial
 
2017 Wells Fargo Utility Conference
2017 Wells Fargo Utility Conference2017 Wells Fargo Utility Conference
2017 Wells Fargo Utility ConferenceInfraREIT
 
Q4 fy17 earnings presentation v f
Q4 fy17 earnings presentation v fQ4 fy17 earnings presentation v f
Q4 fy17 earnings presentation v fir_westrock
 
2017 09 27 Wolfe_Final_Presentation
2017 09 27 Wolfe_Final_Presentation2017 09 27 Wolfe_Final_Presentation
2017 09 27 Wolfe_Final_PresentationInfraREIT
 
Sem group earnings-presentation-1q-2017-final
Sem group earnings-presentation-1q-2017-finalSem group earnings-presentation-1q-2017-final
Sem group earnings-presentation-1q-2017-finalSemGroupCorporation
 
Q1 2018 earnings call slides 04.25.18 final
Q1 2018 earnings call slides 04.25.18 finalQ1 2018 earnings call slides 04.25.18 final
Q1 2018 earnings call slides 04.25.18 finalIronMInc
 
2Q18 Fixed Income Presentation
2Q18 Fixed Income Presentation2Q18 Fixed Income Presentation
2Q18 Fixed Income PresentationWelltower
 
Q4 2019 Earnings Presentation
Q4 2019 Earnings PresentationQ4 2019 Earnings Presentation
Q4 2019 Earnings PresentationQTSDataCenters
 
Q2 2014 Final Supplemental Reporting
Q2 2014 Final Supplemental ReportingQ2 2014 Final Supplemental Reporting
Q2 2014 Final Supplemental ReportingIronMInc
 
2018 0111 evercore_isi_final
2018 0111 evercore_isi_final2018 0111 evercore_isi_final
2018 0111 evercore_isi_finalInfraREIT
 
kref-q420-investor-presentation.pdf
kref-q420-investor-presentation.pdfkref-q420-investor-presentation.pdf
kref-q420-investor-presentation.pdfSPENCER KORANKYE
 
PHX Corporate Presentation March 2024 Final
PHX Corporate Presentation March 2024 FinalPHX Corporate Presentation March 2024 Final
PHX Corporate Presentation March 2024 FinalPanhandleOilandGas
 
MGM Third Quarter 2017 Earnings
MGM Third Quarter 2017 EarningsMGM Third Quarter 2017 Earnings
MGM Third Quarter 2017 Earningsmgm2017ir
 
4 q17 presentation final
4 q17 presentation   final4 q17 presentation   final
4 q17 presentation finalaoncorp
 
4 q17 presentation final2
4 q17 presentation   final24 q17 presentation   final2
4 q17 presentation final2aoncorp
 
4 q17 presentation final
4 q17 presentation   final4 q17 presentation   final
4 q17 presentation finalaoncorp
 
3 q2017 earnings_ppt_final
3 q2017 earnings_ppt_final3 q2017 earnings_ppt_final
3 q2017 earnings_ppt_finalInfraREIT
 
1Q 2018 Earnings Conference Call Presentation
1Q 2018 Earnings Conference Call Presentation 1Q 2018 Earnings Conference Call Presentation
1Q 2018 Earnings Conference Call Presentation investors_principalfinancial
 
Wrk mar 2017 investor presentation final
Wrk mar 2017 investor presentation finalWrk mar 2017 investor presentation final
Wrk mar 2017 investor presentation finalir_westrock
 
Sem group investor presentation post 4Q and FY 2016 earnings final
Sem group investor presentation post 4Q and FY 2016 earnings finalSem group investor presentation post 4Q and FY 2016 earnings final
Sem group investor presentation post 4Q and FY 2016 earnings finalSemGroupCorporation
 

Similar to Whitestone REIT Investor Presentation Highlights Growth and Value (20)

2Q 2017 Earnings Conference Call Presentation
2Q 2017 Earnings Conference Call Presentation 2Q 2017 Earnings Conference Call Presentation
2Q 2017 Earnings Conference Call Presentation
 
2017 Wells Fargo Utility Conference
2017 Wells Fargo Utility Conference2017 Wells Fargo Utility Conference
2017 Wells Fargo Utility Conference
 
Q4 fy17 earnings presentation v f
Q4 fy17 earnings presentation v fQ4 fy17 earnings presentation v f
Q4 fy17 earnings presentation v f
 
2017 09 27 Wolfe_Final_Presentation
2017 09 27 Wolfe_Final_Presentation2017 09 27 Wolfe_Final_Presentation
2017 09 27 Wolfe_Final_Presentation
 
Sem group earnings-presentation-1q-2017-final
Sem group earnings-presentation-1q-2017-finalSem group earnings-presentation-1q-2017-final
Sem group earnings-presentation-1q-2017-final
 
Q1 2018 earnings call slides 04.25.18 final
Q1 2018 earnings call slides 04.25.18 finalQ1 2018 earnings call slides 04.25.18 final
Q1 2018 earnings call slides 04.25.18 final
 
2Q18 Fixed Income Presentation
2Q18 Fixed Income Presentation2Q18 Fixed Income Presentation
2Q18 Fixed Income Presentation
 
Q4 2019 Earnings Presentation
Q4 2019 Earnings PresentationQ4 2019 Earnings Presentation
Q4 2019 Earnings Presentation
 
Q2 2014 Final Supplemental Reporting
Q2 2014 Final Supplemental ReportingQ2 2014 Final Supplemental Reporting
Q2 2014 Final Supplemental Reporting
 
2018 0111 evercore_isi_final
2018 0111 evercore_isi_final2018 0111 evercore_isi_final
2018 0111 evercore_isi_final
 
kref-q420-investor-presentation.pdf
kref-q420-investor-presentation.pdfkref-q420-investor-presentation.pdf
kref-q420-investor-presentation.pdf
 
PHX Corporate Presentation March 2024 Final
PHX Corporate Presentation March 2024 FinalPHX Corporate Presentation March 2024 Final
PHX Corporate Presentation March 2024 Final
 
MGM Third Quarter 2017 Earnings
MGM Third Quarter 2017 EarningsMGM Third Quarter 2017 Earnings
MGM Third Quarter 2017 Earnings
 
4 q17 presentation final
4 q17 presentation   final4 q17 presentation   final
4 q17 presentation final
 
4 q17 presentation final2
4 q17 presentation   final24 q17 presentation   final2
4 q17 presentation final2
 
4 q17 presentation final
4 q17 presentation   final4 q17 presentation   final
4 q17 presentation final
 
3 q2017 earnings_ppt_final
3 q2017 earnings_ppt_final3 q2017 earnings_ppt_final
3 q2017 earnings_ppt_final
 
1Q 2018 Earnings Conference Call Presentation
1Q 2018 Earnings Conference Call Presentation 1Q 2018 Earnings Conference Call Presentation
1Q 2018 Earnings Conference Call Presentation
 
Wrk mar 2017 investor presentation final
Wrk mar 2017 investor presentation finalWrk mar 2017 investor presentation final
Wrk mar 2017 investor presentation final
 
Sem group investor presentation post 4Q and FY 2016 earnings final
Sem group investor presentation post 4Q and FY 2016 earnings finalSem group investor presentation post 4Q and FY 2016 earnings final
Sem group investor presentation post 4Q and FY 2016 earnings final
 

Recently uploaded

Model Call Girl in Shastri Nagar Delhi reach out to us at 🔝8264348440🔝
Model Call Girl in Shastri Nagar Delhi reach out to us at 🔝8264348440🔝Model Call Girl in Shastri Nagar Delhi reach out to us at 🔝8264348440🔝
Model Call Girl in Shastri Nagar Delhi reach out to us at 🔝8264348440🔝soniya singh
 
Listing Turkey Sylvana Istanbul - Bahcesehir
Listing Turkey Sylvana Istanbul - BahcesehirListing Turkey Sylvana Istanbul - Bahcesehir
Listing Turkey Sylvana Istanbul - BahcesehirListing Turkey
 
Call Girls in Sarai Kale Khan Delhi 💯Call Us 🔝8264348440🔝
Call Girls in Sarai Kale Khan Delhi 💯Call Us 🔝8264348440🔝Call Girls in Sarai Kale Khan Delhi 💯Call Us 🔝8264348440🔝
Call Girls in Sarai Kale Khan Delhi 💯Call Us 🔝8264348440🔝soniya singh
 
Telibagh & Call Girls Lucknow - 450+ Call Girl Cash Payment 🎂 8923113531 🎪 Ne...
Telibagh & Call Girls Lucknow - 450+ Call Girl Cash Payment 🎂 8923113531 🎪 Ne...Telibagh & Call Girls Lucknow - 450+ Call Girl Cash Payment 🎂 8923113531 🎪 Ne...
Telibagh & Call Girls Lucknow - 450+ Call Girl Cash Payment 🎂 8923113531 🎪 Ne...gurkirankumar98700
 
SSPL The Strand Abodes Kharadi Pune Brochure.pdf
SSPL The Strand Abodes Kharadi Pune Brochure.pdfSSPL The Strand Abodes Kharadi Pune Brochure.pdf
SSPL The Strand Abodes Kharadi Pune Brochure.pdfabbu831446
 
9990771857 Call Girls in Noida Sector 06 Noida (Call Girls) Delhi
9990771857 Call Girls in Noida Sector 06 Noida (Call Girls) Delhi9990771857 Call Girls in Noida Sector 06 Noida (Call Girls) Delhi
9990771857 Call Girls in Noida Sector 06 Noida (Call Girls) Delhidelhimodel235
 
Call Girls In Hari Nagar Dadb Block {8447779280}Hari Nagar {West Delhi Escort...
Call Girls In Hari Nagar Dadb Block {8447779280}Hari Nagar {West Delhi Escort...Call Girls In Hari Nagar Dadb Block {8447779280}Hari Nagar {West Delhi Escort...
Call Girls In Hari Nagar Dadb Block {8447779280}Hari Nagar {West Delhi Escort...asmaqueen5
 
Call Girls In Mayur Vihar-1 Delhi ❤️8860477959 Good Looking Escorts In 24/7 D...
Call Girls In Mayur Vihar-1 Delhi ❤️8860477959 Good Looking Escorts In 24/7 D...Call Girls In Mayur Vihar-1 Delhi ❤️8860477959 Good Looking Escorts In 24/7 D...
Call Girls In Mayur Vihar-1 Delhi ❤️8860477959 Good Looking Escorts In 24/7 D...lizamodels9
 
SVN Live 4.22.24 Weekly Property Broadcast
SVN Live 4.22.24 Weekly Property BroadcastSVN Live 4.22.24 Weekly Property Broadcast
SVN Live 4.22.24 Weekly Property BroadcastSVN International Corp.
 
Call Girls in Kashmiri Gate Delhi 💯Call Us 🔝8264348440🔝
Call Girls in Kashmiri Gate Delhi 💯Call Us 🔝8264348440🔝Call Girls in Kashmiri Gate Delhi 💯Call Us 🔝8264348440🔝
Call Girls in Kashmiri Gate Delhi 💯Call Us 🔝8264348440🔝soniya singh
 
Low Rate Call Girls In Madipur Slum Quarter +91)8447779280Low Rate 2 short 2...
Low Rate Call Girls In Madipur Slum Quarter  +91)8447779280Low Rate 2 short 2...Low Rate Call Girls In Madipur Slum Quarter  +91)8447779280Low Rate 2 short 2...
Low Rate Call Girls In Madipur Slum Quarter +91)8447779280Low Rate 2 short 2...asmaqueen5
 
8 Key Elements for Comfortable Farmland Living
8 Key Elements for Comfortable Farmland Living 8 Key Elements for Comfortable Farmland Living
8 Key Elements for Comfortable Farmland Living Farmland Bazaar
 
Call Girls in Nehru Place Delhi 💯Call Us 🔝8264348440🔝
Call Girls in Nehru Place Delhi 💯Call Us 🔝8264348440🔝Call Girls in Nehru Place Delhi 💯Call Us 🔝8264348440🔝
Call Girls in Nehru Place Delhi 💯Call Us 🔝8264348440🔝soniya singh
 
Call Girls in Model Town Delhi 💯Call Us 🔝8264348440🔝
Call Girls in Model Town Delhi 💯Call Us 🔝8264348440🔝Call Girls in Model Town Delhi 💯Call Us 🔝8264348440🔝
Call Girls in Model Town Delhi 💯Call Us 🔝8264348440🔝soniya singh
 
Call Girls in Pitampura Delhi 💯Call Us 🔝8264348440🔝
Call Girls in Pitampura Delhi 💯Call Us 🔝8264348440🔝Call Girls in Pitampura Delhi 💯Call Us 🔝8264348440🔝
Call Girls in Pitampura Delhi 💯Call Us 🔝8264348440🔝soniya singh
 
9990771857 Call Girls in Noida Sector 10 Noida (Call Girls) Delhi
9990771857 Call Girls in Noida Sector 10 Noida (Call Girls) Delhi9990771857 Call Girls in Noida Sector 10 Noida (Call Girls) Delhi
9990771857 Call Girls in Noida Sector 10 Noida (Call Girls) Delhidelhimodel235
 
9990771857 Call Girls in Noida Sector 34 Noida (Call Girls) Delhi
9990771857 Call Girls in Noida Sector 34 Noida (Call Girls) Delhi9990771857 Call Girls in Noida Sector 34 Noida (Call Girls) Delhi
9990771857 Call Girls in Noida Sector 34 Noida (Call Girls) Delhidelhimodel235
 

Recently uploaded (20)

Hot call girls in Moti Bagh🔝 9953056974 🔝 escort Service
Hot call girls in Moti Bagh🔝 9953056974 🔝 escort ServiceHot call girls in Moti Bagh🔝 9953056974 🔝 escort Service
Hot call girls in Moti Bagh🔝 9953056974 🔝 escort Service
 
Model Call Girl in Shastri Nagar Delhi reach out to us at 🔝8264348440🔝
Model Call Girl in Shastri Nagar Delhi reach out to us at 🔝8264348440🔝Model Call Girl in Shastri Nagar Delhi reach out to us at 🔝8264348440🔝
Model Call Girl in Shastri Nagar Delhi reach out to us at 🔝8264348440🔝
 
Listing Turkey Sylvana Istanbul - Bahcesehir
Listing Turkey Sylvana Istanbul - BahcesehirListing Turkey Sylvana Istanbul - Bahcesehir
Listing Turkey Sylvana Istanbul - Bahcesehir
 
Low Rate Call Girls in Triveni Complex Delhi Call 9873940964
Low Rate Call Girls in Triveni Complex Delhi Call 9873940964Low Rate Call Girls in Triveni Complex Delhi Call 9873940964
Low Rate Call Girls in Triveni Complex Delhi Call 9873940964
 
Call Girls in Sarai Kale Khan Delhi 💯Call Us 🔝8264348440🔝
Call Girls in Sarai Kale Khan Delhi 💯Call Us 🔝8264348440🔝Call Girls in Sarai Kale Khan Delhi 💯Call Us 🔝8264348440🔝
Call Girls in Sarai Kale Khan Delhi 💯Call Us 🔝8264348440🔝
 
Telibagh & Call Girls Lucknow - 450+ Call Girl Cash Payment 🎂 8923113531 🎪 Ne...
Telibagh & Call Girls Lucknow - 450+ Call Girl Cash Payment 🎂 8923113531 🎪 Ne...Telibagh & Call Girls Lucknow - 450+ Call Girl Cash Payment 🎂 8923113531 🎪 Ne...
Telibagh & Call Girls Lucknow - 450+ Call Girl Cash Payment 🎂 8923113531 🎪 Ne...
 
SSPL The Strand Abodes Kharadi Pune Brochure.pdf
SSPL The Strand Abodes Kharadi Pune Brochure.pdfSSPL The Strand Abodes Kharadi Pune Brochure.pdf
SSPL The Strand Abodes Kharadi Pune Brochure.pdf
 
9990771857 Call Girls in Noida Sector 06 Noida (Call Girls) Delhi
9990771857 Call Girls in Noida Sector 06 Noida (Call Girls) Delhi9990771857 Call Girls in Noida Sector 06 Noida (Call Girls) Delhi
9990771857 Call Girls in Noida Sector 06 Noida (Call Girls) Delhi
 
Call Girls in Mahavir Nagar whatsaap call US +919953056974
Call Girls in Mahavir Nagar  whatsaap call US  +919953056974Call Girls in Mahavir Nagar  whatsaap call US  +919953056974
Call Girls in Mahavir Nagar whatsaap call US +919953056974
 
Call Girls In Hari Nagar Dadb Block {8447779280}Hari Nagar {West Delhi Escort...
Call Girls In Hari Nagar Dadb Block {8447779280}Hari Nagar {West Delhi Escort...Call Girls In Hari Nagar Dadb Block {8447779280}Hari Nagar {West Delhi Escort...
Call Girls In Hari Nagar Dadb Block {8447779280}Hari Nagar {West Delhi Escort...
 
Call Girls In Mayur Vihar-1 Delhi ❤️8860477959 Good Looking Escorts In 24/7 D...
Call Girls In Mayur Vihar-1 Delhi ❤️8860477959 Good Looking Escorts In 24/7 D...Call Girls In Mayur Vihar-1 Delhi ❤️8860477959 Good Looking Escorts In 24/7 D...
Call Girls In Mayur Vihar-1 Delhi ❤️8860477959 Good Looking Escorts In 24/7 D...
 
SVN Live 4.22.24 Weekly Property Broadcast
SVN Live 4.22.24 Weekly Property BroadcastSVN Live 4.22.24 Weekly Property Broadcast
SVN Live 4.22.24 Weekly Property Broadcast
 
Call Girls in Kashmiri Gate Delhi 💯Call Us 🔝8264348440🔝
Call Girls in Kashmiri Gate Delhi 💯Call Us 🔝8264348440🔝Call Girls in Kashmiri Gate Delhi 💯Call Us 🔝8264348440🔝
Call Girls in Kashmiri Gate Delhi 💯Call Us 🔝8264348440🔝
 
Low Rate Call Girls In Madipur Slum Quarter +91)8447779280Low Rate 2 short 2...
Low Rate Call Girls In Madipur Slum Quarter  +91)8447779280Low Rate 2 short 2...Low Rate Call Girls In Madipur Slum Quarter  +91)8447779280Low Rate 2 short 2...
Low Rate Call Girls In Madipur Slum Quarter +91)8447779280Low Rate 2 short 2...
 
8 Key Elements for Comfortable Farmland Living
8 Key Elements for Comfortable Farmland Living 8 Key Elements for Comfortable Farmland Living
8 Key Elements for Comfortable Farmland Living
 
Call Girls in Nehru Place Delhi 💯Call Us 🔝8264348440🔝
Call Girls in Nehru Place Delhi 💯Call Us 🔝8264348440🔝Call Girls in Nehru Place Delhi 💯Call Us 🔝8264348440🔝
Call Girls in Nehru Place Delhi 💯Call Us 🔝8264348440🔝
 
Call Girls in Model Town Delhi 💯Call Us 🔝8264348440🔝
Call Girls in Model Town Delhi 💯Call Us 🔝8264348440🔝Call Girls in Model Town Delhi 💯Call Us 🔝8264348440🔝
Call Girls in Model Town Delhi 💯Call Us 🔝8264348440🔝
 
Call Girls in Pitampura Delhi 💯Call Us 🔝8264348440🔝
Call Girls in Pitampura Delhi 💯Call Us 🔝8264348440🔝Call Girls in Pitampura Delhi 💯Call Us 🔝8264348440🔝
Call Girls in Pitampura Delhi 💯Call Us 🔝8264348440🔝
 
9990771857 Call Girls in Noida Sector 10 Noida (Call Girls) Delhi
9990771857 Call Girls in Noida Sector 10 Noida (Call Girls) Delhi9990771857 Call Girls in Noida Sector 10 Noida (Call Girls) Delhi
9990771857 Call Girls in Noida Sector 10 Noida (Call Girls) Delhi
 
9990771857 Call Girls in Noida Sector 34 Noida (Call Girls) Delhi
9990771857 Call Girls in Noida Sector 34 Noida (Call Girls) Delhi9990771857 Call Girls in Noida Sector 34 Noida (Call Girls) Delhi
9990771857 Call Girls in Noida Sector 34 Noida (Call Girls) Delhi
 

Whitestone REIT Investor Presentation Highlights Growth and Value

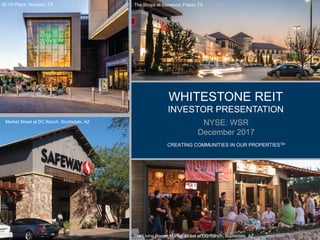
  • 1. WHITESTONE REIT INVESTOR PRESENTATION NYSE: WSR December 2017 CREATING COMMUNITIES IN OUR PROPERTIESTM The Shops at Starwood, Frisco, TX The Living Room, Market Street at DC Ranch, Scottsdale, AZ 1 Market Street at DC Ranch, Scottsdale, AZ BLVD Place, Houston, TX
  • 2. Forward Looking Statements 2 This presentation contains forward-looking statements within the meaning of Section 27A of the Securities Act of 1933, as amended, and Section 21E of the Securities Exchange Act of 1934, as amended. Forward-looking statements provide our current expectations or forecasts of future events and are not statements of historical fact. These forward-looking statements include information about possible or assumed future events, including, among other things, discussion and analysis of the financial condition, pending acquisitions and the impact of such acquisitions on Whitestone REIT, or the Company, including expected financing developments, capitalization rates and internal rates of return, the financial condition and results of operations of the Company, anticipated capital expenditures required to complete projects, amounts of anticipated cash distributions to the Company’s shareholders in the future and other matters. These forward-looking statements are not historical facts but are the intent, belief or current expectations of the Company’s management based on its knowledge and understanding of the Company’s business and industry. Forward-looking statements are typically identified by the use of terms such as “may,” “will,” “should,” “potential,” “predicts,” “anticipates,” “expects,” “intends,” “plans,” “believes,” “seeks,” “estimates” or the negative of such terms and variations of these words and similar expressions, although not all forward-looking statements include these words. These statements are not guarantees of future performance and are subject to risks, uncertainties and other factors, some of which are beyond the Company’s control, are difficult to predict and could cause actual results to differ materially from those expressed or forecasted in the forward-looking statements. Forward-looking statements that were true at the time made may ultimately prove to be incorrect or false. You are cautioned not to place undue reliance on forward-looking statements. The Company undertakes no obligation to update or revise forward-looking statements to reflect changed assumptions, the occurrence of unanticipated events or changes to future operating results. Factors that could cause actual results to differ materially from any forward-looking statements made in this presentation include the Company’s ability to successfully finance and complete its pending acquisitions and related developments and, if completed, the ability of such newly acquired properties to perform as expected, including with respect to rates of return; the imposition of federal taxes if the Company fails to qualify as a REIT in any taxable year or foregoes an opportunity to ensure REIT status; uncertainties related to the national economy, the real estate industry in general and in the Company’s specific markets; legislative or regulatory changes, including changes to laws governing REITs; adverse economic or real estate developments in Texas, Arizona or Illinois; increases in interest rates and operating costs; availability and terms of capital and financing, both to fund the Company’s operations and to refinance its indebtedness as it matures; decreases in rental rates or increases in vacancy rates; litigation risks; lease-up risks, including leasing risks arising from exclusivity and consent provisions in leases with significant tenants; the Company’s inability to renew tenant leases or obtain new tenants upon the expiration of existing leases; the Company’s inability to generate sufficient cash flows due to market conditions, competition, uninsured losses, changes in tax or other applicable laws; and the need to fund tenant improvements or other capital expenditures out of operating cash flow. The forward-looking statements should be read in light of these factors and the factors identified in the “Risk Factors” included in the Company’s most recent Annual Report on Form 10-K, Quarterly Reports on Form 10-Q and other reports and information that it files with the Securities and Exchange Commission, or the SEC. This presentation is not an offer to sell, nor a solicitation of an offer to buy securities, nor shall there be any sale of securities in any state or jurisdiction in which the offer, solicitation or sale would be unlawful prior to registration or qualification under the securities laws of such state or jurisdiction. The Company obtained the industry, market and competitive position data used in this presentation from (i) its own internal estimates and research of third-party company websites and other sources, (ii) industry and general publications and research or (iii) studies and surveys conducted by third parties. Such sources generally do not guarantee the accuracy or completeness of included information. While the Company believes that the information included in this presentation from such publications, research, studies, surveys and websites is reliable, it has not independently verified data from these third-party sources. While the Company believes its internal estimates and research are reliable, neither such estimates and research nor such definitions have been verified by any independent source. This presentation contains supplemental financial measures that are not calculated pursuant to U.S. generally accepted accounting principles, or GAAP, including EBITDA, FFO, FFO Core, and NOI. These non-GAAP measures are in addition to, not a substitute for or superior to, measures of financial performance prepared in accordance with GAAP. A reconciliation of non-GAAP measures to GAAP measures is contained in the Appendix to this presentation.
  • 3. ➢ Growth and Value Investment Opportunity ➢ Retail REIT with High Quality Properties in Affluent and High Growth Markets ➢ E-Commerce Resistant Tenant Mix; Providing Services and Necessities to the Community ➢ Strong Operations with Increasing Occupancies and Rents ➢ Solid Capital Structure Positioned For Growth ➢ Proven and Experience Management Team/Board of Trustees and institutional-quality platform 72 properties (2) 6.6 million GLA (2) 1,649 tenants (2) 90% occupancy (3) $18.84 ABR per sq. ft. (3)(4) +4.7% SS NOI Growth (3)(5) $586 million (Equity Market Cap) (6) $1.2 billion (Enterprise Value) (6) NYSE: WSR IPO - August 2010 (1) As of Sept 30, 2017 except where indicated. (2) Includes properties owned through Pillarstone Capital REIT Operating Partnership LP as of Sept 30, 2017. (3) Excludes properties owned through Pillarstone Capital REIT Operating Partnership LP as of Sept 30, 2017. (4) Annualized base rent (“ABR”) represents monthly base rent as of Sept 30, 2017 multiplied by 12. (5) Represents same store (“SS”) net operating income (“NOI”) growth for Q3-17 vs. Q3-16. (6) Calculated using closing price of WSR common shares on November 24, 2017 of $14.79 per share. Whitestone REIT: Unique Story and Opportunity 3 Fast Facts Existing Portfolio (1)
  • 4. Financial Highlights 4 25% growth in Revenue 27% growth in NOI (1) 25% growth in FFO (2) 33% growth in FFO Core (2) 9% growth in FFO Core per Share(2) (1) The Company defines NOI as operating revenues (rental and other revenues) less property and related expenses (property operation and maintenance and real estate taxes). NOI is a non-GAAP measure. A reconciliation of non-GAAP measures to GAAP measures is contained in the Appendix to this presentation. (2) The Company defines FFO as defined by NAREIT, which states that FFO should represent net income available to common shareholders (computed in accordance with GAAP) excluding gains or losses from sales of operating assets, impairment charges and extraordinary items, plus depreciation and amortization of operating properties, including the Company's share of unconsolidated real estate joint ventures and partnerships. The Company defines FFO Core as FFO excluding certain non-cash and non-comparable items that affect the Company's period-over-period performance, including, but not limited to, legal settlements, non-cash share-based compensation expense, rent support agreement payments received from sellers on acquired assets and acquisition costs. FFO and FFO Core are non-GAAP measures. A reconciliation of non-GAAP measures to GAAP measures is contained in the Appendix to this presentation. (3) Source: SNL, as of November 24, 2017 (4) Timeframe Jan 1, 2011 through Dec 31, 2016 CAGR - Five Years Ended December 31, 2016(4) 1 Year: 18% #1 of 17 3 Year: 28% #2 of 16 5 Year: 63% #4 of 15 Rank Amount Public REIT Shopping Centers (3) Total Shareholder Return(3)
  • 5. Proven Track Record of Growth 5 Revenue Gross Assets Note: Dollars in millions, CAGR Timeframe Jan 1, 2011 through Dec 31,2016. $34.9 $46.6 $62.1 $72.4 $93.4 $104.4 $134.6 2011 2012 2013 2014 2015 2016 Q3-17 (A)
  • 6. Proven Track Record of Growth 6 FFO Core / Share NOI Note: Dollars in millions, CAGR Timeframe Jan 1, 2011 through Dec 31, 2016 $21.6 $28.2 $37.8 $47.2 $62.1 $70.3 $89.5 2011 2012 2013 2014 2015 2016 Q3-17 (A)
  • 7. Proven Ability to MANAGE & SUSTAIN Growth 7 Note: Dollars in millions. 2017 Annualized-3Q17 times 4 2010 IPO YEAR-END 2013 2017(ANNUALIZED) Annual FFO Core (millions) $7.9 $20.8 $52.4 Annual NOI (millions) $19.3 $37.8 $89.5 Dividends Paid to Shareholders (millions) $7.4 $21.0 $43.8 # of Properties 37 60 72 # of Tenants 770 1,243 1,649 # of Employees 50 68 106 Gross Leasable Area 3,014,264 4,966,330 6,547,658 Gross Real Estate Assets $205.0 $546.3 $1,144.5
  • 8. Identified Disruption in the Retail Landscape 8 BOOMERS • Time Constrained Consumers = Demand Greater Convenience • Spending Growth on Services • Downsizing Living Space Flows through to Downsizing in Retail MILLENNIALS • Lifestyle Revolves Around Mobility and Flexibility • Comfortable with the Sharing/Smaller Space Economy • Need for Connection is Stronger • Changing the Demand for Purchasing Soft and Hard Goods DUAL INCOME HOUSEHOLDS • More Profound Impact on Household Spending • Entertaining More Outside the Smaller Home • Experiential Dynamic of Consumption has Increased AMAZON • Dominates the Purchase and Delivery of Hard and Soft Goods • Expanding their Delivery of Need-Based Items with the Purchase of Whole Foods
  • 9. The 19 properties include: Heritage Trace Plaza, The Strand at Huebner Oaks, The Promenade at Fulton Ranch, Fulton Ranch Towne Center, Fulton Ranch TC Hard Corner, Williams Trace Plaza, The Shops at Williams Trace, Dana Park Pad, City View Village, Davenport Village, Parkside Village South, Parkside Village North, Gilbert Hard Corner, Quinlan Crossing, Keller Place, La Mirada, Scottsdale Seville, BLVD Place and Eldorado Plaza 9 Selectively Acquired Targeted Properties 19 Closed Unlevered Project Internal Rate of Return of 15% 1,626 Transactions Pass Initial Triage • Business-friendly states • Local • Community-centered • Service-focused 271 Underwritten • Dense populated Sunbelt • Generally 50k – 200k RSF, sometimes larger 43 Offers Made • Attractive price • Value-add opportunities (excess land /new pads) • Potential for service- based tenant mix • Potential for lease normalization • Target unlevered IRR above cost of capital • Acquired 19 properties from 20141 to 2017 • Total Purchase Price $560M • Total GLA of 1.8m square feet
  • 10. Acquisition Activity Robust and Well Timed with Capital 10 • Whitestone continues to make acquisitions in its core markets • Expanding footprint yielding cost synergies at the corporate level • Market share gains driving pricing power at the leasing level
  • 11. 0 2 4 6 8 Population in millions Focused on High Growth Markets 27 Properties 44 Properties 6.6% 9.7% 8.6% 8.0% 9.7%Austin Phoenix San Antonio Houston Dallas-Fort Worth 11 Note: Portfolio includes 1 property in Chicago; (1) Source: The Atlantic CityLab 2013 to 2014. (2) Source: Claritas, as of April 2017. (3) As a percentage of portfolio NOI for quarter ended Sept 30, 2017. Amounts proforma for full quarter NOI from Q3-17 Acquisitions. Excludes properties owned through Pillarstone Capital REIT Operating Partnership LP. 2017E MSA Population (mm) (2) % Growth ’17E - ’22E Net Total Migration (1) Phoenix 2016 and 2017 Acquisitions Existing Properties San Antonio Austin Geographic Exposure (3) +100,000 -100,000 +50,000 -50,000 +10,000 -10,000
  • 12. Business-Friendly. Attractive Demographics. 12 AUSTIN #1 Next Biggest Boom Town #1 Fastest Growing City in the U.S. for the 4th Consecutive Year DALLAS #1 Top Emerging Real Estate Market in 2016 #1 Most Business Friendly City in America #1 Great Cities for Starting a Business PHOENIX #3 Largest Labor Pool in the West #5 Fastest Growing Tech Market SAN ANTONIO Top 10 Fastest Growing City 113,000 jobs created in the last 5 years, with +25,000 in 2016 HOUSTON #1 in the world in GDP per capita +1,500 significant corporate relocations or expansions since 2009 #1 in job creation among MSAs over the past 15 years
  • 13. Meeting the Needs of Affluent Communities While Reducing Risks 13Note: Definitions sourced from ULI
  • 14. Services & Entertainment… Dining 22% Specialty Retail 17% Health & Wellness 16% Grocery 11% Education 6% 14 Capitalized on the Disruption in the Retail Industry Focused on Local Services & Experiences Complemented by Brands You Know & Trust 85% SERVICE-BASED AND OPTIMIZED TENANT COMPOSITION 15% 13% 12% 5% 32% 23% Only two tenants with more than 2% ABR Safeway (2.5%) Whole Foods(2.1%) Diverse, Ecommerce-Resistant Tenant Base (1) (1) As of Sept 30, 2017. Excludes properties owned through Pillarstone Capital REIT Operating Partnership LP.
  • 15. Strong Household Income Leads to Greater Discretionary Spending(2) 15 (1) Source: S&P Global Market Nov 2017 . (2) Retail portfolio only. Excludes properties owned through Pillarstone Capital REIT Operating Partnership LP. $94,232 $81,910 $80,950 $72,950 $67,297 $63,931 $60,049 $50,000 $60,000 $70,000 $80,000 $90,000 $100,000 FRT WSR REG KIM DDR WRI BRX MedianHouseholdIncome(3-mileradius)(1) Peer Average: $74,474
  • 16. Attractive Demographic Drivers vs. Peers 16 Source: Claritas, SNL Financial and Wall Street Research as of May 2016. Highly Educated Workforce. High Household Income. Strong Population Growth.
  • 17. Limited Exposure to Power Centers Relative to Peers (1) 17 Source: Green Street Advisors (11-24-2017) and Company Filings. (1) Percentages shown represent percentage of total properties. WSR total properties include properties owned through Pillarstone Capital REIT Operating Partnership LP as of September 30, 2017. 1% 23% 44% 45% 46% 51% 86% 0% 10% 20% 30% 40% 50% 60% 70% 80% 90% 100% WSR REG FRT WRI BRX KIM DDR PercentofPowerCenters Peer Average: 49%
  • 18. 5.1% 3.5% 3.3% 3.1% 2.8% 2.5% 2.0% WSR REG WRI FRT KIM BRX DDR Strong Internal Growth 18 Attractive Same-Store NOI Growth (1) Increasing Occupancy Growing Rent Levels Total Occupancy (2) ABR per Sq. Ft. (2) . (1) For WSR excludes investment in Pillarstone Capital REIT Operating Partnership LP; Source: various company filings. (2) Occupancy and ABR per sq. ft. as of September 30, 2017. Excludes properties owned through Pillarstone Capital REIT Operating Partnership LP. SS NOI Growth Rate – 2016 Growth Rates (1) 80.3% 90.1% 3Q10 3Q17 $10.43 $18.84 3Q10 3Q17 Peer Average 2.9%
  • 19. Leasing Activity and Spreads (1) (Sq. Ft. in 000’s) Upcoming Lease Expirations (Sq. Ft. in 000’s) Strong Leasing Activity 19 Note: Does not represent pro forma numbers for BLVD Place and Eldorado Plaza acquisitions. (1) Annual leasing spread represent the year-over-year percentage increase in contractual rent per square foot for lease renewals and new leases executed during the trailing twelve months for the respective period. (2) Includes properties owned through Pillarstone Capital REIT Operating Partnership LP. +2.1% +9.4%+2.0% +7.9% +8.2% (1) (1) − Weighted Average Remaining Lease Term: 4.2 Years − Potential to capture growth from below market leases Executed Leases – Sq. Ft. (New and Renewal) (2) Expiring Leases – Sq. Ft. (2) +7.6% 685 835 862 966 1,121 727 2012 2013 2014 2015 2016 9ME Q3-17
  • 20. Increasing ABR Per Sq. Ft. (1) Strong Growth with Moderate ABR vs. Peers 20 (1) ABR per Sq. Ft. for the portfolio as of Sept 30, 2017. Excludes properties owned through Pillarstone Capital REIT Operating Partnership LP. (2) Source: various company filings. ABR Per Sq. Ft. (2) Peer Average: $18.44 $26.72 $20.61 $18.84 $18.58 $16.16 $15.33 $13.28 $- $5.00 $10.00 $15.00 $20.00 $25.00 $30.00 FRT REG WSR WRI DDR KIM BRX $11.21 $12.21 $13.04 $14.82 $15.75 $17.33 $18.84 2011 2012 2013 2014 2015 2016 Q3-17
  • 21. (1) Other liabilities includes accounts payable and accrued expenses, tenants’ security deposits and dividends and distributions payable. (2) Other assets includes marketable securities, escrows and acquisition deposits, accrued and accounts receivable, net of allowance for doubtful accounts and prepaid expenses and other assets. (3) Source: S&P Global, November 24, 2017. (4) Retail portfolio only. (5) Source: Claritas, SNL Financial and Wall Street Research as of May 2016. (6) Source: Green Street Advisors (11/24/2017). Percentages shown represent percentage of total properties. WSR total properties include properties owned through Pillarstone Capital REIT Operating Partnership LP as of Sept 30, 2017. (7) Estimated 2018 Cash NOI represents Q3 ‘17 NOI of $22.4 annualized, adjusted for straight line rents, FAS 141 adjustment and partial period acquisitions and grown at 4.5% annual same-store growth rate. Unique Opportunity with Attractive Entry Point Illustrative Implied Cap Rate 21
  • 22. Proven Track Record of Increasing Yield on Cost 22 Acquisitions from 2010 to 2013 have improved yields by 168bps on average Potential to improve yields on more recent acquisitions (2014 – 2017) Number of GLA Sq. Ft. in Yield on Total Cost Acquisitions (000's) Initial(1) Current(2) Change (bps) 2010/2011 10 596 7.1% 8.9% +178 bps 2012 5 675 7.2% 9.5% +237 bps 2013 6 690 7.2% 7.9% +67 bps '10-'13 Total / W.A.(3) 21 1,961 7.2% 8.7% +154 bps Number of GLA Sq. Ft. in Yield on Total Cost Acquisitions (000's) Initial(1) Current(2) Change (bps) 2014 8 631 7.5% 7.5% - bps 2015 7 482 6.7% 5.9% - 76 bps '14-'17 Total / W.A.(3) 19 1,789 6.8% 6.9% +14bps 2016/2017 4 676 6.5% 7.2% +72 bps Source: Company management. (1) Initial yield calculated as described in note 2 on page 7. (2) Current yield defined as Q3 ‘17 property-level NOI annualized divided by gross book value of real estate assets, undepreciated as of September 30, 2017. (3) Weighted average calculated based on gross invested capital (purchase price plus additional investment)
  • 23. Optimizing Our Capital Structure 23 24% 19% 39% 16% 1% 33% 3%53% 11% Equity - Retail Investors Equity - Institutional Investors Unsecured Debt Mortgage Debt Non-Controlling Interest 18% 28% 34% $191.4M ENTERPRISE VALUE • EV +6x • More Stable Capital Structure • Institutional Quality Balance Sheet $1.25B ENTERPRISE VALUE IPO 2010 CURRENT (1) 19% (1) As of November 24, 2017
  • 24. Limited Near Term Debt Maturities (1) 24 Note: Debt maturity schedule excludes scheduled amortization payment; does not represent pro forma numbers for BLVD and Eldorado acquisitions (1) As of Sept 30, 2017. (2) Revolving Credit Facility includes an accordion feature that will allow the Operating Partnership to increase the borrowing capacity by an additional $200 million, upon the satisfaction of certain conditions. (3) Revolving Credit Facility matures in October 2019 with a one year extension option. Chart assumes extension option is exercised. Total Debt: $656mm Unused Revolver Capacity (2) $73mm Wtd. Avg. Fixed Maturity: ~5.4 Years Wtd. Avg. Fixed Interest Rate: 3.9% Floating 33% Fixed 67% (3)
  • 25. 8.3x (0.6x) (0.7x) 7.0x Reduction of Debt/EBITDA Ratio – Pro Forma (1) WSR will seek to organically reduce its Debt / EBITDA ratio over the next 24 months 3Q-2017 Projected Same Store NOI Growth(2) Projected Lease-up to 95% Occupancy(3) Pro Forma (1) Adjusted for projected same store NOI growth and projected lease-up. Assumes debt remains at Sept 30, 2017 levels, except as described in note 3 below. (2) Assumes 4.0% annual same store NOI growth for two years. (3) Assumes incremental EBITDA of $10 million from the lease up of the total portfolio to 95% at an average rental rate, including triple net reimbursements of $20 per square foot. Also assumes incremental debt of $9.9 million to fund tenant improvements and lease commissions for lease-up. The Company defines EBITDA as operating revenues (rental and other revenues) less property and related expenses (property operation and maintenance and real estate taxes) and general and administrative expenses. EBITDA is a non-GAAP measure. A reconciliation of non-GAAP measures to GAAP measures is contained in the Appendix to this presentation. 25 Strong Organic Growth Drives Significant Deleveraging Committed to Attaining Investment Grade Rating
  • 26. Steady Improvement of Dividend Payout Ratio 26 ✓ Approximately $7 million of FFO Core in excess of dividends in 2016 ✓ Dividend / FFO Core Payout Ratio of 83% in 2016 Since 2011 WSR has increased dividends and FFO Core while improving Dividend Payout Ratio Source: Company Filings
  • 27. ➢ Growth and Value Investment Opportunity ➢ Retail REIT with High Quality Properties in Affluent and High Growth Markets ➢ E-Commerce Resistant Tenant Mix; Providing Services and Necessities to the Community ➢ Strong Operations with Increasing Occupancies and Rents ➢ Solid Capital Structure Positioned For Growth ➢ Proven and Experience Management Team/Board of Trustees and institutional-quality platform Whitestone REIT: Unique Story and Opportunity 27
  • 29. 29 Whitestone Properties BLVD PLACE | Houston, TX BLVD PLACE | Houston, TX
  • 30. 30 Whitestone Properties BLVD PLACE | Houston, TX BLVD PLACE | Houston, TX
  • 31. 31 Whitestone Properties ELDORADO PLAZA | McKinney, TX ELDORADO PLAZA | McKinney, TX
  • 32. 32 Whitestone Properties Village Square | Mesa, Arizona Village Square Development | Mesa, Arizona
  • 33. 33 Whitestone Properties Davenport Village | Austin, TX Quinlan | Austin, TX
  • 34. 34 Starwood | DALLAS, TX Headquarters | DALLAS, TX Whitestone Properties
  • 35. 35 Headquarters Village| DALLAS, TX La Mirada | SCOTTSDALE, AZ Whitestone Properties
  • 36. 36 Dana Park | MESA, AZ Whitestone Properties The Promenade at Fulton Ranch | CHANDLER, AZ
  • 37. 37 Market Street at DC Ranch | SCOTTSDALE, AZ Market Street at DC Ranch | SCOTTSDALE, AZ Whitestone Properties
  • 38. 38 Scottsdale Seville | SCOTTSDALE, AZ Sunset | SCOTTSDALE, AZ Whitestone Properties
  • 39. 39 The Promenade at Fulton Ranch | CHANDLER, AZ The Promenade at Fulton Ranch | CHANDLER, AZ Whitestone Properties
  • 41. Appendix: FFO (1) And FFO CORE (2) Reconciliation 41 (1) FFO: Management believes that FFO is a useful measure of the Company's operating performance. The Company computes FFO as defined by NAREIT, which states that FFO should represent net income available to common shareholders (computed in accordance with GAAP) excluding gains or losses from sales of operating assets, impairment charges and extraordinary items, plus depreciation and amortization of operating properties, including the Company's share of unconsolidated real estate joint ventures and partnerships. FFO does not represent cash flows from operating activities determined in accordance with GAAP and should not be considered an alternative to net income as an indication of the Company's performance or to cash flow from operations as a measure of liquidity or ability to make distributions and service debt. Management considers FFO a useful additional measure of performance for an equity REIT because it facilitates an understanding of the operating performance of its properties without giving effect to real estate depreciation and amortization, which assumes that the value of real estate assets diminishes predictably over time. Since real estate values have historically risen or fallen with market conditions, management believes that FFO provides a more meaningful and accurate indication of the Company's performance and useful information for the investment community to compare Whitestone to other REITs since FFO is generally recognized as the industry standard for reporting the operations of REITs. Other REITs may use different methodologies for calculating FFO, and accordingly, the Company's FFO may not be comparable to other REITs. The Company presents FFO per diluted share calculations that are based on the outstanding dilutive common shares plus the outstanding OP units for the periods presented. (2) FFO Core: Management believes that the computation of FFO in accordance with NAREIT's definition includes certain non-cash and non-comparable items that affect the Company's period-over-period performance. These items include, but are not limited to, legal settlements, non-cash share-based compensation expense, rent support agreement payments received from sellers on acquired assets and acquisition costs. In addition, the Company believes that FFO Core is a useful supplemental measure for the investing community to use in comparing the Company to other REITs as many REITs provide some form of adjusted or modified FFO. However, other REITs may use different adjustments, and the Company's FFO Core may not be comparable to the adjusted or modified FFO of other REITs.
  • 42. Appendix: NOI Reconciliation (1) 42 (1) NOI: Management believes that NOI is a useful measure of the Company's property operating performance. The Company defines NOI as operating revenues (rental and other revenues) less property and related expenses (property operation and maintenance, insurance and real estate taxes). Because NOI excludes general and administrative expenses, depreciation and amortization, involuntary conversion, interest expense, interest income, provision for income taxes, gain or loss on sale or disposition of assets and capital expenditures and leasing costs, it provides a performance measure that, when compared year over year, reflects the revenues and expenses directly associated with owning and operating commercial real estate properties and the impact to operations from trends in occupancy rates, rental rates and operating costs, providing perspective not immediately apparent from net income. The Company uses NOI to evaluate its operating performance since NOI allows the Company to evaluate the impact of factors, such as occupancy levels, lease structure, lease rates and tenant base, have on the Company's results, margins and returns. In addition, management believes that NOI provides useful information to the investment community about the Company's property and operating performance when compared to other REITs since NOI is generally recognized as a standard measure of property performance in the real estate industry. However, NOI should not be viewed as a measure of the Company's overall financial performance since it does not reflect general and administrative expenses, depreciation and amortization, involuntary conversion, interest expense, interest income, provision for income taxes, gain or loss on sale or disposition of assets, and the level of capital expenditures and leasing costs necessary to maintain the operating performance of the Company's properties. Other REITs may use different methodologies for calculating NOI, and accordingly, the Company's NOI may not be comparable to that of other REITs.
  • 43. Appendix: EBITDA (1) Reconciliation 43 (1) EBITDA: Management believes that EBITDA is an appropriate supplemental measure of operating performance to net income attributable to the Company. The Company defines EBITDA as operating revenues (rental and other revenues) less property and related expenses (property operation and maintenance, insurance and real estate taxes) and general and administrative expenses. Management believes that EBITDA provides useful information to the investment community about the Company's operating performance when compared to other REITs since EBITDA is generally recognized as a standard measure. However, EBITDA should not be viewed as a measure of the Company's overall financial performance since it does not reflect depreciation and amortization, involuntary conversion, interest expense, provision for income taxes, gain or loss on sale or disposition of assets, and the level of capital expenditures and leasing costs necessary to maintain the operating performance of the Company's properties. Other REITs may use different methodologies for calculating EBITDA and, accordingly, the Company's EBITDA may not be comparable to other REITs.