
Recommended
Recommended
More Related Content
What's hot
What's hot (20)
Similar to Whitestone REIT Investor Presentation February 2018
Similar to Whitestone REIT Investor Presentation February 2018 (20)
Recently uploaded
Recently uploaded (20)
Whitestone REIT Investor Presentation February 2018
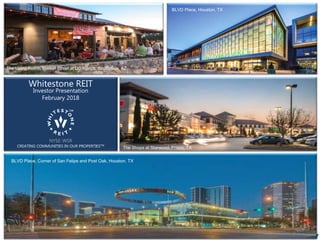
- 1. WHITESTONE REIT INVESTOR PRESENTATION CREATING COMMUNITIES IN OUR PROPERTIESTM The Shops at Starwood, Frisco, TX The Living Room, Market Street at DC Ranch, Scottsdale, AZ 1 BLVD Place, Houston, TX The Shops at Starwood, Frisco, TX BLVD Place, Corner of San Felipe and Post Oak, Houston, TX Whitestone REIT Investor Presentation February 2018 NYSE: WSR CREATING COMMUNITIES IN OUR PROPERTIESTM BLVD Place, Houston, TX The Shops at Starwood, Frisco, TX The Living Room, Market Street at DC Ranch, Scottsdale, AZ
- 2. Forward Looking Statements 2 This presentation contains forward-looking statements within the meaning of Section 27A of the Securities Act of 1933, as amended, and Section 21E of the Securities Exchange Act of 1934, as amended. Forward-looking statements provide our current expectations or forecasts of future events and are not statements of historical fact. These forward-looking statements include information about possible or assumed future events, including, among other things, discussion and analysis of acquisitions and the impact of such acquisitions on Whitestone REIT, or the Company, including expected financing developments, capitalization rates and internal rates of return, the financial condition and results of operations of the Company, anticipated capital expenditures required to complete projects, amounts of anticipated cash distributions to the Company’s shareholders in the future and other matters. These forward-looking statements are not historical facts but are the intent, belief or current expectations of the Company’s management based on its knowledge and understanding of the Company’s business and industry. Forward-looking statements are typically identified by the use of terms such as “may,” “will,” “should,” “potential,” “predicts,” “anticipates,” “expects,” “intends,” “plans,” “believes,” “seeks,” “estimates” or the negative of such terms and variations of these words and similar expressions, although not all forward-looking statements include these words. These statements are not guarantees of future performance and are subject to risks, uncertainties and other factors, some of which are beyond the Company’s control, are difficult to predict and could cause actual results to differ materially from those expressed or forecasted in the forward-looking statements. Forward-looking statements that were true at the time made may ultimately prove to be incorrect or false. You are cautioned not to place undue reliance on forward-looking statements. The Company undertakes no obligation to update or revise forward-looking statements to reflect changed assumptions, the occurrence of unanticipated events or changes to future operating results. Factors that could cause actual results to differ materially from any forward-looking statements made in this presentation include the ability of newly acquired properties to perform as expected, including with respect to rates of return; the imposition of federal taxes if the Company fails to qualify as a REIT in any taxable year or foregoes an opportunity to ensure REIT status; uncertainties related to the national economy, the real estate industry in general and in the Company’s specific markets; legislative or regulatory changes, including changes to laws governing REITs; adverse economic or real estate developments in Texas, Arizona or Illinois; increases in interest rates; operating costs or general and administrative expenses, including those incurred in connection with the nomination of trustees by a shareholder of the Company; availability and terms of capital and financing, both to fund the Company’s operations and to refinance its indebtedness as it matures; decreases in rental rates or increases in vacancy rates; litigation risks; lease-up risks, including leasing risks arising from exclusivity and consent provisions in leases with significant tenants; the Company’s inability to renew tenant leases or obtain new tenants upon the expiration of existing leases; the Company’s inability to generate sufficient cash flows to fund its operations or distributions to shareholders due to market conditions, competition, uninsured losses, changes in tax or other applicable laws; and the need to fund tenant improvements or other capital expenditures out of operating cash flow. The forward-looking statements should be read in light of these factors and the factors identified in the “Risk Factors” included in the Company’s most recent Annual Report on Form 10-K, Quarterly Reports on Form 10-Q and other reports and information that it files with the Securities and Exchange Commission, or the SEC. The Company obtained the industry, market and competitive position data used in this presentation from (i) its own internal estimates and research of third-party company websites and other sources, (ii) industry and general publications and research or (iii) studies and surveys conducted by third parties. Such sources generally do not guarantee the accuracy or completeness of included information. While the Company believes that the information included in this presentation from such publications, research, studies, surveys and websites is reliable, it has not independently verified data from these third-party sources. While the Company believes its internal estimates and research are reliable, neither such estimates and research nor such definitions have been verified by any independent source. This presentation contains supplemental financial measures that are not calculated pursuant to U.S. generally accepted accounting principles, or GAAP, including EBITDA, FFO, FFO Core, and NOI. These non-GAAP measures are in addition to, not a substitute for or superior to, measures of financial performance prepared in accordance with GAAP. A reconciliation of non-GAAP measures to GAAP measures is contained in the Appendix to this presentation. Additional Information Whitestone REIT, its trustees and certain of its executive officers and Innisfree M&A Incorporated on their behalf may be deemed to be participants in the solicitation of proxies from Company shareholders in connection with the matters to be considered at the Company’s 2018 Annual Meeting. The Company intends to file a proxy statement and WHITE proxy card with the U.S. Securities and Exchange Commission (the “SEC”) in connection with any such solicitation of proxies from Company shareholders. COMPANY SHAREHOLDERS ARE STRONGLY ENCOURAGED TO READ THE PROXY STATEMENT AND ACCOMPANYING WHITE PROXY CARD WHEN THEY BECOME AVAILABLE AS THEY WILL CONTAIN IMPORTANT INFORMATION. Information regarding the ownership of the Company’s trustees and executive officers in Company common shares and other securities is included in their SEC filings on Forms 3, 4, and 5, which can be found through the Company’s website (www.whitestonereit.com) in the section “Investor Relations” or through the SEC’s website at www.sec.gov. Information can also be found in the Company’s other SEC filings, including the Company’s Annual Report on Form 10-K. More detailed and updated information regarding the identity of potential participants, and their direct or indirect interests, by security holdings or otherwise, will be set forth in the proxy statement and other materials to be filed with the SEC in connection with the Company’s 2018 Annual Meeting. Shareholders will be able to obtain any proxy statement, any amendments or supplements to the proxy statement and other documents filed by the Company with the SEC for no charge at the SEC’s website at www.sec.gov. Copies will also be available at no charge at the Company’s website at www.whitestonereit.com.
- 3. 3 Discussion Agenda PART I Executive Summary PART II WSR’s Stock and Operating Performance - Creating Long Term Shareholder Value and Providing Stable Income PART III WSR’s Consumer-Focused Business Model and Strategy - Executing Consistently PART IV Internal Management - Aligning Shareholder Interests with Management Compensation PART V WSR’s Board - Guiding by Experience and Diverse Perspectives
- 4. Long-Term Growth and Value-Added Investment Opportunity Maximizing Total Return to Shareholders with Significant Growth Community-Centered REIT With High Quality Properties in Affluent and High Growth Markets Consistent E-Commerce Resistant Strategy Providing Service-Based Retail and Necessities Total Shareholder Return has Outperformed Peers WSR has ranked #1 of 17, #2 of 17, and #4 of 15 over 1yr, 3yr, and 5yr periods, respectively, of the Publicly-Traded, US Shopping Center REITs (7) Solid Capital Structure Position the Company for Growth Experienced Real Estate Team Leading Internalized Management and Operations Increasing Occupancies, Rents, and Scalable Processes and Infrastructure The Right Board in Place – Expansive Public Co. Experience Coupled with Gender, Ethnic, Racial, Age, Cognitive, and Professional Diversity Working Together with a Common Purpose Real Estate * Law * Finance * Technology * Energy * Commodities * Government * Academia WSR’s Commitment to Corporate Governance and Transparency Enhancing and Expanding Governance and Shareholder Engagement 72 properties (2) 6.6 million GLA (2) 1,649 tenants (2) 90% occupancy (3) $18.84 ABR per sq. ft. (3)(4) +4.7% SS NOI Growth (3)(5) $530 million (Equity Market Cap) (6) $1.2 billion (Enterprise Value) (6) NYSE: WSR IPO - August 2010 (1) As of Sept 30, 2017 except where indicated. (2) Includes properties owned through Pillarstone Capital REIT Operating Partnership LP as of Sept 30, 2017. (3) Excludes properties owned through Pillarstone Capital REIT Operating Partnership LP as of Sept 30, 2017. (4) Annualized base rent (“ABR”) represents monthly base rent as of Sept 30, 2017 multiplied by 12. (5) Represents same store (“SS”) net operating income (“NOI”) growth for Q3-17 vs. Q3-16. (6) Calculated using closing price of WSR common shares on January 31, 2018 of $13.14 per share. (7) Whitestone REIT Total Shareholder Return as compared to its peers according to the SNL Public REIT Market Data based on closing prices on February 8, 2018. Peers include: Regency Centers Corp., Cedar Realty Trust Inc., Retail Opportunity Investments, Weingarten Realty Investors, Saul Centers Inc., Urban Edge Properties, Federal Realty Investment, Urstadt Biddle Properties Inc., Ramco-Gershenson Properties, Retail Properties of America, Kite Realty Group Trust, Acadia Realty Trust, Wheeler REIT Inc., Brixmor Property Group Inc., Kimco Realty Corp., and DDR Corp. Executive Summary: WSR - Unique Story and Opportunity 4 Portfolio Fast Facts (1) PART I
- 5. Creating Value: WSR Financial Highlights 5 25% growth in Revenue 44% growth in Net Income 17% growth in Net Income per Share 27% growth in NOI (1) 25% growth in FFO (2) 33% growth in FFO Core (2) 9% growth in FFO Core per Share(2) (1) The Company defines NOI as operating revenues (rental and other revenues) less property and related expenses (property operation and maintenance and real estate taxes). NOI is a non-GAAP measure. A reconciliation of non-GAAP measures to GAAP measures is contained in the Appendix to this presentation. (2) The Company defines FFO as defined by NAREIT, which states that FFO should represent net income available to common shareholders (computed in accordance with GAAP) excluding gains or losses from sales of operating assets, impairment charges and extraordinary items, plus depreciation and amortization of operating properties, including the Company's share of unconsolidated real estate joint ventures and partnerships. The Company defines FFO Core as FFO excluding certain non-cash and non-comparable items that affect the Company's period-over-period performance, including, but not limited to, legal settlements, non-cash share-based compensation expense, rent support agreement payments received from sellers on acquired assets and acquisition costs. FFO and FFO Core are non-GAAP measures. A reconciliation of non-GAAP measures to GAAP measures is contained in the Appendix to this presentation. (3) Whitestone REIT Total Shareholder Return as compared to its peers according to the SNL Public REIT Market Data based on closing prices on February 8, 2018. Peers include: Regency Centers Corp., Cedar Realty Trust Inc., Retail Opportunity Investments, Weingarten Realty Investors, Saul Centers Inc., Urban Edge Properties, Federal Realty Investment, Urstadt Biddle Properties Inc., Ramco-Gershenson Properties, Retail Properties of America, Kite Realty Group Trust, Acadia Realty Trust, Wheeler REIT Inc., Brixmor Property Group Inc., Kimco Realty Corp., and DDR Corp. (4) Timeframe Jan 1, 2011 through Dec 31, 2016. CAGR - Five Years Ended December 31, 2016(4) #1 of 17 over 1 year #2 of 17 over 3 years #4 of 15 over 5 years PART Il TSR Rank Amongst Public REIT Shopping Centers (3)
- 6. Creating Value: Proven Ability to Manage & S Sustain Growth 6 (1) Dollars in millions. 3Q17 times 4 for all except # of properties, # of tenants. Gross Leasable Area, and Gross Real Estate Assets which are as of Sept 30,2017. (2) Through 12/31/2017. 2010 IPO YEAR-END 2013 2017(ANNUALIZED)(1) Annual Net Income (millions) $1.1 $0.1 $9.0 Annual FFO Core (millions) $7.9 $20.8 $52.4 Annual NOI (millions) $19.3 $37.8 $89.5 Dividends Paid to Shareholders (millions) $7.4 $21.0 $43.8 # of Properties 37 60 72 # of Tenants 770 1,243 1,649 # of Employees 50 68 106 Gross Leasable Area 3,014,264 4,966,330 6,547,658 Gross Real Estate Assets (millions) $205.0 $546.3 $1,144.5 PART Il $181M in Total Dividends Paid to Shareholders Since Our August 2010 IPO(2)
- 7. Creating Value: Proven Track Record of Growth 7 Revenues Gross Assets Note: Dollars in millions, CAGR Timeframe Jan 1, 2011 through Dec 31,2016. $34.9 $46.6 $62.1 $72.4 $93.4 $104.4 $134.6 2011 2012 2013 2014 2015 2016 Q3-17 (A) PART Il $21.6 $28.2 $37.8 $47.2 $62.1 $70.3 $89.5 2011 2012 2013 2014 2015 2016 Q3-17 (A) NOI FFO Core / Share Note: Dollars in millions, CAGR Timeframe Jan 1, 2011 through Dec 31, 2016.
- 8. 8 PART IlCreating Value: Total Shareholder Return vs Peers (1) Despite Retail REIT Industry Headwinds (1) Source: SNL, as of January 31, 2018. Total shareholder return (TSR) is defined as the share price change plus the re-investment of dividends at the ex-dividend date. 100 80 60 40 20 0 20 40 60 80 100 ROIC BFS REG WSR FRT WRI UBA RPAI AKR RPT CDR KIM KRG DDR WHLR PercentageReturn(%) 15 Publicly Traded US Shopping Center REITS WSR #4 in Total Shareholder Return % - 5 Year WSR 50 40 30 20 10 0 10 WSR REG UBA ROIC BFS WRI FRT CDR RPT UE RPAI AKR KRG BRX KIM DDR WHLR PercentageReturn(%) 17 Publicly Traded US Shopping Center REITs WSR #1 in Total Shareholder Return % - 1 Year WSR 80 60 40 20 0 20 ROIC WSR BFS UE REG UBA WRI FRT RPAI RPT AKR KRG CDR BRX KIM DDR WHLR PercentageReturn(%) 17 Publicly Traded US Shopping Center REITs WSR #2 in Total Shareholder Return % - 3 Year WSR
- 9. FFO Core Executing Our Strategy: Stable and Predictable Improvement of Dividend Payout Ratio 9 PART III $0 $10 $20 $30 $40 $50 2011 2012 2013 2014 2015 2016 3Q17(A) Dividends ($ in millions) Since 2011 WSR has increased dividends and FFO Core while improving Dividend Payout Ratio Approximately $7 million of FFO Core in excess of dividends in 2016 Dividend / FFO Core Payout Ratio of 83% in 2016 Whitestone REIT has Paid a Consistent Dividend Per Share over 89 consecutive MONTHS since our IPO.
- 10. 0 2 4 6 8 Population in millions Executing Our Strategy: Focused on Business-Friendly States with High Growth Markets 27 Properties 44 Properties 6.6% 9.7% 8.6% 8.0% 9.7%Austin Phoenix San Antonio Houston Dallas-Fort Worth 10 Note: Portfolio includes 1 property in Chicago. (1) Source: The Atlantic CityLab 2013 to 2014. (2) Source: Claritas, as of April 2017. (3) As a percentage of portfolio NOI for quarter ended Sept 30, 2017. Amounts proforma for full quarter NOI from Q3-17 Acquisitions. Excludes 14 properties owned through Pillarstone Capital REIT Operating Partnership LP. 2017E MSA Population (mm) (2) % Growth ’17E - ’22E Net Total Migration (1) Phoenix 2016 and 2017 Acquisitions Existing Properties San Antonio Austin Geographic Exposure (3) +100,000 -100,000 +50,000 -50,000 +10,000 -10,000 PART IlI Houston
- 11. Executing Our Strategy: Business-Friendly, Attractive Demographics 11 AUSTIN #1 Next Biggest Boom Town (1) #1 Fastest Growing City in the U.S. for the 4th Consecutive Year (2) DALLAS #1 Top Real Estate Market for Investment in 2017(3) #1 Most Business Friendly City in America(4) #1 Great Cities for Starting a Business(5) PHOENIX #3 Largest Labor Pool in the West(6) #5 Fastest Growing Tech Market(7) SAN ANTONIO Top 10 Fastest Growing City(8) #8 Best Economic Climate(9) HOUSTON #1 in the world in GDP per capita(10) #1 Highest Starting Salaries in the US(11) The “Energy Capital of the World” also boasts the Largest Medical Center in the World(12) PART IlI (1) Source: HFF Market Overview, Forbes, 4Q17 (2) Source: HFF, Forbes, 4Q17 (3) Source: HFF, PwC, ULI, 4Q17 (4) Source: HFF, MarketWatch, 4Q17 (5) Source: HFF, Kiplinger, 4Q17 (6) Source: HFF, BLS January, 2018 (7) Source: HFF, Fortune November 2016 (8) Source: HFF, Forbes 2018 (9) Source: HFF, Forbes 2018 (10) Source: HFF, A.T. Kearney, January 2018 (11) Source: HFF, WalletHub 2018 (12) Source: HFF, Texas Medical Center 2018
- 12. Executing Our Strategy: Focus on the Consumer and the Disruption From E-Commerce 12Note: Definitions sourced from ULI PART IlI Neighborhood Shopping Centers Trade Area: 1 – 3 Mile Core tenants & Daily Convenience stores Community Shopping Centers Trade Area: 3 – 5 Mile Urban Lifestyle Centers Trade Area: 5 – 10 Mile Power Centers Trade Area: 10+ Mile Regional Centers/Malls Trade Area: 10+ Mile Big box & department stores w/ emphasis on hard goods Grocery anchored & Daily Convenience stores Grocery and destination stores Big box stores w/ emphasis on hard goods High High Low Low FrequencyofCustomerVisits % of Tenants Servicing Daily Necessities Resistant to E-Commerce Replaced by E-Commerce
- 13. Executing Our Strategy: Strong Household Income Leads to Greater Consumer Discretionary Spending(2) 13 (1) Source: S&P Global Market Nov 2017. (2) Retail portfolio only. Excludes properties owned through Pillarstone Capital REIT Operating Partnership LP. $94,232 $81,910 $80,950 $72,950 $67,297 $63,931 $60,049 $50,000 $60,000 $70,000 $80,000 $90,000 $100,000 FRT WSR REG KIM DDR WRI BRX MedianHouseholdIncome(3-mileradius)(1) Peer Average: $74,474 PART IlI
- 14. 5.1% 3.5% 3.3% 3.1% 2.8% 2.5% 2.0% WSR REG WRI FRT KIM BRX DDR Executing Our Strategy: Strong Internal Growth 14 Attractive Same-Store NOI Growth: Greater Consumer Spending on Services and Needs Increasing Occupancy: Entrepreneurial Tenants Locate Where Consumers Migrate Growing Rent Levels: From Shorter Term, Triple Net Rents with 2%-3% Annual Escalations Total Occupancy (2) ABR per Sq. Ft. (2) . (1) For WSR excludes investment in Pillarstone Capital REIT Operating Partnership LP. Source: company filings. (2) Occupancy and ABR per sq. ft. as of September 30, 2017. Excludes properties owned through Pillarstone Capital REIT Operating Partnership LP. SS NOI Growth Rate – 2016 YoY Growth Rates (1) 80.3% 90.1% 3Q10 3Q17 $10.43 $18.84 3Q10 3Q17 Peer Average 2.9% PART IlI
- 15. Shorter Term Leases Provide Opportunity to Increase ABR Per Sq. Ft. (1) Executing Our Strategy: Strong Growth with Moderate ABR vs. Peers 15 (1) ABR per Sq. Ft. for the portfolio as of Sept 30, 2017. Excludes properties owned through Pillarstone Capital REIT Operating Partnership LP. (2) Source: company filings. Community-Centered Service Properties Yield Higher ABR Per Sq. Ft. (2) Peer Average: $18.44 $26.72 $20.61 $18.84 $18.58 $16.16 $15.33 $13.28 $- $5.00 $10.00 $15.00 $20.00 $25.00 $30.00 FRT REG WSR WRI DDR KIM BRX $11.21 $12.21 $13.04 $14.82 $15.75 $17.33 $18.84 2011 2012 2013 2014 2015 2016 Q3-17 PART IlI
- 16. Executing Our Strategy: Long Term Plan LOWERING DEBT LEVERAGE SCALING G&A PART III 16 8.3x(1) 6x - 7x CURRENT 5 YEAR GOAL Debt / EBITDA Ratio 17%(2) 8%- 10% CURRENT 5 YEAR GOAL G&A / Revenue (1) As of September 30, 2017 . (2) For the quarter ended Sept 30, 2017.
- 17. 17 PART IIIExecuting Our Strategy: Long Term Plan Includes Growth of the Community, Tenants, Shareholders, and WSR Employees GO FOR GROWTH COMMUNITY BY DESIGN THRIVING COMMUNITIES LOCAL CONNECTION AND COMMERCE PLATFORM OF GROWTH FOR TENANTS PROVIDE AN OPPORTUNITY FOR GROWTH AND SUCCESS FOR OUR ENTREPRENEURIAL TENANTS GROWTH FOR OUR TEAM MEMBERS THE FOUNDATION OF STRATEGIC ADAPTABILITY VALUE FOR OUR SHAREHOLDERS VALUE-CREATING GROWTH PLANS OUR TENANTS WE SEE THE VALUE IN NURTURING ENTREPRENEURIAL BUSINESSES STIMULATE ECONOMIC GROWTH BY PROVIDING EMPLOYMENT OPPORTUNITIES OUR SHAREHOLDERS ALL ROADS LEAD TO OUR SHAREHOLDERS ALL TEAM MEMBERS ARE SHAREHOLDERS OUR TEAM MEMBERS PURPOSE IN THE WORK WE DO AND THE COMMUNITIES WE CREATE IN-HOUSE TRAINING PROGRAM AND FOCUS ON CONTINUED EDUCATION OUR COMMUNITIES WE DESIGN TO REFELECT THE SURROUNDING LIFESTYLES AND CULTURES UNIQUE APPROACH TO LOCAL TASTE
- 18. 18 PART IIIExecuting Our Strategy: Long Term Plans Include Embracing Environmental & Social Issues Diversity Highlights: Whitestone has 106 associates including native speakers of approximately 31 different languages/dialects Properties serve ethnic and multi-cultural groups in our communities Diversity is reflected on our Board of Trustees as we appointed three independent Trustees in 2017 – Nandita Berry, Najeeb Khan and David Taylor Diversity: A Key Component of our Success Committed to the Environment Climate Change Initiatives Include: Installation of LED lighting, energy-efficient equipment, and air filtration systems at redevelopment projects Evaluation and installation of re-charging stations for electric vehicles at select properties Establishment of recycling programs at both the property and tenant levels Creation of walking and bicycle paths from adjacent communities to minimize congestion and pollution from vehicle traffic
- 19. 19 Executing Our Strategy: Making Value-Add Opportunistic Investments PART IlI Embedded Value Through Future Development; Creating Favorable Unlevered IRR’s in the Mid-Teens(1) Village Square Development | Mesa, Arizona BLVD Development | Houston, Texas Purchased 2017 1.4 Acres of Entitled Development Land 137,000 Additional Square Feet of GLA 4.7 Acres of Entitled Development Land 200,000 Additional Square Feet of GLA Purchased 2013 (1) Estimates Projected Unlevered IRR over an eight year hold period, assuming 6% exit capitalization
- 20. Executing Our Strategy: Relative to Retail Peers - WSR has Limited Exposure to Retail Power Centers Disrupted by E-Commerce(1) 20 Source: Green Street Advisors (Nov 2017) and Company Filings. (1) Percentages shown represent percentage of total properties. WSR total properties include properties owned through Pillarstone Capital REIT Operating Partnership LP as of September 30, 2017. 1% 23% 44% 45% 46% 51% 86% 0% 10% 20% 30% 40% 50% 60% 70% 80% 90% 100% WSR REG FRT WRI BRX KIM DDR PercentofPowerCenters Power Center Exposure: 49% PART IlI Expected Future Competitive Advantage Strategic Focus on Consumer, not on National Retail Tenant Power Centers - Repositioning and Re-tenanting will be a costly drag on our peers for the foreseeable future. Minimal Exposure to Leases with Co-Tenancy Provisions – Strategically prevent clauses in tenant leases that transfer control of the real estate to the tenant, and restrict the owner from future growth.
- 21. 21 PART IIIExecuting Our Strategy: Potential Expansion Opportunities Potential Expansion Locations Florida Georgia North Carolina Tennessee Colorado Current Whitestone Markets Texas Arizona Business- Friendly States Rapidly Growing and Attractive Demographics TN NC GA TX AZ FL CO TN NC GA FL TX AZ
- 22. 22 Executive Compensation Is Aligned with Shareholder Interests 2017 NAMED EXECUTIVE OFFICER COMPENSATION CHANGES & UPDATES PART IV Long Term Equity Incentive Compensation • Shareholder Approved Plan of approximately 8.5% of shares outstanding, down from 12.5% previously • Elimination of reload feature • Reduced 2017 award fair values for the CEO and CFO by ~70% from the 2016 grant date fair value. • Adoption of relative Total Shareholder Return targets as the performance measure for 2017 grants (2017 – 2019 Relative TSR to Companies included in the SNL U.S. Shopping Center Index) Cash Compensation • No base salary increases in 2017 for CEO and CFO for the 4th consecutive year • In 2018 increasing CEO, CFO and other NEOs cash compensation from below market 25th percentile to 50th percentile. All NEO salaries increased by 2.3% in 2017 • No bonus payouts for CEO and CFO for the 4th consecutive year • Other NEOs each paid a minimal discretionary bonus of $5,000 Other Executive Compensation Best Practices • Use of independent compensation consultant • Shareholder engagement on compensation matters • Stock Ownership guidelines: 3-5x base salary for NEO’s • Stock Ownership is included as a portion of all Whitestone employee compensation Whitestone’s Compensation Policies are Aligned with Shareholders
- 23. 23 Whitestone’s Board - Guided by Perspectives of an Experienced and Diverse Board PART V 1. 6 of the 7 Trustees are Independent 2. The Board regularly evaluates composition and rotates its leadership of independent Trustee meetings 3. Board succession planning and provides industry experience, balance, and diversity 4. Board Committees are composed entirely of Independent Trustees 1. Trustees include current and former C Level executives and Trustees of other public companies 2. All Trustees have previous Board Experience and 4 of the 7 Trustees have served on other Public Company Boards 1. Trustees come from diverse professional backgrounds including Real Estate, Law, Finance, Technology, Energy, Commodities, Government, Military, and Academia 2. Trustees have a strong balance of real estate and public company leadership experience Board Independence Leadership Experience Diversity & Industry Knowledge Board has Strong Independence, Experience, and Industry Knowledge
- 24. 24 Board Member Real Estate Legal Finance / Accounting Technology Energy Commodities Academia Government / Regulatory Public Company Leadership Mr. James C. Mastandrea ● ● ● ● Mr. David F. Taylor ● ● Mr. Donald F. Keating ● ● ● ● Mr. Jack L. Mahaffey ● ● ● ● Mr. Najeeb Khan ● ● Ms. Nandita V. Berry ● ● ● ● ● Mr. Paul Lambert ● ● ● Cognitive Diversity of Whitestone’s Board PART V Whitestone’s Board - Guided by Perspectives of an Experienced and Diverse Board 7 of 7 Trustees with financing and accounting experience 6 of 7 Trustees are independent 4 of 7 Trustees added in the last five years
- 25. 25 Whitestone’s Board - Guided by Perspectives of an Experienced and Diverse Board PART V Recent Board Refreshment Offers New Perspectives Ms. Nandita V. Berry • Formerly the 109th Texas Secretary of State from January 2014 to February 2015 • Inducted into the Texas Women’s Hall of Fame in 2014 • Recognized as one of Houston’s Most Influential Women by Houston Woman Magazine • Previously served on the University of Houston System Board of Regents • Held Senior Counsel position at El Paso Energy Corporation • Previously served on the Board of the Houston Zoo, Inc., the South Asian Chamber of Commerce and the Community Family Center of Houston Mr. David F. Taylor • Chair of Locke Lord LLP, Partner since 1996 • Served as a corporate and securities attorney at Locke Lord LLP since 1989 • Former Managing Partner of the Houston office • Former Chair of the Finance Committee and Chair of the Capital Markets Section • Serves on the Board of Directors of the Greater Houston Partnership • Member and Past Chair of the Board of the Theatre Under The Stars Mr. Najeeb A. Khan • Founder, President and CEO of Interlogic Outsourcing, Inc. (“IOI”) • Served as Vice President of Commercial Services for Midwest Commerce Data Corporation • Served as Chairman and CEO of CNA UniSource from 1998 through 2001 • Currently a Director of 1st Source Bank, where he is a member of the audit committee and chairs the loan and fund committee • Previously a Trustee of Memorial Health Foundation, the Community Foundation of St. Joseph County, WNIT public television and Studebaker Museum NEWLY APPOINTED 2017 NEWLY APPOINTED 2017 NEWLY APPOINTED 2017
- 26. 26 PART VWhitestone’s Board - Guided by Perspectives of an Experienced and Diverse Board Mr. James C. Mastandrea • Chairman and CEO of WSR since Oct. 2006 • 35 years experience in the real estate industry • 19 years serving as Chairman and CEO of publicly traded companies. • Currently an Adjunct Professor at Rice University • Regularly lectures to MBA students at the University of Chicago • 2017 Recipient EY Entrepreneur of the Year – Transformational CEO Award Mr. Jack L. Mahaffey • Former President and CEO of Shell Mining Company (NYSE) • Former Board Member of the National Coal Association • Former Board Member of the National Coal Council • Served in an Officer the United States Air Force Mr. Paul Lambert • Since 1995, CEO of Lambert Capital Corporation, a private real estate investment company • Co-Founded, Served on the Board of Directors and was the COO of First Industrial Realty Trust, Inc. (NYSE: FR) from its IPO • Since 1998, Trustee of Pillarstone Capital REIT (OTC: PLRE) Mr. Donald Keating • Former CFO of Shell Mining Company • Provided Consulting Services from 1992-2002 to Shell Oil Company (NYSE) following retirement • Former Board Member of Billiton Metals Company • Former Board Member of R & F Coal Company • Former Board Member of Marrowbone Coal Company . Ms. Nandita V. Berry • Brings Governmental, Legal, and Academic Expertise to the Board • Formerly the 109th Texas Secretary of State from January 2014 to February 2015. • Previously served on the University of Houston System Board of Regents • Held Senior Counsel Position at Locke Lord LLP • Previously served on the Board of the Houston Zoo, Inc., the South Asian Chamber of Commerce and the Community Family Center of Houston Mr. Najeeb A. Khan • Brings Technology, Investment and Auditing Skills to the Board • Founder, President and CEO of Interlogic Outsourcing, Inc. (“IOI”) • Served as Chairman and CEO of CNA UniSource from 1998 through 2001 • Currently a Director of 1st Source Bank, where he is a member of the audit committee and chairs the loan and fund committee Mr. David F. Taylor • Brings Corporate and Securities Law Experience to the Board • Currently Chair of Locke Lord LLP, Partner since 1996 • Serves on the Board of Directors of the Greater Houston Partnership • Former Chair of the Finance Committee and Chair of the Capital Markets Section Experienced Perspectives New Perspectives
- 27. 27 Whitestone’s Board - Guided by Perspectives of an Experienced and Diverse Board PART V Whitestone Employs a Proactive Approach to Enhancing its Board and Management Team Whitestone has been focused on enhancing its Board and management team to continue to deliver value to shareholders Proactively reduced the average age of independent Trustees from 73 in December of 2016 to 68 in January of 2018(1) Proactively reduced the average tenure of independent Trustees from approximately 5 years, 8 months in December of 2016 to approximately 3 years, 11 months in January of 2018(1) Whitestone’s Board evaluation and nomination processes regularly bring new expertise, relevant skills and unconflicted perspectives to our Board 43% of our independent Trustees have been recently added in 2017 New Trustees are strategically identified to add relevant skills, experience and fresh perspectives to the Board as a whole Appointed new Chairs of our Compensation Committee and our Nominating and Governance Committee Whitestone is committed to taking a proactive approach to Trustee succession and strengthen our Board and committees Share Ownership Guidelines for Executives and Trustees adopted in 2017 Whitestone adopted annual frequency of “say-on-pay” vote beginning at the 2018 annual meeting (1) – Date range from December 31, 2016 to January 31, 2018
- 28. 28 Whitestone’s Board - Guided by Perspectives of an Experienced and Diverse Board PART V Increased Board Size: From 6 to 7 Trustees Board Composition and Refreshment: Added 3 New Trustees, Improved Diversity Adopted Stock Ownership Guidelines: Set/Increased Minimum for All Trustees and Officers: CEO: 5x Salary, Other NEO’s: 3x Salary, Trustees: 5x Cash Retainer Shareholder Outreach: Board Advised Management to Solicit Feedback from Shareholders re: Say-on-Pay Executive Compensation: Hired 3rd Party Consultant, Modified Executive Compensation Investment Discipline: Instituted Investment Committee/Financial Authority Guidelines Corporate Governance Improvements
- 29. Conclusion 29 PART V WSR’s STRATEGY HAS DELIVERED LONG-TERM GROWTH AND INDUSTRY-LEADING RETURNS WSR’s BOARD OFFERS THE RIGHT BALANCE OF EXPERIENCE, DIVERSITY, SKILLS AND PERPECTIVES WSR HAS A STRONG BALANCE SHEET AND CAPITAL STRUCTURE TO CAPTURE GROWTH AND FUTURE MARKET OPPORTUNITIES
- 30. Appendix 30
- 31. Creating Value: Acquisition Activity Robust with Well Timed Capital Whitestone continues to make acquisitions in its core markets Expanding footprint yielding cost synergies at the corporate level Market share gains driving pricing power at the leasing level APPENDIX: PART Il 31
- 32. Executing Our Strategy: Identified Disruption in the Retail Landscape BOOMERS Time Constrained Consumers = Demand Greater Convenience Spending Growth on Services Downsizing Living Space Flows through to Downsizing in Retail MILLENNIALS Lifestyle Revolves Around Mobility and Flexibility Comfortable with the Sharing/Smaller Space Economy Need for Connection is Stronger Changing the Demand for Purchasing Soft and Hard Goods DUAL INCOME HOUSEHOLDS More Profound Impact on Household Spending Entertaining More Outside the Smaller Home Experiential Dynamic of Consumption has Increased AMAZON Dominates the Purchase and Delivery of Hard and Soft Goods Expanding their Delivery of Need-Based Items with the Purchase of Whole Foods APPENDIX: PART IlI 32
- 33. 1) Assumes 8 year hold period; leases in place; 2-3% annual increases in rent and expenses; and improvement of 50-100bps in exit cap rates from initial cap rate. 2) The 19 properties include: Heritage Trace Plaza, The Strand at Huebner Oaks, The Promenade at Fulton Ranch, Fulton Ranch Towne Center, Fulton Ranch TC Hard Corner, Williams Trace Plaza, The Shops at Williams Trace, Dana Park Pad, City View Village, Davenport Village, Parkside Village South, Parkside Village North, Gilbert Hard Corner, Quinlan Crossing, Keller Place, La Mirada, Scottsdale Seville, BLVD Place and Eldorado Plaza Executing Our Strategy: Selectively Acquired Targeted Properties 19 Closed Unlevered Expected Project Internal Rate of Return of 15%(1) 1,626 Transactions Pass Initial Triage • Business-friendly states • Local • Community-centered • Service-focused 271 Underwritten • Dense populated Sunbelt • Generally 50k – 200k RSF, sometimes larger 43 Offers Made • Attractive price • Value-add opportunities (excess land /new pads) • Potential for service- based tenant mix • Potential for lease normalization • Target unlevered IRR above cost of capital • Acquired 19 properties from 2014(2) to 2017 • Total Purchase Price $560M • Total GLA of 1.8m square feet APPENDIX: PART IlI 33
- 34. Services & Entertainment… Dining 22% Specialty Retail 17% Health & Wellness 16% Grocery 11% Education 6% Executing Our Strategy: Capitalized on the Disruption in the Retail Industry. Focused on Local Services & Experiences Complemented by Brands You Know & Trust 85% SERVICE-BASED AND OPTIMIZED TENANT COMPOSITION 15% 13% 12% 5% 32% 23% Only two tenants with more than 2% ABR Safeway (2.5%) Whole Foods (2.1%) Diverse, Ecommerce-Resistant Tenant Base (1) (1) As of Sept 30, 2017. Excludes properties owned through Pillarstone Capital REIT Operating Partnership LP. APPENDIX: PART IlI 34
- 35. Executing Our Strategy: Attractive Demographic Drivers vs. Peers Source: Bank of America Research May 2016. Highly Educated Workforce. High Household Income. Strong Population Growth. APPENDIX: PART IlI 35
- 36. Leasing Activity and Spreads (1) (Sq. Ft. in 000’s) Upcoming Lease Expirations (Sq. Ft. in 000’s) Executing Our Strategy: Strong Leasing Activity . (1) Annual leasing spread represents the year-over-year percentage increase in contractual rent per square foot for lease renewals and new leases executed during the trailing twelve months for the respective period. (2) Includes properties owned through Pillarstone Capital REIT Operating Partnership LP. +2.1% +9.4%+2.0% +7.9% +8.2% (1) (1) − Weighted Average Remaining Lease Term: 4.2 Years − Potential to capture growth from below market leases Executed Leases – Sq. Ft. (New and Renewal) (2) Expiring Leases – Sq. Ft. (2) +7.6% 685 835 862 966 1,121 727 2012 2013 2014 2015 2016 9ME Q3-17 APPENDIX: PART IlI 36
- 37. Executing Our Strategy: Proven Track Record of Increasing Yield on Cost Acquisitions from 2010 to 2013 have improved yields by 168bps on average Potential to improve yields on more recent acquisitions (2014 – 2017) Number of GLA Sq. Ft. in Yield on Total Cost Acquisitions (000's) Initial(1) Current(2) Change (bps) 2010/2011 10 596 7.1% 8.9% +178 bps 2012 5 675 7.2% 9.5% +237 bps 2013 6 690 7.2% 7.9% +67 bps '10-'13 Total / W.A.(3) 21 1,961 7.2% 8.7% +154 bps Number of GLA Sq. Ft. in Yield on Total Cost Acquisitions (000's) Initial(1) Current(2) Change (bps) 2014 8 631 7.5% 7.5% - bps 2015 7 482 6.7% 5.9% - 76 bps '14-'17 Total / W.A.(3) 19 1,789 6.8% 6.9% +14bps 2016/2017 4 676 6.5% 7.2% +72 bps Source: Company management. (1) Initial yield calculated using NOI for an 8 year hold period; leases in place;2-3% annual increases in rent and expenses; and an improvement of 50-100bps in exit cap rate from initial cap rate. (2) Current yield defined as Q3 ‘17 property-level NOI annualized divided by gross book value of real estate assets, undepreciated as of September 30, 2017. (3) Weighted average calculated based on gross invested capital (purchase price plus additional investment). APPENDIX: PART IlI 37
- 38. 24% 19% 39% 16% 1% 33% 3% 53% 11% Equity - Retail Investors Equity - Institutional Investors Unsecured Debt Mortgage Debt Non-Controlling Interest 18% 28% 34% $191.4M ENTERPRISE VALUE $1.25B ENTERPRISE VALUE IPO 2010 CURRENT(1) 19% (1) As of January 31, 2018. APPENDIX: PART IlI EXECUTING OUR STRATEGY Optimizing Our Capital Structure • EV +6x • More Stable Capital Structure • Institutional Quality Balance Sheet 38
- 39. Appendix: FFO (1) And FFO CORE (2) Reconciliation (1) FFO: Management believes that FFO is a useful measure of the Company's operating performance. The Company computes FFO as defined by NAREIT, which states that FFO should represent net income available to common shareholders (computed in accordance with GAAP) excluding gains or losses from sales of operating assets, impairment charges and extraordinary items, plus depreciation and amortization of operating properties, including the Company's share of unconsolidated real estate joint ventures and partnerships. FFO does not represent cash flows from operating activities determined in accordance with GAAP and should not be considered an alternative to net income as an indication of the Company's performance or to cash flow from operations as a measure of liquidity or ability to make distributions and service debt. Management considers FFO a useful additional measure of performance for an equity REIT because it facilitates an understanding of the operating performance of its properties without giving effect to real estate depreciation and amortization, which assumes that the value of real estate assets diminishes predictably over time. Since real estate values have historically risen or fallen with market conditions, management believes that FFO provides a more meaningful and accurate indication of the Company's performance and useful information for the investment community to compare Whitestone to other REITs since FFO is generally recognized as the industry standard for reporting the operations of REITs. Other REITs may use different methodologies for calculating FFO, and accordingly, the Company's FFO may not be comparable to other REITs. The Company presents FFO per diluted share calculations that are based on the outstanding dilutive common shares plus the outstanding OP units for the periods presented. (2) FFO Core: Management believes that the computation of FFO in accordance with NAREIT's definition includes certain non-cash and non-comparable items that affect the Company's period-over-period performance. These items include, but are not limited to, legal settlements, non-cash share-based compensation expense, rent support agreement payments received from sellers on acquired assets and acquisition costs. In addition, the Company believes that FFO Core is a useful supplemental measure for the investing community to use in comparing the Company to other REITs as many REITs provide some form of adjusted or modified FFO. However, other REITs may use different adjustments, and the Company's FFO Core may not be comparable to the adjusted or modified FFO of other REITs. (In Millions) 39 Net income attributable to Whitestone REIT $ 1.1 $ 1.1 $ 0.1 $ 3.8 $ 7.5 $ 6.7 $ 7.9 $ 3.0 $ 6.4 Depreciation and amortization of real estate assets 6.7 7.6 10.1 13.3 16.0 19.7 22.2 7.0 19.3 (Gain) loss on sale or disposal of assets and properties 0.1 (0.2) 0.1 0.1 (1.8) 0.2 (3.3) 0.1 Net income attributable to nonconrolling interests 0.5 0.2 - 0.1 0.2 0.1 0.2 0.1 0.2 FFO $ 8.4 $ 8.7 $ 10.3 $ 17.3 $ 21.9 $ 26.7 $ 27.0 $ 10.1 $ 26.0 Rent support agreement - - - 0.2 0.2 - - - - Relocation agreement - - 2.2 - - - - - - Gain on insurance company settlement (0.6) - - - - - - - - Non cash share-based compensation - - - 2.3 4.7 7.4 10.2 2.7 7.5 Legal settlement - 0.2 (0.2) - - - - - - Acquisition costs 0.1 0.7 0.7 1.0 1.4 1.7 2.1 0.3 1.4 FFO Core $ 7.9 $ 9.6 $ 13.0 $ 20.8 $ 28.2 $ 35.8 $ 39.4 $ 13.1 $ 34.9
- 40. Appendix: NOI Reconciliation (1) (1) NOI: Management believes that NOI is a useful measure of the Company's property operating performance. The Company defines NOI as operating revenues (rental and other revenues) less property and related expenses (property operation and maintenance, insurance and real estate taxes). Because NOI excludes general and administrative expenses, depreciation and amortization, involuntary conversion, interest expense, interest income, provision for income taxes, gain or loss on sale or disposition of assets and capital expenditures and leasing costs, it provides a performance measure that, when compared year over year, reflects the revenues and expenses directly associated with owning and operating commercial real estate properties and the impact to operations from trends in occupancy rates, rental rates and operating costs, providing perspective not immediately apparent from net income. The Company uses NOI to evaluate its operating performance since NOI allows the Company to evaluate the impact of factors, such as occupancy levels, lease structure, lease rates and tenant base, have on the Company's results, margins and returns. In addition, management believes that NOI provides useful information to the investment community about the Company's property and operating performance when compared to other REITs since NOI is generally recognized as a standard measure of property performance in the real estate industry. However, NOI should not be viewed as a measure of the Company's overall financial performance since it does not reflect general and administrative expenses, depreciation and amortization, involuntary conversion, interest expense, interest income, provision for income taxes, gain or loss on sale or disposition of assets, and the level of capital expenditures and leasing costs necessary to maintain the operating performance of the Company's properties. Other REITs may use different methodologies for calculating NOI, and accordingly, the Company's NOI may not be comparable to that of other REITs. (In Millions) 2010 2011 2012 2013 2014 2015 2016 Q3-17 9ME Q3-17 Net income attributable to Whitestone REIT $ 1.1 $ 1.1 $ 0.1 $ 3.9 $ 7.6 $ 6.7 $ 7.9 $ 3.0 $ 6.4 General and Administrative Expenses 5.0 6.7 7.6 10.9 15.3 20.3 23.9 5.6 17.6 Depreciation and amortization 6.8 7.8 10.2 13.1 15.7 19.8 22.5 7.3 20.0 Involuntary Conversion (0.6) - - - - - - - - Executive Relocation Expense - - 2.2 - - - - - - Interest expense 6.0 6.4 8.7 10.0 10.6 14.9 19.2 6.4 17.2 Interest, dividend and other investment income - (0.5) (0.3) (0.2) (0.1) (0.3) (0.4) (0.1) (0.4) Provision for income taxes 0.3 0.2 0.3 0.3 0.3 0.4 0.3 0.1 0.3 (Gain) loss on sale or disposal of assets and properties 0.2 (0.3) 0.1 - 0.1 0.2 (3.3) - 0.1 Income from discontinued operations - - - (0.3) (0.5) - - - - Gain on sale of property from discontinued operations - - - - (1.9) - - - - Net income attributable to nonconrolling interests 0.5 0.2 - 0.1 0.1 0.1 0.2 0.1 0.4 NOI $ 19.3 $ 21.6 $ 28.9 $ 37.8 $ 47.2 $ 62.1 $ 70.3 $ 22.4 $ 61.6 40
- 41. Appendix: EBITDA (1) Reconciliation (1) EBITDA: Management believes that EBITDA is an appropriate supplemental measure of operating performance to net income attributable to the Company. The Company defines EBITDA as operating revenues (rental and other revenues) less property and related expenses (property operation and maintenance, insurance and real estate taxes) and general and administrative expenses. Management believes that EBITDA provides useful information to the investment community about the Company's operating performance when compared to other REITs since EBITDA is generally recognized as a standard measure. However, EBITDA should not be viewed as a measure of the Company's overall financial performance since it does not reflect depreciation and amortization, involuntary conversion, interest expense, provision for income taxes, gain or loss on sale or disposition of assets, and the level of capital expenditures and leasing costs necessary to maintain the operating performance of the Company's properties. Other REITs may use different methodologies for calculating EBITDA and, accordingly, the Company's EBITDA may not be comparable to other REITs. (In Millions) 41 2010 2011 2012 2013 2014 2015 2016 Q3-17 9ME Q3-17 Net income attributable to Whitestone REIT $ 1.1 $ 1.1 $ 0.1 $ 3.8 $ 7.6 $ 6.7 $ 7.9 $ 3.0 $ 6.4 Depreciation and amortization 6.8 7.8 10.2 13.4 16.0 19.8 22.5 7.3 20.0 Involuntary Conversion (0.6) - - - - - - - - Executive Relocation Expense - - 2.2 - - - - - - Interest expense 6.0 6.4 8.7 10.2 10.6 14.9 19.2 6.4 17.2 Provision for income taxes 0.3 0.2 0.3 0.3 0.3 0.4 0.3 0.1 0.3 (Gain) loss on sale or disposal of assets and properties 0.2 0.1 0.1 0.1 (1.8) 0.2 (3.3) - 0.1 Net income attributable to nonconrolling interests 0.5 0.2 - 0.1 0.2 0.1 0.2 0.1 0.4 EBITDA $ 14.3 $ 15.8 $ 21.6 $ 27.9 $ 32.9 $ 42.1 $ 46.8 $ 16.9 $ 44.4