
Recommended
More Related Content
Recently uploaded
Recently uploaded (20)
Featured
Featured (20)
SyREcuse_REsearch
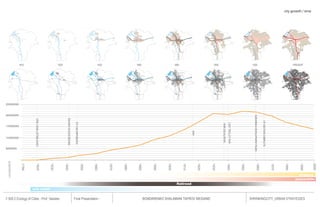
- 1. city growth / time 1810 1820 1830 1840 1850 1900 1930 PRESENT 250000 200000 SUBURBAN DEVELOPMENT PEAKS RAILWAY ACCESS BEGINS ERIE CANAL ESTABLISHED I-81 SECTION COMPLETE CITY INCORPORATED LAST TROLLEY RUN WWII ESCALATION 150000 WWI 100000 50000 population 1788 1825 1830 1840 1850 1860 1870 1880 1885 1890 1900 1910 1920 1930 1940 1950 1960 1970 1980 1990 2000 airplane automobile Railroad erie canal // 500.2 Ecology of Cities - Prof. Vassilev Final Presentation - BONDARENKO SHALAMIAN TAFROV WEIGAND SHRINKINGCITY_URBAN STRATEGIES
- 2. suburbanization LAND USE IN THE CITY OF SYRACUSE HAS A DIRECT RELATIONSHIP TO TRANSPORTATION; THIS ARRANGEMENT IS ROOTED IN THE HISTORICAL INDUSTRIAL NATURE OF THE CITY AND ALSO IN THE EARLY 20TH CENTURY PLANNING PRACTICES WHICH SHAPED THE CITY IN THE POST WAR ERA. COMMERICAL ENTITIES CLUSTER AROUND MAJOR THOROUGHFARES, ENSURING ACCESS BY AUTOMOBILE, AND THE STREETS BEST DEVELOPED TO THE NEW SCALE OF THE CITY CARRY THE MOST TRAFFIC EVERY DAY. THIS STRUCTURAL ALLOCATION OF LAND USE IS A LAYERING OF HISTORICAL SYSTEMS; HOWEVER IN THE CASE OF SYRACUSE; THE CENTRAL NATURE OF TRANSPORT COMBINE D WITH RAPID arterial roads + business housing types SUBURBANIZATION FOLOWING WW2 industrial appartment CREATED A FRAMEWORK FOR A commercial multiple residence parking single family COMMUTER-CITY, WHICH LED TO A DEARTH three family OF NON-WORK RELATED ACTIVITIES IN THE interstates two family arterials CITY CORE; CONTRIBUTING TO A GREATER SOCIAL / ECONOMIC / ETC PROBLEM AT THE CITY SCALE. 1943 Existing Land Use 1951 -1957 Development 1943 -1951 Development 1957 -1965 Development 1965 -1969 Development Residential Residential Residential Commercial Residential Residential Commercial Commercial Commercial Commercial Industrial Industrial Industrial Previously Industrial Industrial Previously Developed Previously Previously Developed Developed Developed // 500.2 Ecology of Cities - Prof. Vassilev Final Presentation - BONDARENKO SHALAMIAN TAFROV WEIGAND SHRINKINGCITY_URBAN STRATEGIES
- 3. walkability - drive up? ONE ISSUE WHICH SYRACUSE FACES IN THE CURRENT DAY IS THE WAY IN WHICH BARRIERS – REAL AND PERCEIVED, HAVE DIVIDED THE CITY INTO RELATIVELY ISOLATED NEIGHBORHOODS AND AREAS IN TERMS OF PEDESTRIAN ACCESS. THESE BARRIERS FRAGMENT THE CITY, CONTRIBUTING TO THE LOW WALKABILITY OF THE CITY (OR THE AVAILABILITY OF THE NECESSITIES OF DAILY LIVE WITHIN A COMFORTABLE 15 MINUTE WALK – APPROXIMATELY ONE MILE) – A CONDITION AGGRAVATED BY COLD WINTER WEATHER. THE SOLUTION TO THE FRAGMENTED NATURE OF THE CITY IS THE AUTOMOBILE – AND AS SUCH, THE CITY, EVEN THE DENSEST AREAS OF THE DOWNTOWN, IS PLAGUED BY THE SUBURBAN NECESSITY OF OWNING AN AUTOMOBILE OR RELYING HEAVILY ON BUS TRANSPORTATION IN ORDER TO CARRY OUT DAILY TRANSACTIONS. THESE BARRIERS INCLUDE ONONDAGA CREEK, I-81, I-690, RAIL LINES, WEST STREET, ERIE BOULEVARD, ETC. SOME OF THE PERCEIVED BARRIERS ARE ALSO THE IMAGES THAT CERTAIN AREAS HAVE BEEN BURDENED WITH, OR THE INACCESSIBILITY OF THE DOWNTOWN / WEST SIDE FROM UNIVERSITY HILL. WHILE OTHER CITIES HAVE SIMILAR ISSUES (I.E. NYC, WITH MANHATTAN, WITH LIMITED ACCESSIBILITY), SYRACUSE’S RELATIVELY LOW DENSITY ALLOWS IT TO SIDESTEP THESE BARRIERS WITH OUTWARD; RATHER THAN CONNECTIVE DEVELOPMENT. THIS OUTWARD DEVELOPMENT FURTHER REDUCES DENSITY, AND INCREASES DEPENDENCE ON THE AUTOMOBILE DUE TO THE DECENTRALIZED ARRANGEMENT OF LAND USES. WHEREAS IN THE EARLY 1900S PEOPLE LIVED, WORKED, AND PLAYED IN PROXIMITY TO THE CITY CORE, THIS LIFESTYLE TODAY IS LIVED ONLY BY THOSE WHO CANNOT AFFORD TO, OR CHOOSE NOT TO OWN AUTOS. THE DOWNTOWN AREA, HOWEVER – ONCE YOU PARK YOUR CAR FOR A WEEKEND JAUNT OR BUSINESS ACTIVITY; IS A VERY WALKABLE AREA, AS ARE CERTAIN STREET BASED 1 mi STRIPS – SALINA, GENESEE, FAYETTE, GEDDES, LODI, BUTTERNUT, INNER JAMES – CERTAIN AREAS ON THESE STREETS PREFERENCE WALKING DUE TO CONCENTRATIONS OF 1/2 mi COMMERCIAL / MIXED ACTIVITIES. HOWEVER, THESE STRIPS ARE CONTESTED BY THE 1/4 mi DRAW FROM MORE AUTO CENTRIC AREAS SUCH AS ERIE BOULEVARD, CAROUSEL CENTER, AND SHOPPINGTOWN MALL. Apartment Multiple Residenc Three Family e Two Family Single Family // 500.2 Ecology of Cities - Prof. Vassilev Final Presentation - BONDARENKO SHALAMIAN TAFROV WEIGAND SHRINKINGCITY_URBAN STRATEGIES
- 4. food access / systems A food system is the production, processing, distribution, sale, purchase, preperation, consumption and disposal of food products. Supermarkets- Market share Wegmans-37% P&C-20% Price Chopper-12% Real food co-op- N/A Farmers Markets- N/A Local markets -Camillus Farmers' Market C.L Evers Market Sponsor: Camillus Town Clerk’s Office Location: Municipal Building, 4600 W. Genesee St., Syracuse, NY Central New York Regional Market Sponsor: Central New York Regional Market Authority Location: 2100 Park Street, I-81 exit 23, Syracuse, NY Downtown Syracuse Farmers' Market Sponsor: Downtown Committee of Syracuse, Inc. Location: Parking lot at S. Salina & Washington Sts., Syracuse, NY University Community Harvest Farmers' Market (SU) Sponsor: Syracuse University and the SUNY College of Environmental Science & Forestry Green Hills Farmers' Market Location: Green Hills supermarket, north parking lot, 5933 S. Salina St, Syracuse Manlius Farmers' Market Sponsor: Village of Manlius Location: Behind Sno-Top, off Arkie Albanese Avenue Syracuse Eastside Neighborhood Farmers' Market Sponsor: Westcott Community Center Location: Loguen Park at Lexington Ave. // 500.2 Ecology of Cities - Prof. Vassilev Final Presentation - BONDARENKO SHALAMIAN TAFROV WEIGAND SHRINKINGCITY_URBAN STRATEGIES
- 5. local food supply Syracuse Real Food Co-op Located in the Westcott neighborhood in the unversity neighborhood. the syracuse real food Co-op is owned by over 2,600 members. Open to anyone to shop at. -Began operations in 1972- “Westcott nation” founders. Anti-war activists wanting a cooperatively-owned community. Inexpensive, local, high-quality. Support local growers. Grindstone Farm- Pulaski, NY -Stock -Organic local produce, organic grass fed meats, Dairy products, Forzen foods, Fresh Bread, Cheese, Wild seafood. 50 mile radius -Sources Monarch Farm - Skaneateles, New York Salad Greens, Heirloom vegetables, Tomatoes Frosty Morning Farm - Truxton, New York Potatoes, garlic, herbs, salves, lotions and goat milk. Two Heats Farm- Morrisville, NY Grindstone Farm - Pulaskai, New York Organic Vegetables Green Rabbit Farm- Madison, NY Black Brook Farm - Skaneatelas, New York Monarch Farm - Skaneateles, New York Heirloom fruits, vegetables, beans, apples, potatoes, squash. Brook Farm - Skaneateles, New York Frosty Morning Farm - Truxton, New York Lively Run Goat Dairy- Interlaken, NY Reeves Farm - Baldwinsville, New York Strawberries, Blueberries Sacred Seed Farm- Cortland, NY Gillie Farm - Baldwinsville, New York Garlic Sacred Seed Farm - Central New York Vegetables, Garlic, Carrot Two Hearts Farm - Morrisville, NY Principles of a Co- op Eggs 1.Open and Voluntary membership Green Rabbit Farm - Madison, NY 2. Democratic member control High quality produce 3. Member Economic Participation 4. Autonomy and Independence Lively Run Goat Dairy - Interlaken, NY 5. Education training Information Goat milk, cheese 6. Cooperation Among Cooperatives 7. Concern for Community. // 500.2 Ecology of Cities - Prof. Vassilev Final Presentation - BONDARENKO SHALAMIAN TAFROV WEIGAND SHRINKINGCITY_URBAN STRATEGIES
- 6. research regional food supply Onondaga County MILK: Cows & Production Average Annual Avg. Total M ilk 2003 156,100 acres of farm land 31% of total 499,388 acres Year M ilk Cows Production Per Production Cow 720 farms - 217 acrese per farm No. Head Pounds Million lbs. Ranks 20th in state for number of farms 1940 N/A N/A N/A 1950 N/A N/A N/A 1959 N/A N/A N/A Total market value of agricultural products $82.2 Million 1969 N/A N/A N/A $113,330 per farm 1978 1982 16,100 19,000 13,200 12,500 213 238 1987 18,500 14,000 259 1992 17,000 16,000 272 Products sold: 1997 17,500 16,800 294 Diary 1998 1999 18,000 18,500 17,100 17,400 308 322 Poulty/ eggs 2000 18,500 17,500 324 2001 18,900 19,000 360 grains / dry beans 2002 18,900 19,000 360 vegetable 2003 2004 18,100 N/A 19,800 N/A 358 N/A Nursery/ greenhouse 1940-1969 U.S. Census of Agriculture Value of farms average- $355,435 Machinery- $127,518 Development threatening Farmland in New York State Production expenses $77.8 million $106,904 per farm Household income- $40,847 NY State has over 3.15 million HA of agricultural land cover. -Soil prone to erosion -2/3 of land devoted to perennial forage crops - 1/3 high value crop production Agricultural Districts- Onondaga County Land In Farms Regional food production is seasonal and cities rely on year (Acres) Production round production sources for produce. California, Florida, Nursery/ Greenhouses etc. Other Dairy Poulty/ Eggs Grains/ Dry Beans Vegetables // 500.2 Ecology of Cities - Prof. Vassilev Final Presentation - BONDARENKO SHALAMIAN TAFROV WEIGAND SHRINKINGCITY_URBAN STRATEGIES
- 7. global food supply The Food Supply Chain - General Global Food Chain Wheat Food Chain Imports Transport Transport Farm Inputs Processing/ Carbon Footprint Seed Merchants Agro-chemicals Farm Inputs Machinery etc Farm Supplier Farming Farming Farms growing wheat Livestock Farms Farm Logistics (Agricultural) Grain Merchants Grain Co-operatives Logistics (Agricultural) Marketer Manufacturing Manufacturing Flour Mills Flour Mills Processor Wheat Feed Logistics (Food) Plant Baker / Feed Mills Wholesaler / Distributor Food Processor Logistics (Food) Retail / Catering Retailer Supermarket RDCs General Wholesalers Catering Suppliers Caterer Retail / Catering Supermarkets independent Retailers Craft Bakers Caterers Consumer Consumer Consumer Consumers Exports Employment- Syracuse P&C- 8th Largest Employer in Syracuse Wegmans-3rd largest employer in Syracuse Wegmans Food Marketsseven major suppliers -- Coca-Cola Co., General Mills, Hershey Co., J.M. Smucker Co., Nestle, PepsiCo, Inc. and Procter & Gamble Co. - 3rd largest employer in Syracuse- 3,760 // 500.2 Ecology of Cities - Prof. Vassilev Final Presentation - BONDARENKO SHALAMIAN TAFROV WEIGAND SHRINKINGCITY_URBAN STRATEGIES
- 8. Global imports- 3000 miles+ global food supply research Wholesale/retail (refrigeration. electricity for store) 1 x 17 transport( farm to consumer) Carbon Footprint Food production CSA footprtint conventional food systems footprint -1 food mile equal to the distance food travels from where it is grown to where it is consumed - Weighted Average Source Distance (WASD) used to calculate a the distance and amount of food product. Tons of CO2 Tons of CO2 from methane - Community Supported Agriculture Vs. Conventional methods of food transportation tons of CO2 from Nitrous Oxide The formula for WASD is: Σ (m(k) x d(k))/ Σ m(k) where: Syracuse Banana Company- Global- Re- k = different locations of the production origin, m = amount consumed from each location of consumption origin, and gional- Local Ro d = distances from the locations of production origin to the point of consump- che NY -One of the largest food distributes in the area. ste , tion. r, N me -Fully refrigerated 35,000 square foot, state of the art Y Ro facility Our food is shipped via mulitple transportation methods to get to its final Buffalo, NY - Supplies institutions, restaurants, over 500 customers destination crossing thousands of miles. This will not change until fuels and means of transport become more and more expensive. - Operate 23 delivery trucks (16-24 Ft. insulated, refrigerated). 150 mile radius - Production of food is also a major contributer to carbon footprint, agriculural Regional- Syracuse Banana Distribution -Our delivery trucks circulate within a 150 mile radius of waste and processing . Syracuse, NY. This includes Rochester/Buffalo, Alba Oswego/Watertown, Albany/Utica/Rome and iles ny, 2000 M NY Binghamton/Cortland/Ithaca areas. Truck WASD (US. -98% of our produce including tomatoes directly from Domestic California and Florida. Bing -We are a direct receiver and processor of Dole bananas, 1981- 1245 miles ham petites and quads. 1989- 1424 miles iles pton M -During the summer months, also purchase NY State 30 00+ , NY 1998- 1518 miles produce directly from farms located around Syracuse and Oswego. Produce from California is available year round at this facility. Purchases include a full line of Verdelli, Fresh- way, River Ranch, Dole and T&A brand products featuring 2000+ miles- produce, meats, etc.domestic salad mix and shredded lettuce. 1965= 787,000 Trucks on the road= 6.658 billion gallons of fuel Truck Dole Bananas- Columbia to Syracuse= 3000miles. 1997= 1,790,000 Trucks on the road= 20.294 billion gallons of fuel California Produce= 2500miles Local distribution= 150+ miles in refrigerated trucks California- Imports- produce- 2500 miles // 500.2 Ecology of Cities - Prof. Vassilev Final Presentation - BONDARENKO SHALAMIAN TAFROV WEIGAND SHRINKINGCITY_URBAN STRATEGIES
- 9. research syracuse trash ows w s Landfill daily ado city to Seneca Me e miles out of th 60 sh d rte Tra o ar e tr a nsp Materials te was Roughly 6,0 00 tons o f Ley Creek Transfer Station (products) Seneca Meadows, 2600 acres of Landfill Syracuse Trash All trash generated in the city passes through the either the Lay Creek or Rock Cut Road Transfer Station before it is sorted and shipped off to either the Seneca Meadows Landfill or the Waste To Energy facility The Waste To Energy (WTE) facility in Jamesville, NY is 10 miles south of Syracuse and burns solid wastes to heat water which then evaporates and turns a steam turbine. Metals are harvested from the ash before its sent to a landfill // 500.2 Ecology of Cities - Prof. Vassilev Final Presentation - BONDARENKO SHALAMIAN TAFROV WEIGAND SHRINKINGCITY_URBAN STRATEGIES
- 10. research syracuse water supply Syracuse Water Supply Most of the water that is brought to the city originates in Skaneateles Lake. However in times of high demand or drought extra water is pumped from Lake Ontario Syracuse Water Pipes The original water pipes that ran water from Skaneateles were put under the city streets more than a century ago. Today most of these same pipes still lie under the streets and are in very poor condition Syracuse Sewer System The sewer system of Syracuse is in a similar state of disrepair as the water pipes. Both over a century old, they are degrading beyond use. The sewer system is also a Combined Sewer Overflow(CSO) which means that when rain runoff fills the sewers, both the surface and black water spill over into Onondaga Creek as well as Onondaga Lake // 500.2 Ecology of Cities - Prof. Vassilev Final Presentation - BONDARENKO SHALAMIAN TAFROV WEIGAND SHRINKINGCITY_URBAN STRATEGIES
- 11. research water / waste ow INPUT USE OUTPUT Water Flow This flow chart shows how water cycles from either Skaneateles or Ontario Lake through Skaneateles Lake the city of Syracuse back into the aquifer. Lake Ontario This flow chart also breaks down some important processes like runoff overflow and Syracuse Homes water treatment Contaminated Improvements Main Interceptor Sewer Overflow There are many costly improvements that Runoff Rain Onondaga Stream and need to be made to the current system in (A CSO Sewer) Onondaga Lake order for it to function more efficiently and be more eco-friendly. The major areas that need Lay Creek fixing are enclosed with red dashed lines Westside Metropolitan Syracuse Clean Water into Liverpool Wastewater Treatment Plant Onondaga Lake Syracuse Homes Currently households in Syracuse aren’t making a serious effort to recycle their own greywater. Greywater from showers and sinks Methane released from Biosolids can be used to water your garden. reused to power the Plant Main Inceptor Sewer and Overflow Currently the main sewer line that runs throughout Syracuse is a Combine Sewer Solid Waste Overflow(CSO). This means that when +Kiln dust (Biosolids) rain runoff is carried by the same sewer that +Lime handles blackwater. When this sewer floods the blackwater spews over to surrounding N-Viro Fertilizer for Farmers creeks and lakes. The two sewer types should be separated // 500.2 Ecology of Cities - Prof. Vassilev Final Presentation - BONDARENKO SHALAMIAN TAFROV WEIGAND SHRINKINGCITY_URBAN STRATEGIES
- 12. Trash / recycling ows GENERATORS RECYCLE OUTPUT Trash Flows Syracuse has a complex and multifaceted Industry waste disposal system. Solid trash is Commercial Compost Soil collected and brought to one of the two People Transfer Stations. Here the trash goes through preliminary sorting, separating out Trash Recyclable Items Saved Resources recyclables, hazardous waste, metals, (Paper, Plastic, etc.) regular trash, etc. Non-recyclable trash is sent to the Waste To Energy Facility (WTE) Ley Creek or Rock Cut where it will be burned to create energy via Road Transfer Station steam turbines. Metals are then removed from the ash and it is sent to landfills. The Seneca Meadows landfill buries waste using synthetic containment in the base layer. The landfill Waste To Energy Trash Burned Metals also captures Methane that it uses to power (WTE) some processes in the landfill C02 Energy to power Improvements 30,000 homes WTE Facility This facility reduced the amount of physical Ash Byproduct trash in landfills while generating enough energy to power 30,000 homes. However it still releases a massive amount of C02 which Seneca Meadows Landfill should be regulated in a better way Seneca Meadows Landfill Water Treatment Leachate While this facility goes beyond normal Methane standards by reusing its methane byproduct, the Leachate it produces and maintains is Small Amounts of Energy highly detrimental to the environment // 500.2 Ecology of Cities - Prof. Vassilev Final Presentation - BONDARENKO SHALAMIAN TAFROV WEIGAND SHRINKINGCITY_URBAN STRATEGIES
- 13. research IN NEW YORK STATE, THE PRINCIPAL DISTRIBUTION UTILITY IS NATIONAL GRID, WHICH OTHER state energy TRANSMITS ENERGY GENERATED FROM A VARIETY OF SOURCES THROUGHOUT THE STATE. 3% THE STATE USES OIL TOTAL : 165613 GwH ANNUALLY 1% (NYS 2009 ENERGY PLAN DRAFT ) NATURAL GAS THROUGH THE DEVELOPMENT OF A RENEWABLE PORTFOLIO STANDARD, THE STATE 11% HOPES TO ACHIEVE A DISTRIBUTION PERCENTAGE OF 25% FROM RENEWABLE SYRACUSE ENERGY SOURCES, MAINLY WIND, PV, AND HYDROELECTRIC PLANTS BY 2013. NUCLEAR AT THE NATIONAL LEVEL, OUR MAIN SOURCE OF ELECTRIC GENERATION ARE FROM 26% FOSSIL FUELS; HOWEVER, THE REGIONAL NATURE OF THE POWER GRIDS CREATES VARIOUS SUB-CATEGORIES OF DOMINANT GENERATION TYPE. IN THE STATE OF NEW NATURAL GAS YORK, ESPECIALLY, THERE IS A GREAT SHIFT IN PLANT TYPES EVEN BETWEEN THE / OIL DUEL “UPSTATE” REGIONS AND THE DOWNSTATE + LONG ISLAND AREAS. WHILE A LARGE PORTION OF THE POPULATION IS CENTERED IN NYC AND THE GREATER METROPOLI- 17% STATE LEVEL ENERGY TAN CORRIDOR OF THE NORTHEAST, THE GENERATION OF POWER IS DISTRIBUTED ACCORDING TO AVAILABLITY OF RESOURCES AND LAND, SO THERE ARE SOURCES PETROLEUM NATURAL GAS OF POWER THROUGHOUT THE STATE; WHILE ON ONE HAND THIS IS A GOOD THING, AS PEOPLE HAVE ACCESS TO POWER REGARDLESS OF WHERE THEY LIVE, ON THE COAL HYDRO OTHER, THE ASSOCIATED TRANSMISSION LOSSES COULD BE AVOIDED BY LOCATING HYDRO COAL HYDRO WIND POWER GENERATION FACILITIES CLOSER IN ALIGNMENT WITH POPULATIONS. 17% 11% PETROLEUM - PETROLEUM IS IMPORTED THROUGH THE NEW YORK HARBOR AND ALSO THE PORT IMPORTS OF BUFFALO, AND THROUGH PIPELINES FROM THE GULF COAST. THE REGION, WITH ITS HIGH WINTERTIME HEATING LOADS, IS SUCEPTIBLE TO FLUCTUATIONS IN FUEL 13% COSTS. NATURAL GAS - WHILE NY HAS SOME NATURAL GAS WELLS, IT IMPORTS THE REMAINDER OF ITS SUPPLY FROM ACROSS THE US AND CANADA, MAINLY FROM THE TENNESEE PIPELINE AND IROQUOIS PIPELINE. STATE LEVEL POWER GENERATION (NYS) NUCLEAR - THE STATE GENERATES APPROXIMATELY 30% OF ITS ENERGY THROUGH THE USE OF NUCLEAR GENERATION, REDUCING ITS USE OF FOSSIL FUELS FOR ELECTRICITY GENERATION HYDRO - NY IS A LEADER IN HYDROELECTRIC POWER, WITH THE MOST HYDRO CAPACITY EAST OF THE ROCKY MOUNTAINS. RENEWABLES - ALTHOUGH THE STATE HAS AGRESSIVE FUNDING AND IMPLEMENTATION STRATEGIES UNDERWAY, RENEWABLES SUCH AS WIND, WASTE, BIOMASS AND SOLAR ONLY ACCOUNT FOR 3% OF ITS ENERGY USAGE. HIGH POWER TRANSMISSION THE STATE IS ONE OF THE LARGEST USERS OF ENERGY; HOWEVER IT ALSO HAS ONE OVERHEAD LINES OF THE LOWEST ENERGY CONSUMPTION PER CAPITA NUMBERS; ATTRIBUTABLE TO GOOD PUBLIC TRANSIT AND DENSITY IN POPULATION CENTERS NATIONAL GRID (UTILITY) + ONONDAGA COUNTY ELECTRIC ELECTRIC + NATURAL GAS // 500.2 Ecology of Cities - Prof. Vassilev Final Presentation - BONDARENKO SHALAMIAN TAFROV WEIGAND SHRINKINGCITY_URBAN STRATEGIES
- 14. renewable energy WIND SOLAR HYDRO WIND ENERGY POTENTIAL SOLAR ENERGY POTENTIAL GEOTHERMAL TEMPERATURES GEOTHERMAL THESE FORMS OF POWER GENERATION ACT WITH RENEWABLE, RATHER THAN LIMITED, CARBON PRODUCING STORED FORMS OF ENERGY; SUCH AS FOSSIL FUELS. HOWEVER, RENEWABLES ARE DEPENDENT ON A NUMBER OF FACTORS RELATED TO THEIR SITING AND FLUCTUATIONS IN GENERATING RELIABILITY. THIS IS ONE OF THE REASONS WHY IT IS DIFFICULT TO ADOPT CERTAIN TYPES AS THE SOLE SOURCE OF POWER, ESPECIALLY AT A LOCAL SCALE. FOR EXAMPLE, IN ORDER TO MAINTAIN AN EVEN FLOW OF POWER, INTENSIVE BATTERY SYSTEMS OR HYBRIDS OF SOLAR / WIND MUST BE USED. HYDROPOWER AND GEOTHERMAL ARE MUCH MORE REGULAR, HOWEVER, BOTH REQUIRE SPECIFIC TOPOGRAPHIC CONDITIONS WHICH DO NOT EXIST EVERYWHER THAT POWER IS NEEDED. RENEWABLE ENERGY, WITH A VARIETY OF SYSTEMS OF GENERATION AND A MORE EFFICIENT POWER GRID, ARE POSSIBLE SOLUTIONS TO OUR ENERGY CRISIS. A REDUCTION OF PER-CAPITA USAGE WILL ALSO BE THIS DOE GRAPH REPRESENTS THE UNITED STATES DEVELOPMENT OF RENEWABLE SOURCES FOR ELECTRICITY GENERATION WITH REGARDS TO TIME; AND OFFERS AN INSIGHT INTO THE ESSENTIAL, AS POPULATIONS CONTINUE TO GROW AT A RATE PLANNING OF RENEWABLE ENERGY DEVELOPMENT TO COME. AS THE GUES T SPEAKER ELABORATED, THE MAIN SOURCE OF GROWTH IN THE FIELD IS IN WIND POWER, WHICH IS PROVEN OUTSTRIPPING DEMAND . (EUROPE) HOWEVER REQUIREDS SPECIAL SITING OF PROJECTS AND A LARGE, LESS EFFICIENT TRANSMISSION GRID. 50.00 RENEWABLE ENERGY PRODUCTION (Gw) 45.00 40.00 35.00 30.00 projected GIGAWATTS 25.00 20.00 15.00 10.00 5.00 wind 0.00 biomass waste 1981 1982 1983 1984 1985 1986 1987 1988 1989 1990 1991 1992 1993 1994 1995 1996 1997 1998 1999 2000 2001 2002 2003 2004 2005 2006 2007 2008 2010 2020 2030 geothermal TIME // 500.2 Ecology of Cities - Prof. Vassilev Final Presentation - BONDARENKO SHALAMIAN TAFROV WEIGAND SHRINKINGCITY_URBAN STRATEGIES
- 15. WESTER N INTERC ONNECT national level energy CONVENTIONAL WIND WOOD OTHER BIOMASS SOLAR / THERMAL PUMPED STORAGE 2% 1% <1% <1% 2% EASTERN INTERCONNECT HYDRO 7% NUCLEAR COAL PUMPED 10% 31% STORAGE <1% 230, 000 V 345, 000 V 500,000V 765, 000 V OIL HIGH VOLTAGE DC NATURAL GAS 6% 41% TEXAS INTERCONNECT NATIONAL LEVEL POWER GENERATION (EIA.DOE) AT THE NATIONAL LEVEL, POWER IS GENERATED ACROSS THE COUNTRY; HOWEVER THE DISTRIBUTION OF PEOPLE AND RESOURCES - DOES NOT ALIGN PERFECTLY; AS A RESULT, ENERGY MUST BE CARRIED THROUGH THE GRID; WERE EFFI- CIENCY LOSSES OCCUR. WHILE THERE ARE SEVERAL NEW TECHNOLOGIES AIMED AT CHANGING / IMPROVING LOSSES, THE WAY IN WHICH THE GRID WORKS IS INHERENTLY INEFFICIENT. POWER GENERATING STATIONS SIZE DENOTES OUTPUT SUBGRID STRUCTURE // 500.2 Ecology of Cities - Prof. Vassilev Final Presentation - BONDARENKO SHALAMIAN TAFROV WEIGAND SHRINKINGCITY_URBAN STRATEGIES
- 16. national energy ow 2008 DOE EIA Annual Energy Review - (quadrillion btus) // 500.2 Ecology of Cities - Prof. Vassilev Final Presentation - BONDARENKO SHALAMIAN TAFROV WEIGAND SHRINKINGCITY_URBAN STRATEGIES