1. Algebra 2
5.1 Graphing Quadratic Functions (p. 249)
A quadratic function has the form _______________________________.
The graph of a quadratic is called a ____________________; it’s shaped like a U.
The _____________ is the lowest or highest point on the parabola.
The axis of _____________________ is the vertical line going through the vertex.
The parabola opens _______ if a > 0 (positive).
It opens down if ___________________.
The x-coordinate of the ___________________ is – b
2a
The axis of symmetry is the vertical line ___________________.
The parabola is wider if a is a _______________________.
It is narrower if a is a _________________________ greater than 1.
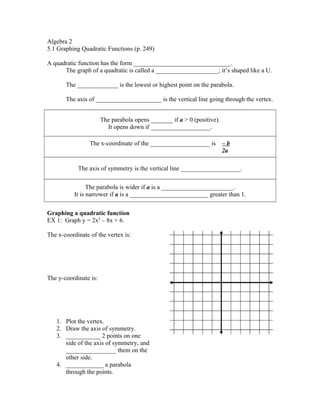
Graphing a quadratic function
EX 1: Graph y = 2x2
– 8x + 6.
The x-coordinate of the vertex is:
The y-coordinate is:
1. Plot the vertex.
2. Draw the axis of symmetry.
3. ___________ 2 points on one
side of the axis of symmetry, and
________________ them on the
other side.
4. ____________ a parabola
through the points.
2. EX 2: Graph y = – x2
+ x + 12
Vertex Form
If the equation is in the form y = a(x – h)2
+ k, the vertex is (h, k), and the axis of
symmetry is x = h.
EX 2: Graph y = 2(x – 1)2
+ 3.
HW p. 253 (18 – 30 even)