SlideShare a Scribd company logo
1 of 4
Download to read offline
MARKET ACTION REPORT                                                                                                                              October 2011
                                                                                                   Victoria Blyke
                                                                                                   Sales Associate
                                                                                                   (203) 322-2300

City: Stamford                                                                                     victoria.blyke@cbmoves.com
                                                                                                   http://www.Coldwellbankermoves.com/Victoria.Blyke


Price Range: ALL | Properties: Single Family Home
                                                                                                   Trending Versus*:                                     Trending Versus*:
           Market Profile & Trends Overview                                 Month            LM      L3M PYM              LY            YTD            PriorYTD         PriorYear
Median List Price of all Current Listings                                    $629,000     1%                    -3%
Average List Price of all Current Listings                                    $916,577   -1%                      6%
October Median Sales Price                                                    $457,375 -24%           -17%     -16%       -23%          $539,450             -10%             -9%
October Average Sales Price                                                  $529,292 -15%            -19%     -20%       -25%          $664,680              -6%             -6%
Total Properties Currently for Sale (Inventory)                                    502  -2%                       2%
October Number of Properties Sold                                                   30 -50%                    -23%                           460             -1%
October Average Days on Market (Solds)                                             122 34%             22%      10%        15%                102             -3%             -4%
Asking Price per Square Foot (based on New Listings)                             $291     1%            3%        1%       -7%               $329             12%              5%
October Sold Price per Square Foot                                               $250     4%            1%      -8%        -6%               $257             -3%             -3%
October Month's Supply of Inventory                                               16.7 96%             54%      33%       49%                 12.3            11%             10%
October Sale Price vs List Price Ratio                                          94.2% -1.6%             0%       -1%      0.1%              94.6%            0.7%            0.6%
   * LM=Last Month / L3M=Last 3 Months / PYM=Same Month Prior Year / LY=Last Year / YTD = Year-to-date

                                                                             Property Sales
October Property sales were 30, down -23.1% from 39 in October of 2010 and -50.0% lower than the 60 sales last month. October 2011 sales
were at their lowest level compared to October of 2010 and 2009. October YTD sales of 460 are running -1.1% behind last year's year-to-date
sales of 465.


                                                                                    Prices
The Median Sales Price in October was $457,375, down -15.7% from $542,500 in October of 2010 and down -23.8% from $600,000 last
month. The Average Sales Price in October was $529,292, down -19.9% from $661,136 in October of 2010 and down -15.1% from $623,468
last month. October 2011 ASP was at the lowest level compared to October of 2010 and 2009.


   Based on information from Greater Fairfield County CMLS, Inc. for the period 11/1/2008 through 10/31/2011. Due to MLS reporting methods and allowable reporting
   policy, this data is only informational and may not be completely accurate. Therefore, Coldwell Banker Residential Brokerage does not guarantee the data accuracy.
   Data maintained by the MLS's may not reflect all real estate activity in the market.
MARKET ACTION REPORT                                                                                                                              October 2011
                                                                                                   Victoria Blyke
                                                                                                   Sales Associate
                                                                                                   (203) 322-2300

City: Stamford                                                                                     victoria.blyke@cbmoves.com
                                                                                                   http://www.Coldwellbankermoves.com/Victoria.Blyke


Price Range: ALL | Properties: Single Family Home
                                                                          Inventory & MSI
The Total Inventory of Properties available for sale as of October was 502, down -2.0% from 512 last month and up 2.2% from 491 in October
of last year. October 2011 Inventory was at a mid range compared to October of 2010 and 2009.

A comparatively lower MSI is more beneficial for sellers while a higher MSI is better for buyers. The October 2011 MSI of 16.7 months was
at its highest level compared with October of 2010 and 2009.


                                                                              Market Time
The average Days On Market(DOM) shows how many days the average Property is on the Market before it sells. An upward trend in DOM
tends to indicate a move towards more of a Buyer's market, a downward trend a move towards more of a Seller's market. The DOM for
October was 122, up 34.1% from 91 days last month and up 9.9% from 111 days in October of last year. The October 2011 DOM was at its
highest level compared with October of 2010 and 2009.


                                                               Selling Price per Square Foot
The Selling Price per Square Foot is a great indicator for the direction of Property values. Since Median Sales Price and Average Sales price
can be impacted by the 'mix' of high or low end Properties in the market, the selling price per square foot is a more normalized indicator on the
direction of Property values. The October 2011 Selling Price per Square Foot of $250 was up 4.2% from $240 last month and down -7.7%
from $271 in October of last year.


   Based on information from Greater Fairfield County CMLS, Inc. for the period 11/1/2008 through 10/31/2011. Due to MLS reporting methods and allowable reporting
   policy, this data is only informational and may not be completely accurate. Therefore, Coldwell Banker Residential Brokerage does not guarantee the data accuracy.
   Data maintained by the MLS's may not reflect all real estate activity in the market.
MARKET ACTION REPORT                                                                                                                              October 2011
                                                                                                   Victoria Blyke
                                                                                                   Sales Associate
                                                                                                   (203) 322-2300

City: Stamford                                                                                     victoria.blyke@cbmoves.com
                                                                                                   http://www.Coldwellbankermoves.com/Victoria.Blyke


Price Range: ALL | Properties: Single Family Home
                                                        Selling Price vs Original Listing Price
The Selling Price vs Original Listing Price reveals the average amount that Sellers are agreeing to come down from their original list price.
The lower the ratio is below 100% the more of a Buyer's market exists, a ratio at or above 100% indicates more of a Seller's market. The
October 2011 Selling Price vs Original List Price of 94.2% was down from 95.7% last month and down from 94.8% in October of last year.


                                                             Inventory / New Listings / Sales
'This last view of the market combines monthly inventory of Properties for sale along with New Listings and Sales. The graph shows the basic
annual seasonality of the market as well as the relationship between these items. The number of New Listings in October 2011 was 88, down -
12.9% from 101 last month and up 7.3% from 82 in October of last year.


   Based on information from Greater Fairfield County CMLS, Inc. for the period 11/1/2008 through 10/31/2011. Due to MLS reporting methods and allowable reporting
   policy, this data is only informational and may not be completely accurate. Therefore, Coldwell Banker Residential Brokerage does not guarantee the data accuracy.
   Data maintained by the MLS's may not reflect all real estate activity in the market.
MARKET ACTION REPORT                                                                                                                                                                                            October 2011
                                                                                                                                                 Victoria Blyke
                                                                                                                                                 Sales Associate
                                                                                                                                                 (203) 322-2300

City: Stamford                                                                                                                                   victoria.blyke@cbmoves.com
                                                                                                                                                 http://www.Coldwellbankermoves.com/Victoria.Blyke


Price Range: ALL | Properties: Single Family Home


                            N 08    D J 09      F    M      A    M      J     J     A     S    O      N      D J 10      F    M      A    M    J       J     A     S     O      N      D J 11         F   M     A   M     J    J     A     S    O
Homes Sold                    36   26 15       22    23    24    35    52    58    60    45    46    60     51 30       29    42    41    44 100      51    44    45     39    28     47 33          34   24   28   59   72   50    70    60    30
3 Mo. Roll Avg                          26     21    20    23    27    37    48    57    54    50    50     52 47       37    34    37    42 62       65    65    47     43    37     38 36          38   30   29   37   53   60    64    60    53

                  (000's)   N 08   D J 09   F M     A M     J   J   A   S  O    N   D J 10  F M     A M     J   J   A   S  O    N   D J 11  F M     A M     J   J   A   S  O
MedianSalePrice              595 510 580 440 582 608 585 533 580 591 595 560 580 575 541 550 578 545 585 658 653 618 580 543 595 532 590 486 563 545 550 523 630 550 600 457
3 Mo. Roll Avg                        562 510 534 543 592 575 566 568 589 582 578 572 565 555 556 558 569 596 632 643 617 580 573 557 572 536 546 531 552 539 568 568 593 536

                            N 08   D J 09  F M     A M     J   J   A   S  O    N   D J 10  F M     A M     J   J   A   S  O    N   D J 11  F M     A M     J   J   A   S  O
Inventory                    482 394 419 453 499 568 594 601 570 545 554 517 435 377 403 421 456 491 503 490 484 462 493 491 452 382 385 404 475 525 543 583 561 518 512 502
MSI                           13 15 28 21 22 24 17 12 10           9 12 11     7   7 13 15 11 12 11        5   9 11 11 13 16       8 12 12 20 19       9   8 11    7   9 17

                            N 08   D J 09   F M     A M     J                 J   A   S  O   N               D J 10 F M     A M     J                  J     A     S  O    N   D J 11  F M     A M     J   J   A                           S  O
Days On Market               121 110 117 108 121 140 107 91                  90 115 107 115 95              81 99 125 140 141 88 95                   87    99    96 111 138 91 113 110 116 109 91 104 108 93                             91 122
3 Mo. Roll Avg                        116 112 115 123 123 113                96 99 104 112 106              97 92 102 121 135 123 108                 90    94    94 102 115 113 114 105 113 112 105 101 101 102                          97 102

                            N 08   D J 09   F M     A M     J   J   A   S  O    N   D J 10  F M     A M     J   J   A   S  O    N   D J 11  F M     A M     J   J   A   S  O
Price per Sq Ft              284 263 241 248 268 282 266 263 278 283 268 251 268 259 250 262 276 279 268 269 251 266 262 271 256 272 264 249 250 263 274 268 246 255 240 250
3 Mo. Roll Avg                        263 251 252 266 272 270 269 275 276 267 262 259 259 257 263 272 274 272 263 262 260 266 263 266 264 262 254 254 262 268 263 256 247 248

                            N 08    D J 09      F    M      A     M      J     J    A      S    O     N     D J 10       F    M     A     M      J     J     A     S     O      N     D J 11         F    M    A    M     J    J     A     S     O
Sale to List Price          0.939 0.942 0.919 0.938 0.942 0.925 0.936 0.933 0.939 0.940 0.946 0.957 0.939 0.947 0.954 0.957 0.946 0.931 0.943 0.958 0.964 0.966 0.971 0.948 0.952 0.955 0.945 0.944 0.950 0.961 0.952 0.953 0.942 0.961 0.957 0.942
3 Mo. Roll Avg                          0.933 0.933 0.933 0.935 0.934 0.931 0.936 0.937 0.942 0.948 0.947 0.948 0.947 0.953 0.952 0.945 0.940 0.944 0.955 0.963 0.967 0.962 0.957 0.952 0.951 0.948 0.946 0.952 0.954 0.955 0.949 0.952 0.953 0.953


                            N 08   D J 09  F M     A M     J   J   A   S  O    N   D J 10  F M     A M     J   J   A   S  O    N   D J 11  F M     A M     J   J   A   S  O
New Listings                  65 42 99 119 154 157 137 125 105 91 126 109 55 59 111 90 124 161 130 116 103 77 124 82 64 43 77 95 137 147 144 133 93 63 101 88
Inventory                    482 394 419 453 499 568 594 601 570 545 554 517 435 377 403 421 456 491 503 490 484 462 493 491 452 382 385 404 475 525 543 583 561 518 512 502
Sales                         36 26 15 22 23 24 35 52 58 60 45 46 60 51 30 29 42 41 44 100 51 44 45 39 28 47 33 34 24 28 59 72 50 70 60 30

                  (000's)   N 08   D J 09   F M     A M     J   J   A   S  O    N   D J 10  F M     A M     J   J   A   S  O    N   D J 11  F M     A M     J   J   A   S  O
Avg Sale Price               649 542 563 526 614 674 661 681 687 775 696 594 669 656 568 629 724 850 724 706 770 715 672 661 628 636 831 561 590 683 732 626 725 688 623 529
3 Mo. Roll Avg                        585 544 568 605 650 672 676 715 719 688 653 639 631 618 640 735 766 760 733 730 719 683 654 642 698 676 661 611 668 680 694 680 679 614


    Based on information from Greater Fairfield County CMLS, Inc. for the period 11/1/2008 through 10/31/2011. Due to MLS reporting methods and allowable reporting policy, this data is only informational and may not be
    completely accurate. Therefore, Coldwell Banker Residential Brokerage does not guarantee the data accuracy. Data maintained by the MLS's may not reflect all real estate activity in the market.

More Related Content

What's hot

FVREB October 2020 Statistics Package
FVREB October 2020 Statistics PackageFVREB October 2020 Statistics Package
FVREB October 2020 Statistics PackageVicky Aulakh
 
Fvreb package april 2020
Fvreb package april 2020Fvreb package april 2020
Fvreb package april 2020Vicky Aulakh
 
The Fraser Valley Real Estate Statistics Package
The Fraser Valley Real Estate Statistics PackageThe Fraser Valley Real Estate Statistics Package
The Fraser Valley Real Estate Statistics PackageVicky Aulakh
 
VREB Sept 2020 Stats
VREB Sept 2020 StatsVREB Sept 2020 Stats
VREB Sept 2020 StatsVicky Aulakh
 
BC Leading Housing Market - March 2011
BC Leading Housing Market -  March 2011BC Leading Housing Market -  March 2011
BC Leading Housing Market - March 2011Matt Collinge
 
State of the U.S. Online Retail Economy in Q2 2010
State of the U.S. Online Retail Economy in Q2 2010 State of the U.S. Online Retail Economy in Q2 2010
State of the U.S. Online Retail Economy in Q2 2010 comScore
 
John Michael Staatz - Agricultural price volatility: causes, impacts & policy...
John Michael Staatz - Agricultural price volatility: causes, impacts & policy...John Michael Staatz - Agricultural price volatility: causes, impacts & policy...
John Michael Staatz - Agricultural price volatility: causes, impacts & policy...Global Risk Forum GRFDavos
 
2012 trends-october-2012 (1)
2012 trends-october-2012 (1)2012 trends-october-2012 (1)
2012 trends-october-2012 (1)Arthur Prescott
 
June Phoenix East Valley Real Estate Market Report
June Phoenix East Valley Real Estate Market ReportJune Phoenix East Valley Real Estate Market Report
June Phoenix East Valley Real Estate Market ReportLen Nevin
 
Fraser Valley Real Estate Board Statistics Package March 2021
Fraser Valley Real Estate Board Statistics Package March 2021 Fraser Valley Real Estate Board Statistics Package March 2021
Fraser Valley Real Estate Board Statistics Package March 2021 Vicky Aulakh
 
FVREB April 2021 Statistics Package
FVREB April 2021 Statistics PackageFVREB April 2021 Statistics Package
FVREB April 2021 Statistics PackageVicky Aulakh
 
Fraser Valley Real Estate Board May 2021 Statistics Package
Fraser Valley Real Estate Board May 2021 Statistics PackageFraser Valley Real Estate Board May 2021 Statistics Package
Fraser Valley Real Estate Board May 2021 Statistics PackageVicky Aulakh
 
Market and Demand
Market and DemandMarket and Demand
Market and Demanditutor
 

What's hot (19)

FVREB October 2020 Statistics Package
FVREB October 2020 Statistics PackageFVREB October 2020 Statistics Package
FVREB October 2020 Statistics Package
 
Fvreb package april 2020
Fvreb package april 2020Fvreb package april 2020
Fvreb package april 2020
 
The Fraser Valley Real Estate Statistics Package
The Fraser Valley Real Estate Statistics PackageThe Fraser Valley Real Estate Statistics Package
The Fraser Valley Real Estate Statistics Package
 
Stats oct 11
Stats oct 11Stats oct 11
Stats oct 11
 
VREB Sept 2020 Stats
VREB Sept 2020 StatsVREB Sept 2020 Stats
VREB Sept 2020 Stats
 
BC Leading Housing Market - March 2011
BC Leading Housing Market -  March 2011BC Leading Housing Market -  March 2011
BC Leading Housing Market - March 2011
 
State of the U.S. Online Retail Economy in Q2 2010
State of the U.S. Online Retail Economy in Q2 2010 State of the U.S. Online Retail Economy in Q2 2010
State of the U.S. Online Retail Economy in Q2 2010
 
John Michael Staatz - Agricultural price volatility: causes, impacts & policy...
John Michael Staatz - Agricultural price volatility: causes, impacts & policy...John Michael Staatz - Agricultural price volatility: causes, impacts & policy...
John Michael Staatz - Agricultural price volatility: causes, impacts & policy...
 
2012 trends-october-2012 (1)
2012 trends-october-2012 (1)2012 trends-october-2012 (1)
2012 trends-october-2012 (1)
 
June Phoenix East Valley Real Estate Market Report
June Phoenix East Valley Real Estate Market ReportJune Phoenix East Valley Real Estate Market Report
June Phoenix East Valley Real Estate Market Report
 
Fraser Valley Real Estate Board Statistics Package March 2021
Fraser Valley Real Estate Board Statistics Package March 2021 Fraser Valley Real Estate Board Statistics Package March 2021
Fraser Valley Real Estate Board Statistics Package March 2021
 
June 2014 Report
June 2014 ReportJune 2014 Report
June 2014 Report
 
FVREB April 2021 Statistics Package
FVREB April 2021 Statistics PackageFVREB April 2021 Statistics Package
FVREB April 2021 Statistics Package
 
Fraser Valley Real Estate Board May 2021 Statistics Package
Fraser Valley Real Estate Board May 2021 Statistics PackageFraser Valley Real Estate Board May 2021 Statistics Package
Fraser Valley Real Estate Board May 2021 Statistics Package
 
August 2014 Market Report
August 2014 Market ReportAugust 2014 Market Report
August 2014 Market Report
 
February 2015 Market Report
February 2015 Market ReportFebruary 2015 Market Report
February 2015 Market Report
 
July 2015 Market Report
July 2015 Market ReportJuly 2015 Market Report
July 2015 Market Report
 
Market and Demand
Market and DemandMarket and Demand
Market and Demand
 
September 2015 Market Report
September 2015 Market ReportSeptember 2015 Market Report
September 2015 Market Report
 

Viewers also liked (10)

Nouns related to 70 past practice
Nouns related to 70 past practiceNouns related to 70 past practice
Nouns related to 70 past practice
 
Anand Bharti
Anand BhartiAnand Bharti
Anand Bharti
 
THE MODEL EXPERIENCE
THE MODEL EXPERIENCETHE MODEL EXPERIENCE
THE MODEL EXPERIENCE
 
5 most important traits of innovative leaders
5 most important traits of innovative leaders5 most important traits of innovative leaders
5 most important traits of innovative leaders
 
School objects1 prim
School objects1 primSchool objects1 prim
School objects1 prim
 
Corporate presentation
Corporate presentationCorporate presentation
Corporate presentation
 
Days of the week 1ero
Days of the week 1eroDays of the week 1ero
Days of the week 1ero
 
Presentacion 1ero
Presentacion  1eroPresentacion  1ero
Presentacion 1ero
 
ANYWAR JOHN KENNEDY
ANYWAR JOHN KENNEDYANYWAR JOHN KENNEDY
ANYWAR JOHN KENNEDY
 
Cardiovascular System
Cardiovascular SystemCardiovascular System
Cardiovascular System
 

Similar to Market Trend Thru Oct 2011

Victoria Real Estate Board November 2020 Statistics Package
Victoria Real Estate Board November 2020 Statistics PackageVictoria Real Estate Board November 2020 Statistics Package
Victoria Real Estate Board November 2020 Statistics PackageVicky Aulakh
 
Victoria Real Estate Board September 2022 Statistics
Victoria Real Estate Board September 2022 Statistics Victoria Real Estate Board September 2022 Statistics
Victoria Real Estate Board September 2022 Statistics VickyAulakh1
 
VREB September 2021 Statistics Package
VREB September 2021 Statistics Package VREB September 2021 Statistics Package
VREB September 2021 Statistics Package VickyAulakh1
 
VREB March 2023.pdf
VREB March 2023.pdfVREB March 2023.pdf
VREB March 2023.pdfVickyAulakh1
 
Victoria Real Estate Board June 2021 Statistics
Victoria Real Estate Board June 2021 StatisticsVictoria Real Estate Board June 2021 Statistics
Victoria Real Estate Board June 2021 StatisticsVicky Aulakh
 
Metro Boston Multi-Family Activity Housing Report - Nov 2012
Metro Boston Multi-Family Activity Housing Report - Nov 2012Metro Boston Multi-Family Activity Housing Report - Nov 2012
Metro Boston Multi-Family Activity Housing Report - Nov 2012Unit Realty Group
 
October 2012 Single Family Sales Report for Pioneer Valley, Western Massachus...
October 2012 Single Family Sales Report for Pioneer Valley, Western Massachus...October 2012 Single Family Sales Report for Pioneer Valley, Western Massachus...
October 2012 Single Family Sales Report for Pioneer Valley, Western Massachus...Lesley Lambert
 
Victoria Real Estate Board Statistics - November 2021
Victoria Real Estate Board Statistics - November 2021Victoria Real Estate Board Statistics - November 2021
Victoria Real Estate Board Statistics - November 2021VickyAulakh1
 
VREB October 2020 Statistics Package
VREB October 2020 Statistics PackageVREB October 2020 Statistics Package
VREB October 2020 Statistics PackageVicky Aulakh
 
Victoria Real Estate Board July 2021 Statistics
Victoria Real Estate Board July 2021 StatisticsVictoria Real Estate Board July 2021 Statistics
Victoria Real Estate Board July 2021 StatisticsVicky Aulakh
 
VREB February 2023 Statistics.pdf
VREB February 2023 Statistics.pdfVREB February 2023 Statistics.pdf
VREB February 2023 Statistics.pdfVickyAulakh1
 
Victoria Real Estate Board March 2021 Statistics Package
Victoria Real Estate Board March 2021 Statistics PackageVictoria Real Estate Board March 2021 Statistics Package
Victoria Real Estate Board March 2021 Statistics PackageVicky Aulakh
 
Calvert Home Mortgage Real Estate and Economic Report for November 2015
Calvert Home Mortgage Real Estate and Economic Report for November 2015Calvert Home Mortgage Real Estate and Economic Report for November 2015
Calvert Home Mortgage Real Estate and Economic Report for November 2015Keith Uthe
 
Multi-Family Housing Activity Report, September 2012
Multi-Family Housing Activity Report, September 2012Multi-Family Housing Activity Report, September 2012
Multi-Family Housing Activity Report, September 2012Unit Realty Group
 
VREB August 2022 Statistics Package
VREB August 2022 Statistics Package VREB August 2022 Statistics Package
VREB August 2022 Statistics Package VickyAulakh1
 
October 2016 REBGV Statistics Package Vancouver BC Mike Stewart Realtor
October 2016 REBGV Statistics Package Vancouver BC Mike Stewart RealtorOctober 2016 REBGV Statistics Package Vancouver BC Mike Stewart Realtor
October 2016 REBGV Statistics Package Vancouver BC Mike Stewart RealtorMike Stewart
 
Toronto Real Estate Statistics september 2011
Toronto Real Estate Statistics september 2011Toronto Real Estate Statistics september 2011
Toronto Real Estate Statistics september 2011John Helfrich
 
Victoria Real Estate Board Statistics February 2020
Victoria Real Estate Board Statistics February 2020Victoria Real Estate Board Statistics February 2020
Victoria Real Estate Board Statistics February 2020Vicky Aulakh
 
VREB August 2020 Stats
VREB August 2020 Stats VREB August 2020 Stats
VREB August 2020 Stats Vicky Aulakh
 

Similar to Market Trend Thru Oct 2011 (20)

Victoria Real Estate Board November 2020 Statistics Package
Victoria Real Estate Board November 2020 Statistics PackageVictoria Real Estate Board November 2020 Statistics Package
Victoria Real Estate Board November 2020 Statistics Package
 
Victoria Real Estate Board September 2022 Statistics
Victoria Real Estate Board September 2022 Statistics Victoria Real Estate Board September 2022 Statistics
Victoria Real Estate Board September 2022 Statistics
 
Market summary october 2011 power point
Market summary october 2011 power pointMarket summary october 2011 power point
Market summary october 2011 power point
 
VREB September 2021 Statistics Package
VREB September 2021 Statistics Package VREB September 2021 Statistics Package
VREB September 2021 Statistics Package
 
VREB March 2023.pdf
VREB March 2023.pdfVREB March 2023.pdf
VREB March 2023.pdf
 
Victoria Real Estate Board June 2021 Statistics
Victoria Real Estate Board June 2021 StatisticsVictoria Real Estate Board June 2021 Statistics
Victoria Real Estate Board June 2021 Statistics
 
Metro Boston Multi-Family Activity Housing Report - Nov 2012
Metro Boston Multi-Family Activity Housing Report - Nov 2012Metro Boston Multi-Family Activity Housing Report - Nov 2012
Metro Boston Multi-Family Activity Housing Report - Nov 2012
 
October 2012 Single Family Sales Report for Pioneer Valley, Western Massachus...
October 2012 Single Family Sales Report for Pioneer Valley, Western Massachus...October 2012 Single Family Sales Report for Pioneer Valley, Western Massachus...
October 2012 Single Family Sales Report for Pioneer Valley, Western Massachus...
 
Victoria Real Estate Board Statistics - November 2021
Victoria Real Estate Board Statistics - November 2021Victoria Real Estate Board Statistics - November 2021
Victoria Real Estate Board Statistics - November 2021
 
VREB October 2020 Statistics Package
VREB October 2020 Statistics PackageVREB October 2020 Statistics Package
VREB October 2020 Statistics Package
 
Victoria Real Estate Board July 2021 Statistics
Victoria Real Estate Board July 2021 StatisticsVictoria Real Estate Board July 2021 Statistics
Victoria Real Estate Board July 2021 Statistics
 
VREB February 2023 Statistics.pdf
VREB February 2023 Statistics.pdfVREB February 2023 Statistics.pdf
VREB February 2023 Statistics.pdf
 
Victoria Real Estate Board March 2021 Statistics Package
Victoria Real Estate Board March 2021 Statistics PackageVictoria Real Estate Board March 2021 Statistics Package
Victoria Real Estate Board March 2021 Statistics Package
 
Calvert Home Mortgage Real Estate and Economic Report for November 2015
Calvert Home Mortgage Real Estate and Economic Report for November 2015Calvert Home Mortgage Real Estate and Economic Report for November 2015
Calvert Home Mortgage Real Estate and Economic Report for November 2015
 
Multi-Family Housing Activity Report, September 2012
Multi-Family Housing Activity Report, September 2012Multi-Family Housing Activity Report, September 2012
Multi-Family Housing Activity Report, September 2012
 
VREB August 2022 Statistics Package
VREB August 2022 Statistics Package VREB August 2022 Statistics Package
VREB August 2022 Statistics Package
 
October 2016 REBGV Statistics Package Vancouver BC Mike Stewart Realtor
October 2016 REBGV Statistics Package Vancouver BC Mike Stewart RealtorOctober 2016 REBGV Statistics Package Vancouver BC Mike Stewart Realtor
October 2016 REBGV Statistics Package Vancouver BC Mike Stewart Realtor
 
Toronto Real Estate Statistics september 2011
Toronto Real Estate Statistics september 2011Toronto Real Estate Statistics september 2011
Toronto Real Estate Statistics september 2011
 
Victoria Real Estate Board Statistics February 2020
Victoria Real Estate Board Statistics February 2020Victoria Real Estate Board Statistics February 2020
Victoria Real Estate Board Statistics February 2020
 
VREB August 2020 Stats
VREB August 2020 Stats VREB August 2020 Stats
VREB August 2020 Stats
 

Market Trend Thru Oct 2011

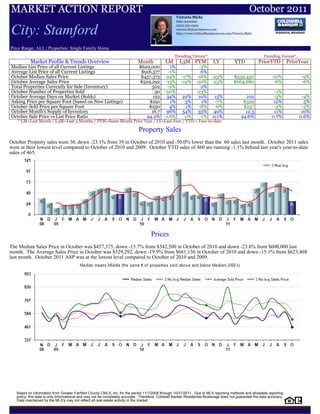
  • 1. MARKET ACTION REPORT October 2011 Victoria Blyke Sales Associate (203) 322-2300 City: Stamford victoria.blyke@cbmoves.com http://www.Coldwellbankermoves.com/Victoria.Blyke Price Range: ALL | Properties: Single Family Home Trending Versus*: Trending Versus*: Market Profile & Trends Overview Month LM L3M PYM LY YTD PriorYTD PriorYear Median List Price of all Current Listings $629,000 1% -3% Average List Price of all Current Listings $916,577 -1% 6% October Median Sales Price $457,375 -24% -17% -16% -23% $539,450 -10% -9% October Average Sales Price $529,292 -15% -19% -20% -25% $664,680 -6% -6% Total Properties Currently for Sale (Inventory) 502 -2% 2% October Number of Properties Sold 30 -50% -23% 460 -1% October Average Days on Market (Solds) 122 34% 22% 10% 15% 102 -3% -4% Asking Price per Square Foot (based on New Listings) $291 1% 3% 1% -7% $329 12% 5% October Sold Price per Square Foot $250 4% 1% -8% -6% $257 -3% -3% October Month's Supply of Inventory 16.7 96% 54% 33% 49% 12.3 11% 10% October Sale Price vs List Price Ratio 94.2% -1.6% 0% -1% 0.1% 94.6% 0.7% 0.6% * LM=Last Month / L3M=Last 3 Months / PYM=Same Month Prior Year / LY=Last Year / YTD = Year-to-date Property Sales October Property sales were 30, down -23.1% from 39 in October of 2010 and -50.0% lower than the 60 sales last month. October 2011 sales were at their lowest level compared to October of 2010 and 2009. October YTD sales of 460 are running -1.1% behind last year's year-to-date sales of 465. Prices The Median Sales Price in October was $457,375, down -15.7% from $542,500 in October of 2010 and down -23.8% from $600,000 last month. The Average Sales Price in October was $529,292, down -19.9% from $661,136 in October of 2010 and down -15.1% from $623,468 last month. October 2011 ASP was at the lowest level compared to October of 2010 and 2009. Based on information from Greater Fairfield County CMLS, Inc. for the period 11/1/2008 through 10/31/2011. Due to MLS reporting methods and allowable reporting policy, this data is only informational and may not be completely accurate. Therefore, Coldwell Banker Residential Brokerage does not guarantee the data accuracy. Data maintained by the MLS's may not reflect all real estate activity in the market.
  • 2. MARKET ACTION REPORT October 2011 Victoria Blyke Sales Associate (203) 322-2300 City: Stamford victoria.blyke@cbmoves.com http://www.Coldwellbankermoves.com/Victoria.Blyke Price Range: ALL | Properties: Single Family Home Inventory & MSI The Total Inventory of Properties available for sale as of October was 502, down -2.0% from 512 last month and up 2.2% from 491 in October of last year. October 2011 Inventory was at a mid range compared to October of 2010 and 2009. A comparatively lower MSI is more beneficial for sellers while a higher MSI is better for buyers. The October 2011 MSI of 16.7 months was at its highest level compared with October of 2010 and 2009. Market Time The average Days On Market(DOM) shows how many days the average Property is on the Market before it sells. An upward trend in DOM tends to indicate a move towards more of a Buyer's market, a downward trend a move towards more of a Seller's market. The DOM for October was 122, up 34.1% from 91 days last month and up 9.9% from 111 days in October of last year. The October 2011 DOM was at its highest level compared with October of 2010 and 2009. Selling Price per Square Foot The Selling Price per Square Foot is a great indicator for the direction of Property values. Since Median Sales Price and Average Sales price can be impacted by the 'mix' of high or low end Properties in the market, the selling price per square foot is a more normalized indicator on the direction of Property values. The October 2011 Selling Price per Square Foot of $250 was up 4.2% from $240 last month and down -7.7% from $271 in October of last year. Based on information from Greater Fairfield County CMLS, Inc. for the period 11/1/2008 through 10/31/2011. Due to MLS reporting methods and allowable reporting policy, this data is only informational and may not be completely accurate. Therefore, Coldwell Banker Residential Brokerage does not guarantee the data accuracy. Data maintained by the MLS's may not reflect all real estate activity in the market.
  • 3. MARKET ACTION REPORT October 2011 Victoria Blyke Sales Associate (203) 322-2300 City: Stamford victoria.blyke@cbmoves.com http://www.Coldwellbankermoves.com/Victoria.Blyke Price Range: ALL | Properties: Single Family Home Selling Price vs Original Listing Price The Selling Price vs Original Listing Price reveals the average amount that Sellers are agreeing to come down from their original list price. The lower the ratio is below 100% the more of a Buyer's market exists, a ratio at or above 100% indicates more of a Seller's market. The October 2011 Selling Price vs Original List Price of 94.2% was down from 95.7% last month and down from 94.8% in October of last year. Inventory / New Listings / Sales 'This last view of the market combines monthly inventory of Properties for sale along with New Listings and Sales. The graph shows the basic annual seasonality of the market as well as the relationship between these items. The number of New Listings in October 2011 was 88, down - 12.9% from 101 last month and up 7.3% from 82 in October of last year. Based on information from Greater Fairfield County CMLS, Inc. for the period 11/1/2008 through 10/31/2011. Due to MLS reporting methods and allowable reporting policy, this data is only informational and may not be completely accurate. Therefore, Coldwell Banker Residential Brokerage does not guarantee the data accuracy. Data maintained by the MLS's may not reflect all real estate activity in the market.
  • 4. MARKET ACTION REPORT October 2011 Victoria Blyke Sales Associate (203) 322-2300 City: Stamford victoria.blyke@cbmoves.com http://www.Coldwellbankermoves.com/Victoria.Blyke Price Range: ALL | Properties: Single Family Home N 08 D J 09 F M A M J J A S O N D J 10 F M A M J J A S O N D J 11 F M A M J J A S O Homes Sold 36 26 15 22 23 24 35 52 58 60 45 46 60 51 30 29 42 41 44 100 51 44 45 39 28 47 33 34 24 28 59 72 50 70 60 30 3 Mo. Roll Avg 26 21 20 23 27 37 48 57 54 50 50 52 47 37 34 37 42 62 65 65 47 43 37 38 36 38 30 29 37 53 60 64 60 53 (000's) N 08 D J 09 F M A M J J A S O N D J 10 F M A M J J A S O N D J 11 F M A M J J A S O MedianSalePrice 595 510 580 440 582 608 585 533 580 591 595 560 580 575 541 550 578 545 585 658 653 618 580 543 595 532 590 486 563 545 550 523 630 550 600 457 3 Mo. Roll Avg 562 510 534 543 592 575 566 568 589 582 578 572 565 555 556 558 569 596 632 643 617 580 573 557 572 536 546 531 552 539 568 568 593 536 N 08 D J 09 F M A M J J A S O N D J 10 F M A M J J A S O N D J 11 F M A M J J A S O Inventory 482 394 419 453 499 568 594 601 570 545 554 517 435 377 403 421 456 491 503 490 484 462 493 491 452 382 385 404 475 525 543 583 561 518 512 502 MSI 13 15 28 21 22 24 17 12 10 9 12 11 7 7 13 15 11 12 11 5 9 11 11 13 16 8 12 12 20 19 9 8 11 7 9 17 N 08 D J 09 F M A M J J A S O N D J 10 F M A M J J A S O N D J 11 F M A M J J A S O Days On Market 121 110 117 108 121 140 107 91 90 115 107 115 95 81 99 125 140 141 88 95 87 99 96 111 138 91 113 110 116 109 91 104 108 93 91 122 3 Mo. Roll Avg 116 112 115 123 123 113 96 99 104 112 106 97 92 102 121 135 123 108 90 94 94 102 115 113 114 105 113 112 105 101 101 102 97 102 N 08 D J 09 F M A M J J A S O N D J 10 F M A M J J A S O N D J 11 F M A M J J A S O Price per Sq Ft 284 263 241 248 268 282 266 263 278 283 268 251 268 259 250 262 276 279 268 269 251 266 262 271 256 272 264 249 250 263 274 268 246 255 240 250 3 Mo. Roll Avg 263 251 252 266 272 270 269 275 276 267 262 259 259 257 263 272 274 272 263 262 260 266 263 266 264 262 254 254 262 268 263 256 247 248 N 08 D J 09 F M A M J J A S O N D J 10 F M A M J J A S O N D J 11 F M A M J J A S O Sale to List Price 0.939 0.942 0.919 0.938 0.942 0.925 0.936 0.933 0.939 0.940 0.946 0.957 0.939 0.947 0.954 0.957 0.946 0.931 0.943 0.958 0.964 0.966 0.971 0.948 0.952 0.955 0.945 0.944 0.950 0.961 0.952 0.953 0.942 0.961 0.957 0.942 3 Mo. Roll Avg 0.933 0.933 0.933 0.935 0.934 0.931 0.936 0.937 0.942 0.948 0.947 0.948 0.947 0.953 0.952 0.945 0.940 0.944 0.955 0.963 0.967 0.962 0.957 0.952 0.951 0.948 0.946 0.952 0.954 0.955 0.949 0.952 0.953 0.953 N 08 D J 09 F M A M J J A S O N D J 10 F M A M J J A S O N D J 11 F M A M J J A S O New Listings 65 42 99 119 154 157 137 125 105 91 126 109 55 59 111 90 124 161 130 116 103 77 124 82 64 43 77 95 137 147 144 133 93 63 101 88 Inventory 482 394 419 453 499 568 594 601 570 545 554 517 435 377 403 421 456 491 503 490 484 462 493 491 452 382 385 404 475 525 543 583 561 518 512 502 Sales 36 26 15 22 23 24 35 52 58 60 45 46 60 51 30 29 42 41 44 100 51 44 45 39 28 47 33 34 24 28 59 72 50 70 60 30 (000's) N 08 D J 09 F M A M J J A S O N D J 10 F M A M J J A S O N D J 11 F M A M J J A S O Avg Sale Price 649 542 563 526 614 674 661 681 687 775 696 594 669 656 568 629 724 850 724 706 770 715 672 661 628 636 831 561 590 683 732 626 725 688 623 529 3 Mo. Roll Avg 585 544 568 605 650 672 676 715 719 688 653 639 631 618 640 735 766 760 733 730 719 683 654 642 698 676 661 611 668 680 694 680 679 614 Based on information from Greater Fairfield County CMLS, Inc. for the period 11/1/2008 through 10/31/2011. Due to MLS reporting methods and allowable reporting policy, this data is only informational and may not be completely accurate. Therefore, Coldwell Banker Residential Brokerage does not guarantee the data accuracy. Data maintained by the MLS's may not reflect all real estate activity in the market.