1. Volume 70 • Number 1
30
Background: The aim of this study was to assess the prevalence
and extent of gingival recession, gingival bleeding, and dental cal-
culus in United States adults, using data collected in the third
National Health and Nutrition Examination Survey (NHANES III).
Methods: The study group consisted of 9,689 persons 30 to 90
years of age obtained by a stratified, multi-stage probability sam-
pling method in 1988 to 1994. The weighted sample is representa-
tive of U.S. adults 30 years or older and represents approximately
105.8 million civilian, non-institutionalized Americans. Gingival
recession, gingival bleeding, and dental calculus were assessed at
the mesio-buccal and mid-buccal surfaces in 2 randomly selected
quadrants, one maxillary and one mandibular. Data analysis
accounted for the complex sampling design used.
Results: We estimate that 23.8 million persons have one or more
tooth surfaces with ≥3 mm gingival recession; 53.2 million have
gingival bleeding; 97.1 million have calculus; and 58.3 million have
subgingival calculus; and the corresponding percentages are 22.5%,
50.3%, 91.8%, and 55.1% of persons, respectively. The prevalence,
extent, and severity of gingival recession increased with age, as did
the prevalence of subgingival calculus and the extent of teeth with
calculus and gingival bleeding. Males had significantly more gingival
recession, gingival bleeding, subgingival calculus, and more teeth
with total calculus than females. Of the 3 race/ethnic groups stud-
ied, non-Hispanic blacks had the highest prevalence and extent of
gingival recession and dental calculus, whereas Mexican Americans
had the highest prevalence and extent of gingival bleeding. Mexican
Americans had similar prevalence and extent of gingival recession
compared with non-Hispanic whites. Gingival recession was much
more prevalent and also more severe at the buccal than the mesial
surfaces of teeth. Gingival bleeding also was more prevalent at the
buccal than mesial surfaces, whereas calculus was most often
present at the mesial than buccal surfaces.
Conclusions: Dental calculus, gingival bleeding, and gingival
recession are common in the U.S. adult population. In addition to
their unfavorable effect on esthetics and self-esteem, these condi-
tions also are associated with destructive periodontal diseases and
root caries. Appropriate measures to prevent or control these condi-
tions are desirable, and this may also be effective in improving the
oral health of the U.S. adult population. J Periodontol 1999; 70: 30-43.
KEY WORDS
Bleeding/epidemiology; dental calculus/epidemiology; gingival
recession/epidemiology; gingivitis/epidemiology; periodontal
diseases/epidemiology; National Health and Nutrition
Examination Survey III.
*National Institute of Dental and Craniofacial Research, National Institutes of Health, Bethesda, MD.
G
ingival inflammation and dental
calculus are common oral condi-
tions that may predispose persons
with these conditions to destructive peri-
odontal diseases.1,2 Gingivitis is a
reversible condition and does not always
progress to periodontitis.3 However, gin-
givitis is usually the early phase of the
inflammatory process leading to destruc-
tion of periodontal tissues.4,5 Hence, con-
trolling gingivitis may have a profound
health impact as it may result in a lower
prevalence of destructive periodontitis.6
Dental calculus forms as a result of cal-
cification of dental plaque that accumu-
lates on the tooth surface. Calculus
causes retention of dental plaque on its
rough surface, and this can lead to gingi-
val inflammation and to destruction of the
periodontal tissues.1 Ample evidence
exists that calculus is an important risk
factor for destructive periodontitis.2, 7,8
Gingival recession is a condition where
the gingival margin lies against the root
surface of teeth and leads to exposure of
root. In affected persons, recession can
cause pain and increased sensitivity of
teeth, compromise esthetics, and may
even lead to loss of vitality of teeth.
Furthermore, recession is an important
risk factor for the development of root
caries. Gingival recession often results as a
consequence of serious anatomical, patho-
logical, and traumatic factors. Of these,
mechanical trauma due to improper oral
hygiene practices,9 destructive periodontal
diseases, and the use of smokeless
tobacco10 are particularly important fac-
tors leading to gingival recession.
Gingivitis, dental calculus, and gingival
recession affect a large segment of the adult
population. A survey undertaken in 1985 in
U.S. employed adults and seniors found that
43.6% of U.S. adults 18 to 64 years old had
Gingival Recession, Gingival Bleeding, and
Dental Calculus in Adults 30 Years of Age
and Older in the United States, 1988-1994*
J.M. Albandar and A. Kingman
AAP/4315/Jan99-Journal* 7/31/00 5:37 PM Page 30
2. J Periodontol • January 1999 Albandar, Kingman
gingival bleeding, 51.1% had gingival recession, and
53.5% had subgingival calculus. For persons 65 and older,
the survey found that 46.9% had gingival bleeding, 88.3%
had gingival recession, and 65.6% had subgingival calcu-
lus.11
Recently, periodontal findings from phase I of the third
National Health and Nutrition Examination Survey
(NHANES III) were reported.12 The purpose of this report
is to describe and explain the prevalence and extent of
gingival recession, gingival bleeding, and dental calculus
detected in the U.S. adult population using data collected
in both phases of the NHANES III survey during 1988 to
1994. The 6-year survey is a substantially larger study
sample, which enables one to obtain more precise esti-
mates of the periodontal characteristics described.
MATERIALS AND METHODS
Study Group
A nationally representative sample of the United States
population was obtained by a stratified, multi-stage prob-
ability sampling method and was examined in 2 phases
in the NHANES III survey during 1988 to 1994.13,14 The
survey was designed to study the health and nutritional
status of the U.S. population overall and for specific
racial/ethnic subgroups.15,16 The oral health component
of the survey is described in detail elsewhere.17
The NHANES III survey examined persons 2 months
or older. There were 11,111 dentate persons 30 years
or older who received a health examination, and
10,740 (96.7%) of these also had a dental examination.
For the periodontal examination, 933 (8.7%) persons
were excluded for medical reasons, and 118 (1.1%)
persons were excluded for various other reasons.
The group who received a periodontal examination
consisted of 9,689 individuals aged 30 to 90, represent-
ing approximately 105.8 million civilian, non-institu-
tionalized Americans. They included 4,594 (47.4%)
males and 5,095 (52.6%) females; 3,956 (40.8%) non-
Hispanic whites, 2,699 (27.9%) non-Hispanic blacks,
and 2,636 (27.2%) Mexican Americans; and 398
(4.1%) persons of other race/ethnic groups.
Clinical Examination
Clinical oral health examinations were conducted by trained
dentists and were done in 2 mobile examination centers
that also comprised fully equipped dental units. Periodontal
conditions evaluated included gingival bleeding, dental cal-
culus, and gingival recession, which were assessed at the
mesio-buccal (mesial) and mid-buccal (buccal) tooth sur-
faces. The assessments were made on all fully erupted
teeth in 2 randomly selected quadrants, one maxillary and
one mandibular. Third molars were excluded. Hence, each
participant had between 1 and 14 teeth examined.
The teeth were dried with air, and the National
Institute of Dental Research (NIDR) periodontal probe
was inserted not more than 2 mm into the gingival
sulcus starting just distal to the midpoint of the buccal
surface and moving into the mesial interproximal area
to assess gingival bleeding. Bleeding sites were scored
after the sites of a single quadrant were probed.
The teeth were again dried with air and assessed for
dental calculus. Supragingival calculus was defined as
calcified deposits located on exposed crown and root
surfaces and that extended up to 1 mm below the free
gingival margin (FGM). Subgingival calculus was
defined as calcified deposits that were located more
than 1 mm below the FGM. The NIDR probe was used
in these assessments. Each site was scored as
supragingival calculus present, but subgingival calculus
not identified; subgingival calculus only present; or
supragingival and subgingival calculus both present.
The distance from the cemento-enamel junction
(CEJ) to the FGM was assessed in millimeters using the
NIDR probe and was rounded to the lowest whole mil-
limeter. Gingival recession was defined as the CEJ/FGM
distance when the gingival margin was located on the
root. For sites where the gingival margin was on the
crown, the gingival recession score was regarded as zero.
Classification by Gingival State
Individuals were classified according to their gingival
condition using the following criteria:
Extensive gingivitis: 5 or more teeth (or 50% or more
of the teeth examined) with gingival bleeding.
Limited gingivitis: 2 to 4 teeth (or 25% to 50% of the
teeth examined) with gingival bleeding.
Individuals with six or more teeth present (out of a
maximum of 28 teeth) were classified according to the
above criteria. Individuals who did not fulfill these crite-
ria were regarded as not having an appreciable level of
gingival inflammation.
Data Analysis
The prevalence of a periodontal characteristic was
defined as the percentage of persons with at least one
site having the characteristic. The extent of a periodontal
characteristic was defined as the percentage of teeth
within the person with the characteristic.
Total calculus was defined as the presence of any
calculus deposits on a given tooth surface and was pre-
sent for scores of 1 (supragingival but not subgingival
calculus) or 2 (subgingival calculus only, or supragingi-
val and subgingival calculus).
The race/ethnicity variable was derived from ques-
tions on race and ethnicity self-reported during a
household interview. In this paper, the term whites is
used to designate non-Hispanic whites, and blacks is
used for non-Hispanic blacks.
The NHANES III survey involved a complex sampling
design, and the data analysis accounted for this by using
SUDAAN18 to calculate standard errors. The prevalence
and extent of the periodontal characteristics gingival
bleeding, recession, and calculus were reported by age
group. The 1990 Census estimates of the U.S. popula-
31
AAP/4315/Jan99-Journal* 7/31/00 5:37 PM Page 31
3. Gingival Bleeding, Recession, and Calculus in American Adults Volume 70 • Number 1
32
tion were used for standardization of the data to adjust for
differences in age in the subpopulations. Gender and
race/ethnicity standardized the all-persons estimates,
whereas estimates for males and females were standard-
ized by race/ethnicity, and estimates for whites, blacks,
and Mexican Americans were standardized by gender.
Persons of other race/ethnicity were included in the all-
persons estimates only. The prevalence and extent of the
characteristics under study were then compared among
gender and race/ethnic groups. For gingival recession,
the comparison used estimates that were standardized
also by age cohort, and for gingival bleeding and calcu-
lus, the comparison was made within age cohorts.
Measurement Reliability
In the NHANES III, the examiners used standard exami-
nation environment and methodology, standard state-
of-the-art equipment, and detailed written instructions
for all procedures.17 The protocol was aimed at reduc-
ing systematic and random measurement errors and
quantifying what error remained. The dental examiners
received formal training and calibration in assessing the
periodontal and other oral variables both before and
during the study. Intra-examiner reliability assessments
were based on replicate examinations conducted on
random recall samples of roughly 20 study participants
at each of the NHANES III 89 survey locations.
Interexaminer bias and reliability were evaluated indi-
rectly by making separate com-
parisons of each survey examiner
with the “reference” examiner.
Gingival bleeding and calculus
were not included in the inter-
examiner reliability study because
both examiners evaluated the
patients at the same session.
Gingival bleeding scores for the
intra-examiner sessions reflect
scores obtained several days or
even weeks apart, and therefore
may not reflect examiner differ-
ences, but a combination of
examiner and disease state
changes.
For continuous type responses
such as subject level counts, the
intraclass correlation coefficients
were used to estimate inter- and
intra-examiner reliability. The intra-
class correlation coefficients for
mean and extent scores of calculus
and recession were between 0.82
and 0.98. The inter- and intra-
examiner reliability of qualitative
subject level prevalence (maxi-
mum) scores and all site-based
calculus and recession level measurements were
assessed by weighted and unweighted (exact) kappa
statistics. The exact kappa coefficients for interexaminer
reliability of subject level prevalence scores ranged
between 0.45 and 0.60, and the weighted kappas (within
Ϯ1 mm) ranged between 0.72 and 0.88. Examiner
agreement on recession level was higher than for either
probing depth or attachment level (not reported here,
see reference 19). However, the lower values of exact
kappa suggest that some differences exist among the
examiners regarding prevalence values, since a 1 mm
difference could affect these values to some degree.
RESULTS
Gingival Recession
The prevalence of ≥1 mm recession in persons 30
years and older was 58%, representing 61.3 million
adults, and the extent of ≥1 mm recession averaged
22.3% teeth per person. The extent of ≥1 mm recession
was 38.4% teeth per person among persons with gingi-
val recession. The prevalence (Table 1) and extent
(Table 2) of recession increased steadily with the age of
the cohort, regardless of the threshold level used in
defining recession. In the youngest age cohort (30 to
39 years), the prevalence of recession was 37.8% and
the extent averaged 8.6% teeth. In contrast, the oldest
cohort, aged 80 to 90 years, had a prevalence of 90.4%
(more than twice as high), and the extent averaged
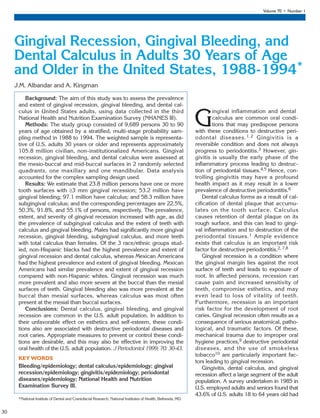
Figure 1.
Percentage of teeth by amount of gingival recession, tooth type, and age group.
Central incisors: 1, second molars: 7.
Gingival recession
30-55 years 56-90 years
1-2 mm 3+ mm
%teeth%teeth
Maxillary
Mandibular Mandibular
Tooth
type
Maxillary
AAP/4315/Jan99-Journal* 7/31/00 5:37 PM Page 32
6. J Periodontol • January 1999 Albandar, Kingman
35
56.3% teeth (more than six times as large). A compari-
son by gender and race/ethnicity showed that the
prevalence and extent of recession were significantly
higher in males than females (P< 0.001) after adjusting
for age and race/ethnicity, and in blacks than in whites
(P< 0.002), after adjusting for age and gender
(Table 3). The prevalence and extent of gingival
recession among Mexican Americans were similar to
those found among whites.
At the tooth level, gingival recession was most preva-
lent for the maxillary first molars and the mandibular
central incisors (Fig. 1). In persons 56 to 90 years old,
the prevalence of recession for these teeth was 48.4%
and 49.7% of teeth, respectively. Large differences in
tooth-specific prevalences of gingival recession were evi-
dent by age group for all tooth types (Fig. 1). At the site
level, the buccal sites exhibited much higher prevalence
Figure 2.
Percentage of sites by amount of gingival recession, age, gender, and
race/ethnic groups.
Figure 3.
Percentage of teeth with gingival bleeding, by tooth type and age group.
Central incisors: 1, second molars: 7.
Table 3.
Comparison of Prevalence and Extent of Gingival Recession by Gender and Race/Ethnicity
Gender* Race/Ethnicity†
Males Females Non-Hispanic Non-Hispanic Mexican
Gingival Whites Blacks Americans
Recession % S.E. % S.E. P % S.E. % S.E. P % S.E. P
Persons
(prevalence)
≥1 mm 61.32 1.21 54.87 1.02 0.0002 57.94 0.90 59.52 0.95 0.2 54.19 1.58 0.03
≥2 mm 44.88 1.31 36.77 1.28 0.0001 39.83 1.26 46.55 0.98 0.0001 40.07 1.13 0.9
≥3 mm 27.42 1.32 17.76 1.01 0.0001 21.62 1.14 27.82 1.00 0.0001 23.50 1.13 0.22
≥4 mm 15.99 0.91 9.36 0.64 0.0001 11.71 0.68 18.13 0.94 0.0001 12.64 0.78 0.34
≥5 mm 7.51 0.62 3.70 0.39 0.0001 4.89 0.46 10.35 0.66 0.0001 6.35 0.59 0.04
Teeth (extent)
<1 mm 74.72 0.63 80.46 0.60 78.02 0.54 75.06 0.80 79.03 0.93
1 mm 9.06 0.38 8.57 0.38 9.01 0.36 7.87 0.60 7.15 0.83
2 mm 8.06 0.31 6.10 0.27 6.90 0.21 7.93 0.33 6.94 0.29
3 mm 3.66 0.24 2.69 0.22 3.07 0.23 3.74 0.20 3.39 0.23
4 mm 2.42 0.16 1.39 0.16 1.77 0.12 2.53 0.23 1.86 0.13
≥5 mm 2.08 0.23 0.80 0.10 1.23 0.15 2.87 0.27 1.62 0.19
≥1 mm 25.28 0.63 19.54 0.60 0.0001 21.98 0.54 24.94 0.80 0.002 20.97 0.93 0.4
*Standardized by age and race/ethnicity.
†Standardized by age and gender.
Gingival recession
30-55 years 56-90 years
1-2 mm 3+ mm
% sites
%teeth%teeth
Maxillary
Mandibular Mandibular
Tooth
type
Maxillary
AAP/4315/Jan99-Journal* 7/31/00 5:37 PM Page 35
7. Gingival Bleeding, Recession, and Calculus in American Adults Volume 70 • Number 1
36
Table 5.
Mean Percentage of Teeth With Gingival Bleeding by Age Cohort, and Gender and Race/Ethnic Group
Gender* Total†
Males Females
Age (Years) % S.E. % S.E. P % S.E.
30-39 13.09 1.18 9.55 1.10 0.0005 11.27 1.04
40-49 13.63 1.22 10.79 0.74 0.02 12.17 0.83
50-59 16.68 1.09 14.56 1.37 0.21 15.60 1.00
60-69 17.61 1.58 15.11 1.17 0.08 16.31 1.20
70-79 21.78 1.96 15.90 1.19 0.005 18.76 1.26
80-90 23.37 2.11 19.07 2.73 0.1 21.12 2.07
Total 15.02 0.97 12.11 0.81 0.0001 13.52 0.84
Race/Ethnicity‡
Non-HispanicWhites Non-Hispanic Blacks MexicanAmericans
% S.E. % S.E. P % S.E. P
30-39 10.39 1.13 14.54 1.40 0.003 18.00 1.25 0.0001
40-49 11.52 0.92 13.88 1.08 0.05 18.53 1.31 0.0002
50-59 14.56 1.06 20.65 1.80 0.001 20.63 2.08 0.007
60-69 15.16 1.36 21.35 1.89 0.007 23.58 1.95 0.0004
70-79 17.04 1.42 25.09 2.97 0.02 31.86 2.67 0.0001
80-90 19.81 2.33 28.07 6.53 0.3 27.14 4.21 0.2
Total 12.72 0.90 16.57 1.06 0.0002 19.37 1.26 0.0001
*Standardized by race/ethnicity.
†Standardized by gender and race/ethnicity.
‡Standardized by gender.
Table 4.
Prevalence of Persons With Gingival Bleeding by Age Cohort, and Gender and Race/Ethnic Group
Gender* Total†
Males Females
Age (years) % S.E. % S.E. P % S.E.
30-39 54.02 3.02 41.82 3.46 0.001 47.78 2.75
40-49 50.59 2.98 45.55 2.29 0.13 48.00 2.11
50-59 56.69 3.52 49.07 3.04 0.06 52.76 2.63
60-69 56.91 3.47 50.16 3.32 0.03 53.45 3.04
70-79 62.09 3.32 51.88 2.99 0.007 56.83 2.60
80-90 60.86 3.53 57.12 4.39 0.5 58.93 2.78
Total 54.42 2.26 46.28 2.25 0.0001 50.25 2.10
Race/Ethnicity ‡
Non-HispanicWhites Non-Hispanic Blacks MexicanAmericans
% S.E. % S.E. P % S.E. P
30-39 45.74 3.07 55.06 3.28 0.01 63.03 2.97 0.0001
40-49 46.39 2.47 52.26 2.21 0.08 63.96 2.08 0.0001
50-59 51.26 2.86 59.17 2.82 0.02 62.22 5.83 0.07
60-69 52.05 3.54 57.80 2.39 0.2 65.66 3.88 0.006
70-79 54.91 3.02 63.22 4.81 0.2 73.00 4.55 0.0003
80-90 57.30 3.07 66.10 7.98 0.3 68.93 10.04 0.3
Total 48.62 2.32 55.68 2.22 0.005 63.61 2.48 0.0001
*Standardized by race/ethnicity.
†Standardized by gender and race/ethnicity.
‡Standardized by gender.
AAP/4315/Jan99-Journal* 7/31/00 5:37 PM Page 36
8. J Periodontol • January 1999 Albandar, Kingman
37
and more severe recession than mesial sites within each
age, gender, and race/ethnic group (P< 0.0001) (Fig. 2).
Gingival Bleeding
Half of all adult persons had gingival bleeding in one
or more sites (Table 4). The extent of gingival
bleeding was 13.5% of teeth in the overall adult popula-
tion (Table 5), and 26.8% of teeth within persons with
evidence of gingival bleeding. There was a small
increase in the prevalence of gingival bleeding with age,
but a more marked increase in the extent of
gingival bleeding (Tables 4 and 5). The prevalence and
extent of gingival bleeding were significantly higher in
males than in females (P< 0.0001), and in blacks (P <
0.005) and Mexican Americans (P < 0.0001) than in
whites. At the tooth level, second molars and canines
showed the highest percentage of teeth with
gingival bleeding (Fig. 3). At the site level,
gingival bleeding was more common at the buccal
than mesial surfaces of teeth within subgroups of age,
gender, and race/ethnicity (P <0.0001) (Fig. 4).
Figure 4.
Percentage of sites with gingival bleeding, by tooth surface, age,
gender, and race/ethnic groups.
Table 6.
Prevalence of Persons With Total Dental Calculus (Supra- and Subgingival),
by Age Cohort, and Gender and Race/Ethnic Group
Gender* Total†
Males Females
Age (Years) % S.E. % S.E. P % S.E.
30-39 90.81 1.73 90.41 1.77 0.8 90.59 1.53
40-49 92.66 1.79 91.24 1.92 0.4 91.92 1.68
50-59 95.27 1.35 92.62 1.74 0.2 93.91 1.22
60-69 93.01 1.85 89.34 2.34 0.2 91.14 1.68
70-79 93.24 1.66 92.00 1.71 0.6 92.64 1.30
80-90 92.84 2.05 95.20 1.82 0.3 94.04 1.63
Total 92.51 1.23 91.07 1.26 0.09 91.76 1.18
Race/Ethnicity‡
Non-HispanicWhites Non-Hispanic Blacks MexicanAmericans
% S.E. % S.E. P % S.E. P
30-39 89.60 1.75 95.19 1.30 0.002 96.35 1.21 0.002
40-49 90.89 1.97 96.86 0.70 0.003 97.47 0.76 0.002
50-59 93.93 1.35 93.27 2.42 0.8 94.81 2.05 0.7
60-69 89.94 1.99 97.74 0.77 0.0003 95.10 1.06 0.02
70-79 91.61 1.50 96.87 1.72 0.02 99.02 0.70 0.0001
80-90 92.96 1.92 100 0 0.0006 98.54 1.33 0.01
Total 90.91 1.33 95.79 0.96 0.0003 96.40 0.92 0.0004
*Standardized by race/ethnicity.
†Standardized by gender and race/ethnicity.
‡Standardized by gender.
% sites
AAP/4315/Jan99-Journal* 7/31/00 5:37 PM Page 37
9. Gingival Bleeding, Recession, and Calculus in American Adults Volume 70 • Number 1
38
Table 7.
Mean Percentage of Teeth With Total Dental Calculus (Supra- and Subgingival),
by Age Cohort, and Gender and Race/Ethnic Group
Gender* Total†
Males Females
Age (Years) % S.E. % S.E. P % S.E.
30-39 50.97 2.31 39.89 1.84 0.0001 45.27 1.79
40-49 54.45 2.12 44.09 1.98 0.0001 49.11 1.89
50-59 57.56 1.86 49.91 2.37 0.002 53.61 1.81
60-69 61.11 2.16 49.60 2.18 0.0001 55.21 1.91
70-79 63.27 2.47 55.72 1.97 0.001 59.41 1.95
80-90 66.49 3.12 67.68 3.34 0.8 67.07 2.54
Total 55.16 1.62 45.75 1.46 0.0001 50.32 1.46
Race/Ethnicity‡
Non-HispanicWhites Non-Hispanic Blacks MexicanAmericans
% S.E. % S.E. P % S.E. P
30-39 41.88 2.04 63.32 1.85 0.0001 58.67 2.41 0.0001
40-49 45.29 2.12 69.88 1.93 0.0001 63.56 2.66 0.0001
50-59 49.93 2.05 73.72 4.04 0.0001 67.58 4.05 0.0002
60-69 50.46 2.19 81.53 2.47 0.0001 71.56 2.87 0.0001
70-79 54.73 2.27 83.42 2.68 0.0001 79.92 3.01 0.0001
80-90 61.95 2.89 95.48 2.49 0.0001 86.47 5.64 0.0001
Total 46.78 1.59 69.82 1.89 0.0001 63.13 2.31 0.0001
*Standardized by race/ethnicity.
†Standardized by gender and race/ethnicity.
‡Standardized by gender.
Table 8.
Prevalence of Persons With Subgingival Dental Calculus, by Age Cohort,
and Gender and Race/Ethnic Group
Gender* Total†
Males Females
Age (years) % S.E. % S.E. P % S.E.
30-39 53.54 3.34 44.60 4.52 0.003 48.92 3.73
40-49 60.30 3.38 45.55 4.01 0.0001 52.72 3.39
50-59 64.13 3.38 53.74 4.70 0.02 58.80 3.55
60-69 70.35 3.10 54.47 4.09 0.0001 62.23 3.31
70-79 70.22 3.11 62.90 3.55 0.02 66.45 3.00
80-90 73.89 4.41 73.68 3.63 0.97 73.77 3.07
Total 60.58 2.62 49.93 3.61 0.0001 55.10 3.03
Race/Ethnicity‡
Non-HispanicWhites Non-Hispanic Blacks MexicanAmericans
% S.E. % S.E. P % S.E. P
30-39 44.41 4.23 71.12 2.60 0.0001 71.59 4.33 0.0001
40-49 48.08 3.78 76.95 2.87 0.0001 72.01 3.21 0.0001
50-59 55.72 4.16 72.89 4.09 0.005 75.86 5.06 0.002
60-69 57.72 3.83 85.70 2.93 0.0001 80.39 2.67 0.0001
70-79 62.65 3.37 86.51 3.90 0.0001 82.30 4.78 0.0005
80-90 69.68 3.59 96.98 2.28 0.0001 87.71 7.30 0.03
Total 51.08 3.38 75.56 2.19 0.0001 73.39 3.51 0.0001
*Standardized by race/ethnicity.
†Standardized by gender and race/ethnicity.
‡Standardized by gender.
AAP/4315/Jan99-Journal* 7/31/00 5:37 PM Page 38
10. J Periodontol • January 1999 Albandar, Kingman
39
Dental Calculus
Overall, the prevalence of total calculus was 91.8%,
representing 97 million adults, and the extent was
50.3% of teeth per person.
The prevalence of subgingi-
val calculus was 55.1%, rep-
resenting 58.3 million adults,
and the extent was 27.4% of
teeth per person. When only
affected persons were
assessed (i.e., those with at
least one site with a given
type of calculus), the mean
percentage of teeth with cal-
culus was 48.5%, and 54.7%
with subgingival calculus.
The prevalence of calculus
was similar among the differ-
ent age groups. However, the
extent of calculus and the
prevalence and extent of
subgingival calculus
increased with age (Tables
6-9). For the youngest age
group, 30 to 39 years, the
prevalence and extent of
total calculus were 90.6%
persons and 45.3% teeth; for
subgingival calculus, the
prevalence was 48.9% per-
sons and the extent was
22.9% teeth, respectively. In contrast, for the oldest age
cohort, 80 to 90 years, the corresponding prevalence
and extent for total calculus were 94% persons and
Figure 5.
Percentage of teeth with supra- and/or subgingival calculus, and the percentage of teeth with subgingival
calculus, by tooth type and age group. Central incisors: 1, second molars: 7.
Table 9.
Mean Percentage of Teeth With Subgingival Dental Calculus,
by Age Cohort, and Gender and Race/Ethnic Group
Gender* Total†
Males Females
Age (Years) % S.E. % S.E. P % S.E.
30-39 27.69 2.42 18.37 2.24 0.0001 22.88 2.12
40-49 30.27 1.87 20.56 2.30 0.0001 25.24 1.94
50-59 34.75 2.17 26.13 2.62 0.002 30.31 2.01
60-69 39.84 2.56 27.22 2.63 0.0001 33.34 2.39
70-79 41.57 2.60 34.16 2.12 0.003 37.75 2.05
80-90 47.15 4.46 44.66 3.26 0.6 45.86 3.10
Total 32.04 1.77 23.11 1.88 0.0001 27.43 1.76
Race/Ethnicity‡
Non-HispanicWhites Non-Hispanic Blacks MexicanAmericans
% S.E. % S.E. P % S.E. P
30-39 19.43 2.40 41.40 2.11 0.0001 36.73 2.57 0.0001
40-49 21.09 2.12 48.15 2.62 0.0001 40.78 2.06 0.0001
50-59 25.96 2.23 53.83 3.87 0.0001 47.19 4.37 0.0001
60-69 27.58 2.73 65.49 2.99 0.0001 53.42 2.59 0.0001
70-79 32.05 2.28 68.64 3.78 0.0001 59.91 5.45 0.0001
80-90 38.93 3.64 83.56 3.23 0.0001 72.97 7.54 0.0002
Total 23.50 1.92 49.31 2.02 0.0001 41.55 2.31 0.0001
*Standardized by race/ethnicity.
†Standardized by gender and race/ethnicity.
‡Standardized by gender.
Dental Calculus
30-55 years 56-90 years
Supra- and Subgingival Subgingival
%teeth%teeth
Maxillary
Mandibular Mandibular
Tooth
type
Maxillary
AAP/4315/Jan99-Journal* 7/31/00 5:37 PM Page 39
11. Gingival Bleeding, Recession, and Calculus in American Adults Volume 70 • Number 1
40
67.1% teeth; and for subgingival calculus, 73.8% per-
sons and 45.9% teeth, respectively.
Males had a similar prevalence of total calculus to
that of females, but had a significantly higher extent of
total calculus, and higher prevalence and extent
of subgingival calculus than females (P < 0.0001)
(Tables 6-9). A comparison by race/ethnicity showed
that the prevalence and extent of total calculus and
subgingival calculus were significantly higher in blacks
and Mexican Americans than in whites.
Tooth-specific analyses showed that dental calculus was
more prevalent at maxillary molars and mandibular
incisors and canines (Fig. 5). Site-level comparisons
showed that the prevalences of total calculus and subgingi-
val calculus were consistently higher at the mesial than
buccal sites within subgroups of age, gender, and race/
ethnicity (P < 0.0001) (Figs. 6 and 7).
Classification by Extent of Gingival Inflammation
Of the sample examined, 258 persons were not classi-
fied because they had fewer than 6 remaining teeth.
The rest of the sample represented 103.67 million
Americans aged 30 and older in 1988 to 1994. Among
the 103.7 million U.S. adults, 32% had limited or exten-
sive gingivitis. By severity level, 10.5% (or 10.9 million
persons) had extensive gingivitis, 21.8% (22.6 million
persons) had limited gingivitis, and 67.7% (70.2 million
persons) were without appreciable level of overt gingi-
val inflammation (Table 10). The percentage of persons
with gingivitis in each 5-year age group from 30 to 74
years remained steady, with approximately 31.1% to
33.5% of the persons having limited or extensive gingi-
val inflammation (Figs. 8 and 9). In the age group 75
years and older, the prevalence of gingival inflamma-
tion increased slightly, and in the age group 85 to 90
years, 37.8% of the subjects had overt gingivitis.
DISCUSSION
This study shows that gingival recession, gingival
bleeding, and dental calculus are common among the
adult population in the U.S. Of the 3 parameters
assessed in this study, dental calculus was the most
prevalent. Although 9 out of 10 U.S. adults had some
dental calculus on roughly 50% of their teeth, more
concern is warranted regarding the observation that
Figure 6.
Percentage of sites with supra- and/or subgingival calculus, by tooth
surface, age, gender, and race/ethnic groups.
Figure 7.
Percentage of sites with subgingival calculus, by tooth surface, age, gender,
and race/ethnic groups.
mesial
mesial
% Sites
% Sites
buccal
buccal
AAP/4315/Jan99-Journal* 7/31/00 5:37 PM Page 40
12. J Periodontol • January 1999 Albandar, Kingman
41
over 50% of these adults had evidence of subgingival
calculus that was fairly widespread (27.9% of their
teeth). Dental plaque is the cause of chronic gingival
inflammation and periodontal attachment loss.20,21
Dental calculus is plaque that has been mineralized,
and is covered on its external surface by unmineralized
plaque.7 The prevalence of calculus in a population is a
fairly good measure of the oral hygiene level and
frequency of professional dental care. Calculus can
promote and retain plaque and plaque products
because it is porous and has a rough surface.1 Hence,
the presence of calculus is an important risk factor for
occurrence and progression of attachment loss.2
Roughly 50% of these adults also experience gingival
bleeding, although it is not as widespread as subgingi-
val calculus. This percentage remained fairly constant
across age groups. This find-
ing is consistent with many
previously published find-
ings, i.e., that even though
gingival bleeding remains rel-
atively high and constant,
fewer persons develop the
more aggressive forms of
periodontal disease. However,
as yet, we are unable to
distinguish between gingivitis
lesions that will progress
into periodontitis from those
that will not. Optimal oral
hygiene can prevent gingivi-
tis,22 and it is reasonable to
conclude that the control of
gingival inflammation can be
beneficial to the population at
large. Consistent with this
view is the epidemiological
data showing that popula-
tions with fairly good oral
hygiene have better peri-
odontal health than popula-
tions with poor oral hygiene.20
This concern is more rele-
vant for males than females,
because males had signifi-
cantly more gingival bleed-
ing and subgingival calculus
than females.
Of the 3 race/ethnic
groups studied, blacks had
the highest prevalence and
extent of gingival recession
and dental calculus, whereas
Mexican Americans had the
highest prevalence and
extent of gingival bleeding.
Notably, Mexican Americans
had similar prevalence and extent of gingival recession
compared with whites. However, there was a different
pattern of recession between the 2 groups. Whites and
Mexican Americans, respectively, had 17.5% and 12.9%
of buccal surfaces, but comparable percentages of
mesial surfaces, with ≥1 mm recession. And because
examination of the same persons has showed that
attachment loss is more prevalent in Mexican
Americans, and also more prevalent at the mesial than
buccal surfaces,19 this suggests that behavioral varia-
tions such as oral hygiene habits may be associated
with the observed difference.
These findings also indicate that there was a
significant increase in prevalence, extent, and severity
of gingival recession with age. Gingival recession is
Figure 9.
Percentage of individuals with extensive or limited gingivitis, by age and race/ethnic groups.
Figure 8.
Percentage of individuals with extensive or limited gingivitis among U.S. adults examined during 1988
to 1994, by age and gender.
Classification of gingivitis
Limited Extensive
%subjects
Males
Age (years) Age (years)
Females
Classification of gingivitis
Limited Extensive
%subjects
non-Hispanic
whites
non-Hispanic
blacks
Mexican-Americans
Age (years) Age (years) Age (years)
AAP/4315/Jan99-Journal* 7/31/00 5:37 PM Page 41
13. Gingival Bleeding, Recession, and Calculus in American Adults Volume 70 • Number 1
42
thought to occur primarily as a consequence of peri-
odontal diseases and aggressive use of mechanical oral
hygiene measures, although anatomical and other
factors also may be involved.9 Gingival recession can
cause thermal sensitivity of teeth and increased risk
of root caries, and is also one of the main esthetic
complaints of persons seeking reconstructive periodon-
tal therapy.23
There are relatively few data on the prevalence and
extent of gingival recession, gingival bleeding and cal-
culus in the general population. The 1985 to 1986
National Survey of Oral Health in U.S. Employed
Adults and Seniors11 employed examination criteria
and methods similar to those used in the NHANES III
survey. In that survey, the reported prevalence for gingi-
val recession, gingival bleeding and subgingival calcu-
lus among adults 30 years and older ranged between
48.4% and 89.8%, 40% and 49.6%, and 51.9% and
67.9%, respectively. The bleeding and recession figures
are lower than those we observed in the NHANES III
survey, but the subgingival calculus values are quite
similar. One explanation for this difference is that the
NHANES III examined employed as well as unem-
ployed persons.
Two other regional surveys have assessed these con-
ditions among adults. Christersson et al.24 assessed the
level of gingival bleeding and subgingival calculus in a
group of 508 mostly white adults 25 to 73 years of age
from Erie County in New York, and found that, on aver-
age, 39% and 40% of the teeth had gingival bleeding
and subgingival calculus, respectively. These results
were much higher than the findings for extent reported
in this study. However, in the cited study, the assess-
ment of gingival bleeding and subgingival calculus used
the entire circumference of the tooth and all 4 quad-
rants of each person.
A recent survey in New England of seniors 70 to 96
years old found that 85% and 89% of the persons had
gingival bleeding and calculus, respectively.25 In
contrast, gingival bleeding and calculus were found in
58% and 93% of 70- to 90-year-old persons in the
present study. The New England survey employed a
full-mouth examination and examined the full circum-
ference of each tooth.
The 2 major national surveys, the 1985 to 1986
Survey of Oral Health in U.S. Employed Adults and
Seniors and the 1988 to 1994 NHANES III, assessed
periodontal parameters for 2 sites per tooth, the mesio-
buccal and mid-buccal sites, and 2 randomly selected
quadrants, one maxillary and one mandibular, per per-
son. The partial recording system used in these surveys
is based on an assessment of, at most, 28 tooth sites
per subject and therefore can significantly underesti-
mate the prevalence of any clinical parameter, espe-
cially when compared with a study whose findings are
based on a potential 168 sites per subject. Its effect on
extent estimates is less certain and probably much
more variable. Also, a relatively high percentage of
tooth loss has been reported in this population,
particularly in the older age cohort,19 and this may also
have modulated the reported prevalence of these
parameters.
Table 10.
Percentage and Estimated Number of Individuals 30 to 90 Years Old From NHANES III
Survey by Classification According to Gingival Status and Age
Gingival Status
Extensive Gingivitis Limited Gingivitis No Gingivitis
Age (Years) % No.* % No.* % No.*
30-34 8.36 1,658 22.99 4,560 68.65 13,620
35-39 11.03 2,027 20.46 3,760 68.51 12,590
40-44 9.66 1,619 20.98 3,516 69.36 11,620
45-49 8.00 903 22.96 2,592 69.04 7,794
50-54 12.91 1,075 21.61 1,799 65.48 5,452
55-59 10.40 781 23.18 1,741 66.42 4,989
60-64 10.61 686 21.00 1,357 68.39 4,419
65-69 14.48 838 20.18 1,167 65.34 3,779
70-74 11.58 528 21.90 998 66.52 3,032
75-79 17.58 432 23.22 571 59.20 1,455
80-84 15.32 242 24.55 387 60.13 949
85-90 15.17 111 22.64 165 62.19 453
Total 10.50 10,900 21.80 22,613 67.70 70,152
*The numbers of individuals (in thousands) represent estimates within a total of 103.6 million adult persons in the U.S. population (across all genders and
race/ethnicity) who had 6 or more remaining teeth.
AAP/4315/Jan99-Journal* 7/31/00 5:37 PM Page 42
14. J Periodontol • January 1999 Albandar, Kingman
The medical exclusion criteria used in the NHANES
III survey may also have caused a bias in the assess-
ment of the parameters studied here. The exclusion cri-
teria were as follows: present or past history of medical
conditions that may pose a health risk to the survey
participant if an invasive periodontal examination was
undertaken. Such conditions included cardiovascular
problems and other conditions that might require
antibiotic coverage before a periodontal examination.
There is evidence suggesting that persons with certain
cardiovascular diseases may have a higher occurrence
of periodontal diseases than healthy persons.26
Therefore, it is likely that the prevalence and extent of
gingivitis, calculus, and gingival recession, particularly
in persons 50 years and older, may be higher than what
is reported in this study.
This study examined a representative sample of the
U.S. population in 1988 to 1994. The results show that
dental calculus, gingival bleeding, and gingival reces-
sion are common in the U.S. adult population. As the
U.S. adult population becomes older (one projection
states that by the year 2010 approximately 20% of the
U.S. population will be 65 years or older), and more
adults retain more of their natural teeth, the need for
more effective prevention practices is evident. Not only
will it improve the level of oral health of the population,
but may also produce great cost savings by reducing
the need for periodontal treatment of advanced
periodontal disease in the older populations.
REFERENCES
1. Mandel ID. Calculus update: Prevalence, pathogenicity
and prevention. J Am Dent Assoc 1995;126:573-580.
2. Albandar JM, Kingman A, Brown LJ, Löe H. Gingival
bleeding and subgingival calculus as determinants of
disease progression in early-onset periodontitis. J Clin
Periodontol 1998;25:231-237.
3. Ranney RR. Pathogenesis of gingivitis. J Clin
Periodontol 1986; 13:356-359.
4. Greene JC. Oral hygiene and periodontal disease. Am
J Public Health 1963;53:913-922.
5. Schroeder HE, Attström R. Pocket formation: A
hypothesis. In: Lehner T, Cimasoni G, eds. The
Borderland Between Caries and Periodontal Disease II.
London: Academic Press; 1980: 99-123.
6. Page RC. Gingivitis. J Clin Periodontol 1986; 13:345-355.
7. Mandel ID, Gaffar A. Calculus revisited: A review. J Clin
Periodontol 1986;13:249-257.
8. Albandar JM, Rise J, Abbas DK. Radiographic
quantification of alveolar bone level changes. Predictors
of longitudinal bone loss. Acta Odontol Scand 1987;
45: 55-59.
9. Smith RG. Gingival recession. Reappraisal of an
enigmatic condition and a new index for monitoring.
J Clin Periodontol 1997;24:201-205.
10. The American Academy of Periodontology. Tobacco
use and the periodontal patient. J Periodontol
1996;67:51-56.
11. Miller AJ, Brunelle JA, Carlos JP, Brown LJ, Löe H. The
National Survey of Oral Health in U.S. Employed Adults
and Seniors: 1985-1986. National Findings. U.S.
Bethesda, MD: Department of Health and Human
Services, Public Health Service, National Institutes of
Health. 1987. NIH publication no. 87-2868.
12. Brown LJ, Brunelle JA, Kingman A. Periodontal status
in the United States, 1988-1991: Prevalence, extent, and
demographic variation. J Dent Res 1996;75:672-683.
13. U.S. Department of Health and Human Services,
National Center for Health Statistics. NHANES III
Reference Manuals and Reports (CD-ROM). Hyattsville,
MD: Centers for Disease Control and Prevention; 1996.
14. U.S. Department of Health and Human Services,
National Center for Health Statistics. National Health
and Nutrition Examination Survey, III 1988-94, NHANES
III Examination Data File (CD-ROM). Hyattsville, MD:
Centers for Disease Control and Prevention; 1997.
Public use data file documentation number 76200.
15. Ezzati TM, Massey JT, Waksberg J, Chu A, Maurer KR.
Sample design: Third National Health and Nutrition
Examination Survey. Vital Health Stat 2 1992;113:1-35.
16. National Center for Health Statistics. Plan and operation
of the Third National Health and Nutrition Examination
Survey, 1988-94. Series 1: Programs and collection
procedures. Vital Health Stat 1 1994;32:1-407.
17. Drury TF, Winn DM, Snowden CB, Kingman A,
Kleinman DV, Lewis B. An overview of the oral health
component of the 1988-1991 National Health and
Nutrition Examination Survey (NHANES III-Phase 1).
J Dent Res 1996;75: 620-630.
18. Shah BV, Barnwell BG, Bieler GS. SUDAAN User’s
Manual, release 7.0. Research Triangle Park, NC:
Research Triangle Institute; 1996.
19. Albandar JM, Brunelle JA, Kingman A. Destructive
periodontal disease in adults 30 years of age and older
in the United States, 1988-1994. J Periodontol 1999;70:
13-29.
20. Newman HN. Plaque and chronic inflammatory
periodontal disease. A question of ecology. J Clin
Periodontol 1990;17:533-541.
21. Corbet EF, Davies WIR. The role of supragingival
plaque in the control of progressive periodontal disease.
J Clin Periodontol 1993; 20:307-313.
22. Robinson PJ. Gingivitis: A prelude to periodontitis?
J Clin Dent 1995;6:41-45.
23. Goldstein M, Brayer L, Schwartz Z. A critical evaluation
of methods for root coverage. Crit Rev Oral Biol Med
1996;7:87-98.
24. Christersson LA, Grossi SG, Dunford RG, Machtei EE,
Genco RJ. Dental plaque and calculus: Risk indicators
for their formation. J Dent Res 1992;71:1425-1430.
25. Fox CH, Jette AM, McGuire SM, Feldman HA, Douglass
CW. Periodontal disease among New England elders.
J Periodontol 1994;65:676-684.
26. Beck J, Garcia R, Heiss G, Vokonas PS, Offenbacher S.
Periodontal disease and cardiovascular disease.
J Periodontol 1996;67 (suppl.): 1123-1137.
Send reprint requests to: Dr. Jasim M. Albandar, Division of
Periodontology, Faculty of Dentistry, University of Bergen,
Arstadveien 17, N-5009 Bergen, Norway. Fax: 47 5558
6488; e-mail: Jasim.Albandar@odont.uib.no
Accepted for publication June 5, 1998.
43
AAP/4315/Jan99-Journal* 7/31/00 5:37 PM Page 43