More Related Content More from vanesaburnand (20) 1. Crime Rates by State
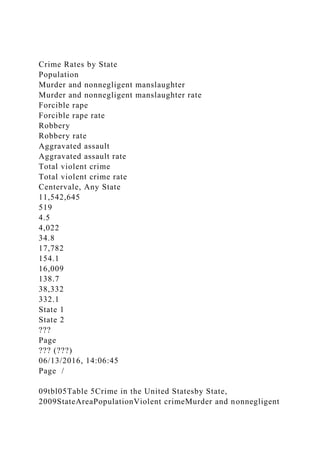
Population
Murder and nonnegligent manslaughter
Murder and nonnegligent manslaughter rate
Forcible rape
Forcible rape rate
Robbery
Robbery rate
Aggravated assault
Aggravated assault rate
Total violent crime
Total violent crime rate
Centervale, Any State
11,542,645
519
4.5
4,022
34.8
17,782
154.1
16,009
138.7
38,332
332.1
State 1
State 2
???
Page
??? (???)
06/13/2016, 14:06:45
Page /
09tbl05Table 5Crime in the United Statesby State,
2009StateAreaPopulationViolent crimeMurder and nonnegligent
2. manslaughterForcible rapeRobberyAggravated assaultProperty
crimeBurglaryLarceny-theftMotor vehicle
theftALABAMAMetropolitan Statistical Area3,365,303Area
actually
reporting98.4%16,3132441,1045,5869,379139,95539,09791,697
9,161Estimated
total100.0%16,5122471,1165,6429,507141,76839,61192,8829,2
75Cities outside metropolitan areas607,223Area actually
reporting99.1%3,319462555342,48426,1425,70919,2771,156Est
imated
total100.0%3,348462575392,50626,3755,76019,4491,166Nonme
tropolitan counties736,182Area actually
reporting99.0%1,30630130771,0699,3893,4315,325633Estimate
d total100.0%1,31930131781,0809,4863,4665,380640State
Total4,708,70821,1793231,5046,25913,093177,62948,837117,7
1111,081Rate per 100,000
inhabitants449.86.931.9132.9278.13,772.41,037.22,499.9235.3
ALASKAMetropolitan Statistical Area343,318Area actually
reporting100.0%2,892143515901,93712,8051,9329,8541,019Cit
ies outside metropolitan areas122,142Area actually
reporting92.8%622288364964,1076123,208287Estimated
total100.0%670295395344,4246593,456309Nonmetropolitan
counties233,013Area actually
reporting100.0%859666267613,3481,0061,981361State
Total698,4734,421225126553,23220,5773,59715,2911,689Rate
per 100,000
inhabitants633.03.173.393.8462.72,946.0515.02,189.2241.8ARI
ZONAMetropolitan Statistical Area6,125,527Area actually
reporting99.3%23,9123111,5747,91014,117219,51249,028146,1
7324,311Estimated
total100.0%24,0043121,5817,93314,178220,73649,303147,0282
4,405Cities outside metropolitan areas204,955Area actually
reporting97.3%2,136334861201,49710,2872,6826,4461,159Esti
mated
total100.0%2,196345001231,53910,5782,7586,6281,192Nonmet
ropolitan counties265,296Area actually
3. reporting100.0%729829436493,2681,3511,528389State
Total6,595,77826,9293542,1108,09916,366234,58253,412155,1
8425,986Rate per 100,000
inhabitants408.35.432.0122.8248.13,556.5809.82,352.8394.0AR
KANSASMetropolitan Statistical Area1,737,722Area actually
reporting93.7%10,485948892,0997,40373,30121,82747,1224,35
2Estimated
total100.0%10,875989292,1217,72775,80122,88848,3664,547Ci
ties outside metropolitan areas502,577Area actually
reporting98.1%2,669412453832,00022,6837,81414,023846Esti
mated
total100.0%2,721422503902,03923,1237,96614,295862Nonmetr
opolitan counties649,151Area actually
reporting92.7%1,26336175669869,3713,6235,105643Estimated
total100.0%1,36339189711,06410,1143,9105,510694State
Total2,889,45014,9591791,3682,58210,830109,03834,76468,17
16,103Rate per 100,000
inhabitants517.76.247.389.4374.83,773.71,203.12,359.3211.2C
ALIFORNIAMetropolitan Statistical Area36,127,220Area
actually
reporting100.0%171,2401,9418,41263,72697,161992,141224,74
6605,031162,364Cities outside metropolitan areas267,466Area
actually
reporting100.0%1,32061082139939,0332,4005,989644Nonmetro
politan counties566,978Area actually
reporting100.0%1,899251931541,5278,4402,9914,4361,013Stat
e
Total36,961,664174,4591,9728,71364,09399,6811,009,614230,1
37615,456164,021Rate per 100,000
inhabitants472.05.323.6173.4269.72,731.5622.61,665.1443.8CO
LORADOMetropolitan Statistical Area4,337,573Area actually
reporting99.7%15,2611572,0303,2859,789119,55824,12483,645
11,789Estimated
total100.0%15,2911572,0343,2919,809119,89524,17783,89911,
819Cities outside metropolitan areas314,714Area actually
reporting92.2%1,03712140718149,8831,5517,975357Estimated
4. total100.0%1,125131527788310,7221,6838,652387Nonmetropol
itan counties372,461Area actually
reporting88.7%497450174262,9747002,050224Estimated
total100.0%560556194803,3517892,310252State
Total5,024,74816,9761752,2423,38711,172133,96826,64994,86
112,458Rate per 100,000
inhabitants337.83.544.667.4222.32,666.2530.41,887.9247.9CO
NNECTICUTMetropolitan Statistical Area2,818,870Area
actually
reporting100.0%9,907985483,8785,38374,55413,08954,5626,90
3Cities outside metropolitan areas157,654Area actually
reporting100.0%255140631512,8535822,142129Nonmetropolita
n counties541,764Area actually
reporting100.0%346863492264,7741,4022,928444State
Total3,518,28810,5081076513,9905,76082,18115,07359,6327,4
76Rate per 100,000
inhabitants298.73.018.5113.4163.72,335.8428.41,694.9212.5DE
LAWAREMetropolitan Statistical Area692,991Area actually
reporting100.0%4,546372281,4572,82423,3855,07116,6601,654
Cities outside metropolitan areas43,137Area actually
reporting98.2%3991401102482,3925171,81065Estimated
total100.0%4071411122532,4375271,84466Nonmetropolitan
counties148,994Area actually
reporting100.0%6823691025083,8261,3342,305187State
Total885,1225,635413381,6713,58529,6486,93220,8091,907Rat
e per 100,000
inhabitants636.64.638.2188.8405.03,349.6783.22,351.0215.5DI
STRICT OF COLUMBIA1Metropolitan Statistical
Area599,657Area actually
reporting100.0%8,0711441504,3893,38828,4563,69619,2285,53
2Cities outside metropolitan areasNoneNonmetropolitan
countiesNoneTotal599,6578,0711441504,3893,38828,4563,6961
9,2285,532Rate per 100,000
inhabitants1,345.924.025.0731.9565.04,745.4616.43,206.5922.5
FLORIDAMetropolitan Statistical Area17,451,538Area actually
reporting99.9%107,8899675,13930,19371,590681,390171,40746
5. 1,29348,690Estimated
total100.0%107,9679675,14330,21771,640681,988171,541461,7
1648,731Cities outside metropolitan areas184,846Area actually
reporting99.1%1,59413963321,1539,0162,4626,159395Estimate
d
total100.0%1,60813973351,1639,0982,4846,215399Nonmetropo
litan counties901,585Area actually
reporting99.1%3,932372593563,28020,7387,78911,8301,119Est
imated
total100.0%3,966372613593,30920,9247,85911,9361,129State
Total18,537,969113,5411,0175,50130,91176,112712,010181,88
4479,86750,259Rate per 100,000
inhabitants612.55.529.7166.7410.63,840.8981.12,588.6271.1GE
ORGIAMetropolitan Statistical Area8,020,064Area actually
reporting99.5%34,7054881,88213,31419,021301,21382,261188,
55830,394Estimated
total100.0%34,8564891,89113,36519,111302,61382,601189,500
30,512Cities outside metropolitan areas680,207Area actually
reporting86.3%3,778341878812,67629,4747,06221,465947Esti
mated
total100.0%4,372392171,0193,09734,1068,17124,8391,096Non
metropolitan counties1,128,940Area actually
reporting94.5%2,505361822072,08022,3737,17113,7501,452Est
imated
total100.0%2,652381932192,20223,6817,59014,5541,537State
Total9,829,21141,8805662,30114,60324,410360,40098,362228,
89333,145Rate per 100,000
inhabitants426.15.823.4148.6248.33,666.61,000.72,328.7337.2
HAWAIIMetropolitan Statistical Area907,124Area actually
reporting100.0%2,537142438691,41133,3755,99923,6473,729Ci
ties outside metropolitan areasNoneNonmetropolitan
counties388,054Area actually
reporting100.0%1,022814916570014,0443,1799,7751,090State
Total1,295,1783,559223921,0342,11147,4199,17833,4224,819R
ate per 100,000
inhabitants274.81.730.379.8163.03,661.2708.62,580.5372.1IDA
6. HOMetropolitan Statistical Area1,019,745Area actually
reporting99.3%2,553163902111,93622,3234,60416,723996Esti
mated
total100.0%2,566163922121,94622,4184,63116,7861,001Cities
outside metropolitan areas240,694Area actually
reporting99.3%519286184135,2211,0443,952225Estimated
total100.0%523287184165,2551,0513,978226Nonmetropolitan
counties285,362Area actually
reporting100.0%441473153493,0688761,977215State
Total1,545,8013,530225522452,71130,7416,55822,7411,442Rat
e per 100,000
inhabitants228.41.435.715.8175.41,988.7424.21,471.193.3ILLI
NOIS2, 3State
Total12,910,40964,1857733,90122,92336,588353,34777,850248
,82126,676Rate per 100,000
inhabitants497.26.030.2177.6283.42,736.9603.01,927.3206.6IN
DIANAMetropolitan Statistical Area5,034,111Area actually
reporting90.0%18,7222611,3246,88810,249159,04639,778107,6
4011,628Estimated
total100.0%19,3892701,3917,02810,700168,56541,843114,5061
2,216Cities outside metropolitan areas504,766Area actually
reporting82.5%893711820356515,7942,90712,125762Estimated
total100.0%1,083914324668519,1523,52514,703924Nonmetrop
olitan counties884,236Area actually
reporting77.5%7222482605569,6432,7456,325573Estimated
total100.0%932311067871712,4433,5428,162739State
Total6,423,11321,4043101,6407,35212,102200,16048,910137,3
7113,879Rate per 100,000
inhabitants333.24.825.5114.5188.43,116.2761.52,138.7216.1IO
WAMetropolitan Statistical Area1,704,661Area actually
reporting99.3%5,798226261,0504,10048,26310,44935,0622,752
Estimated
total100.0%5,822226291,0534,11848,51010,49535,2552,760Citi
es outside metropolitan areas584,432Area actually
reporting94.4%1,82681451261,54715,2753,63510,938702Estima
ted
7. total100.0%1,93381541331,63816,1743,84911,582743Nonmetro
politan counties718,763Area actually
reporting98.6%63346995514,6891,8532,456380Estimated
total100.0%64247095594,7571,8802,492385State
Total3,007,8568,397348531,1956,31569,44116,22449,3293,888
Rate per 100,000
inhabitants279.21.128.439.7210.02,308.7539.41,640.0129.3KA
NSASMetropolitan Statistical Area1,927,388Area actually
reporting99.4%8,417937721,5905,96265,55413,68247,0074,865
Estimated
total100.0%8,445937751,5935,98465,82013,72947,2124,879Citi
es outside metropolitan areas564,427Area actually
reporting96.2%2,080202491751,63619,3423,98814,578776Esti
mated
total100.0%2,163212591821,70120,1104,14615,157807Nonmetr
opolitan counties326,932Area actually
reporting95.1%637559105634,2711,5162,500255Estimated
total100.0%670562115924,4901,5942,628268State
Total2,818,74711,2781191,0961,7868,27790,42019,46964,9975,
954Rate per 100,000
inhabitants400.14.238.963.4293.63,207.8690.72,305.9211.2KE
NTUCKY4Metropolitan Statistical Area2,487,317Area actually
reporting98.6%8,3721007443,0594,46974,70118,56452,0824,05
5Estimated
total100.0%8,4681007563,0934,51975,84418,81652,9194,109Ci
ties outside metropolitan areas526,584Area actually
reporting95.7%1,0261218732050715,8173,52311,685609Estima
ted
total100.0%1,0721319533453016,5323,68212,213637Nonmetro
politan counties1,300,212Area actually
reporting89.8%1,4535850118171314,3886,4676,7231,198Estima
ted total100.0%1,6196555820279416,0257,2037,4881,334State
Total4,314,11311,1591781,5093,6295,843108,40129,70172,620
6,080Rate per 100,000
inhabitants258.74.135.084.1135.42,512.7688.51,683.3140.9LO
UISIANAMetropolitan Statistical Area3,349,906Area actually
8. reporting98.2%20,3384609475,16613,765128,33333,18185,3199
,833Estimated
total100.0%20,7544649605,21714,113131,22633,75087,5339,94
3Cities outside metropolitan areas390,156Area actually
reporting74.6%2,616201294102,05716,4935,07210,827594Esti
mated
total100.0%3,506271735492,75722,1066,79814,512796Nonmetr
opolitan counties752,014Area actually
reporting100.0%3,589392263392,98517,1245,69810,448978Stat
e
Total4,492,07627,8495301,3596,10519,855170,45646,246112,4
9311,717Rate per 100,000
inhabitants620.011.830.3135.9442.03,794.61,029.52,504.3260.8
MAINEMetropolitan Statistical Area771,644Area actually
reporting100.0%9791719634542120,0753,98715,463625Cities
outside metropolitan areas275,182Area actually
reporting100.0%4187117382567,8681,4046,250214Nonmetropol
itan counties271,475Area actually
reporting100.0%182263161013,7421,3372,223182State
Total1,318,3011,5792637639977831,6856,72823,9361,021Rate
per 100,000
inhabitants119.82.028.530.359.02,403.5510.41,815.777.4MARY
LANDMetropolitan Statistical Area5,392,905Area actually
reporting100.0%32,4954351,09411,83319,133174,27035,034119
,91719,319Cities outside metropolitan areas79,700Area actually
reporting100.0%4720231083413,9328003,04686Nonmetropolita
n counties226,873Area actually
reporting100.0%656339665484,2201,1982,808214State
Total5,699,47833,6234381,15612,00720,022182,42237,032125,
77119,619Rate per 100,000
inhabitants589.97.720.3210.7351.33,200.7649.72,206.7344.2M
ASSACHUSETTSMetropolitan Statistical Area6,566,452Area
actually
reporting98.8%29,7911701,6757,37720,569149,46834,078103,7
9111,599Estimated
total100.0%30,0441711,6937,42520,755151,04734,460104,8831
9. 1,704Cities outside metropolitan areas26,963Area actually
reporting86.0%801727074617654327Estimated
total100.0%921828186720563131Nonmetropolitan
counties172Area actually reporting100.0%000000000State
Total6,593,58730,1361721,7017,42720,836151,91434,665105,5
1411,735Rate per 100,000
inhabitants457.12.625.8112.6316.02,304.0525.71,600.3178.0MI
CHIGAN4Metropolitan Statistical Area8,130,632Area actually
reporting99.4%45,4465933,34712,10929,397244,40766,436150,
03327,938Estimated
total100.0%45,5975933,36412,14429,496245,79866,721151,027
28,050Cities outside metropolitan areas633,364Area actually
reporting90.5%1,434636811594517,0682,76813,883417Estimate
d
total100.0%1,55574001221,02618,5843,00315,125456Nonmetro
politan counties1,205,731Area actually
reporting96.3%2,30726722621,49717,8555,86711,143845Estima
ted total100.0%2,39527750641,55418,5366,09111,568877State
Total9,969,72749,5476274,51412,33032,076282,91875,815177,
72029,383Rate per 100,000
inhabitants497.06.345.3123.7321.72,837.8760.51,782.6294.7MI
NNESOTA3Metropolitan Statistical Area3,947,216Area actually
reporting99.7%633,5125,989115,53920,65587,4867,398Estimat
ed total100.0%633,5165,996115,83720,69887,7287,411Cities
outside metropolitan areas498,584Area actually
reporting98.4%28682013,9532,01711,434502Estimated
total100.0%28783314,1742,04911,615510Nonmetropolitan
counties820,414Area actually
reporting97.4%9165178,8342,6695,583582Estimated
total100.0%9165319,0722,7415,733598State
Total5,266,21412,842741,7893,6197,360139,08325,488105,076
8,519Rate per 100,000
inhabitants243.91.434.068.7139.82,641.0484.01,995.3161.8MIS
SISSIPPIMetropolitan Statistical Area1,308,437Area actually
reporting90.9%3,727784001,6781,57144,34513,32727,6583,360
Estimated
10. total100.0%3,935814341,7231,69746,97014,12529,3073,538Citi
es outside metropolitan areas596,602Area actually
reporting84.1%2,172372407821,11322,1967,48213,858856Esti
mated
total100.0%2,584442869301,32426,4058,90116,4861,018Nonme
tropolitan counties1,046,957Area actually
reporting58.1%1,037381271816918,0233,5663,966491Estimated
total100.0%1,785652193121,18913,8066,1366,825845State
Total2,951,9968,3041909392,9654,21087,18129,16252,6185,40
1Rate per 100,000
inhabitants281.36.431.8100.4142.62,953.3987.91,782.5183.0MI
SSOURIMetropolitan Statistical Area4,504,484Area actually
reporting99.5%25,0313351,3217,10916,266166,79935,249115,7
7515,775Estimated
total100.0%25,1043361,3267,12616,316167,57335,384116,3601
5,829Cities outside metropolitan areas643,622Area actually
reporting98.1%2,543241712752,07323,7904,28018,730780Esti
mated
total100.0%2,592241742802,11424,2584,36419,099795Nonmetr
opolitan counties839,474Area actually
reporting100.0%1,74823107461,57210,8674,0395,973855State
Total5,987,58029,4443831,6077,45220,002202,69843,787141,4
3217,479Rate per 100,000
inhabitants491.86.426.8124.5334.13,385.3731.32,362.1291.9M
ONTANAMetropolitan Statistical Area344,222Area actually
reporting100.0%859118815160911,1291,6468,892591Cities
outside metropolitan areas214,560Area actually
reporting98.9%621892354866,7577365,623398Estimated
total100.0%627893354916,8317445,685402Nonmetropolitan
counties416,207Area actually
reporting98.2%9699111298205,9559784,522455Estimated
total100.0%9879113308356,0649964,605463State
Total974,9892,473282942161,93524,0243,38619,1821,456Rate
per 100,000
inhabitants253.62.930.222.2198.52,464.0347.31,967.4149.3NEB
RASKAMetropolitan Statistical Area1,053,696Area actually
11. reporting99.3%3,952363941,1312,39134,1115,92625,4032,782E
stimated
total100.0%3,960363971,1322,39534,2865,95025,5442,792Citie
s outside metropolitan areas387,558Area actually
reporting94.0%79741477257411,3721,7449,155473Estimated
total100.0%84841567761112,0961,8559,738503Nonmetropolita
n counties355,365Area actually
reporting80.8%20303481612,6127241,738150Estimated
total100.0%251042101993,2328962,150186State
Total1,796,6195,059405951,2193,20549,6148,70137,4323,481R
ate per 100,000
inhabitants281.62.233.167.8178.42,761.5484.32,083.5193.8NE
VADAMetropolitan Statistical Area2,376,643Area actually
reporting100.0%17,7851519395,96010,73576,23720,64043,5851
2,012Cities outside metropolitan areas46,868Area actually
reporting100.0%224131201721,49044694995Nonmetropolitan
counties219,574Area actually
reporting100.0%550551414533,0369081,856272State
Total2,643,08518,5591571,0216,02111,36080,76321,99446,390
12,379Rate per 100,000
inhabitants702.25.938.6227.8429.83,055.6832.11,755.1468.4NE
W HAMPSHIREMetropolitan Statistical Area826,814Area
actually
reporting91.6%1,337920631580716,4012,77312,955673Estimate
d total100.0%1,392921632484317,3322,92113,700711Cities
outside metropolitan areas446,945Area actually
reporting89.8%60311521163349,8751,6757,844356Estimated
total100.0%671116912937210,9931,8658,732396Nonmetropolit
an counties50,816Area actually
reporting2.9%15050107116487Estimated
total100.0%5101523429914214017State
Total1,324,5752,114104004551,24928,6244,92822,5721,124Rat
e per 100,000
inhabitants159.60.830.234.494.32,161.0372.01,704.184.9NEW
JERSEYMetropolitan Statistical Area8,707,739Area actually
reporting99.9%27,1123191,04111,63514,117181,02537,248128,
12. 27415,503Estimated
total100.0%27,1213191,04111,63914,122181,09737,262128,327
15,508Cities outside metropolitan areasNoneNonmetropolitan
countiesNoneState
Total8,707,73927,1213191,04111,63914,122181,09737,262128,
32715,508Rate per 100,000
inhabitants311.53.712.0133.7162.22,079.7427.91,473.7178.1NE
W MEXICOMetropolitan Statistical Area1,337,330Area actually
reporting98.0%7,880926571,5295,60251,89614,35832,3065,232
Estimated
total100.0%8,019936671,5425,71752,81114,58132,9315,299Citi
es outside metropolitan areas382,883Area actually
reporting96.5%3,355582702562,77116,8825,05611,108718Esti
mated
total100.0%3,477602802652,87217,4965,24011,512744Nonmetr
opolitan counties289,458Area actually
reporting72.5%6851680465433,4581,5951,549314Estimated
total100.0%94422110637494,7712,2012,137433State
Total2,009,67112,4401751,0571,8709,33875,07822,02246,5806,
476Rate per 100,000
inhabitants619.08.752.693.1464.73,735.81,095.82,317.8322.2N
EW YORKMetropolitan Statistical Area17,999,657Area actually
reporting99.8%72,2347612,17327,82241,478348,88456,201271,
49221,191Estimated
total100.0%72,3157612,17627,85141,527349,79956,330272,244
21,225Cities outside metropolitan areas565,896Area actually
reporting98.0%1,49751672011,12415,3522,76412,285303Estima
ted
total100.0%1,52751702051,14715,6662,82112,536309Nonmetro
politan counties975,900Area actually
reporting100.0%1,33412240801,00212,8503,6918,823336State
Total19,541,45375,1767782,58628,13643,676378,31562,842293
,60321,870Rate per 100,000
inhabitants384.74.013.2144.0223.51,936.0321.61,502.5111.9NO
RTH CAROLINAMetropolitan Statistical Area6,620,271Area
actually
13. reporting99.0%27,8013291,6789,52916,265249,64673,918160,5
6715,161Estimated
total100.0%28,0303301,6939,59216,415252,55874,593162,6841
5,281Cities outside metropolitan areas845,543Area actually
reporting93.6%5,062792541,4523,27744,86712,53430,5271,806
Estimated
total100.0%5,396842701,5473,49547,84913,36832,5561,925No
nmetropolitan counties1,915,070Area actually
reporting95.8%4,315773296573,25241,86719,04020,1272,700Es
timated
total100.0%4,503803436863,39443,69119,86921,0042,818State
Total9,380,88437,9294942,30611,82523,304344,098107,830216
,24420,024Rate per 100,000
inhabitants404.35.324.6126.1248.43,668.11,149.52,305.2213.5
NORTH DAKOTAMetropolitan Statistical Area317,071Area
actually
reporting100.0%7555135815348,0961,5156,039542Cities
outside metropolitan areas138,126Area actually
reporting93.9%414361163342,9895092,309171Estimated
total100.0%441365173563,1845422,460182Nonmetropolitan
counties191,647Area actually
reporting89.3%912226611,091265712114Estimated
total100.0%1022257681,222297797128State
Total646,8441,2981022510595812,5022,3549,296852Rate per
100,000
inhabitants200.71.534.816.2148.11,932.8363.91,437.1131.7OHI
OMetropolitan Statistical Area9,318,858Area actually
reporting93.5%34,3364753,34816,71013,803307,48387,427199,
60920,447Estimated
total100.0%35,3214863,49717,10014,238323,80590,795211,907
21,103Cities outside metropolitan areas922,840Area actually
reporting80.6%1,5111224244781028,3115,61522,055641Estima
ted
total100.0%1,873153005541,00435,1096,96327,351795Nonmetr
opolitan counties1,300,947Area actually
reporting90.6%1,0311620411669516,8945,85110,144899Estima
14. ted total100.0%1,1381822512876718,6396,45511,192992State
Total11,542,64538,3325194,02217,78216,009377,553104,21325
0,45022,890Rate per 100,000
inhabitants332.14.534.8154.1138.73,270.9902.92,169.8198.3OK
LAHOMAMetropolitan Statistical Area2,358,425Area actually
reporting99.9%13,8441771,0212,9729,67496,21027,74360,0958
,372Estimated
total100.0%13,8461771,0212,9729,67696,23827,75060,1148,37
4Cities outside metropolitan areas715,224Area actually
reporting99.6%3,406323723382,66427,2857,03618,9871,262Est
imated
total100.0%3,420323743392,67527,3987,06519,0661,267Nonme
tropolitan counties613,401Area actually
reporting100.0%1,20819134321,0238,1333,1604,210763State
Total3,687,05018,4742281,5293,34313,374131,76937,97583,39
010,404Rate per 100,000
inhabitants501.16.241.590.7362.73,573.81,030.02,261.7282.2O
REGONMetropolitan Statistical Area2,984,822Area actually
reporting100.0%7,792559292,2084,60092,27014,99268,6948,58
4Cities outside metropolitan areas396,094Area actually
reporting96.7%7831111719146414,1202,31011,141669Estimate
d
total100.0%8091112119748014,5992,38811,519692Nonmetropo
litan counties444,741Area actually
reporting100.0%1,14319118569506,6421,9974,052593State
Total3,825,6579,744851,1682,4616,030113,51119,37784,2659,8
69Rate per 100,000
inhabitants254.72.230.564.3157.62,967.1506.52,202.6258.0PEN
NSYLVANIAMetropolitan Statistical Area10,616,700Area
actually
reporting99.5%43,8626122,97517,02523,250242,76946,520179,
68516,564Estimated
total100.0%43,9756132,98117,05623,325243,79746,683180,506
16,608Cities outside metropolitan areas927,270Area actually
reporting96.3%2,316152233121,76618,9723,45215,033487Esti
mated
15. total100.0%2,407162323241,83519,7093,58615,617506Nonmetr
opolitan counties1,060,797Area actually
reporting100.0%1,5833243813497914,0064,5288,771707State
Total12,604,76747,9656613,65117,51426,139277,51254,797204
,89417,821Rate per 100,000
inhabitants380.55.229.0138.9207.42,201.6434.71,625.5141.4PU
ERTO RICOMetropolitan Statistical Area3,118,752Area
actually
reporting100.0%8,861784445,5512,48246,40114,09425,9706,33
7Cities outside metropolitan areas848,536Area actually
reporting100.0%1,631110215429589,5364,4274,614495Total3,9
67,28810,492894656,0933,44055,93718,52130,5846,832Rate
per 100,000
inhabitants264.522.51.6153.686.71,410.0466.8770.9172.2RHO
DE ISLANDMetropolitan Statistical Area1,053,209Area
actually
reporting100.0%2,647302827861,54927,4705,74919,3392,382Ci
ties outside metropolitan areasNoneNonmetropolitan
countiesNoneArea actually
reporting100.0%1315072701611State
Total1,053,2092,660312877861,55627,4975,74919,3552,393Rat
e per 100,000
inhabitants252.62.927.374.6147.72,610.8545.91,837.7227.2SOU
TH CAROLINAMetropolitan Statistical Area3,488,626Area
actually
reporting99.9%22,7671991,2174,57616,775135,30633,01991,49
010,797Estimated
total100.0%22,7821991,2174,57816,788135,42233,04391,57610
,803Cities outside metropolitan areas279,964Area actually
reporting97.9%3,079281415962,31415,4763,81510,997664Esti
mated
total100.0%3,147291446092,36515,8163,89911,238679Nonmetr
opolitan counties792,652Area actually
reporting100.0%4,667592515483,80926,1318,34015,7072,084St
ate
Total4,561,24230,5962871,6125,73522,962177,36945,282118,5
16. 2113,566Rate per 100,000
inhabitants670.86.335.3125.7503.43,888.6992.82,598.4297.4SO
UTH DAKOTAMetropolitan Statistical Area377,499Area
actually
reporting98.4%8953282905208,9271,4976,936494Estimated
total100.0%8993283905239,0121,5097,006497Cities outside
metropolitan areas206,711Area actually
reporting89.4%4039106142743,4675742,692201Estimated
total100.0%45110119163063,8776423,010225Nonmetropolitan
counties228,173Area actually
reporting78.5%12463448084625751871Estimated
total100.0%15884351021,07932866091State
Total812,3831,5082144511193113,9682,47910,676813Rate per
100,000
inhabitants185.62.654.813.7114.61,719.4305.21,314.2100.1TEN
NESSEEMetropolitan Statistical Area4,621,940Area actually
reporting100.0%34,7183641,5998,92423,831185,29048,653124,
50412,133Cities outside metropolitan areas610,990Area
actually
reporting100.0%3,957372025503,16828,7196,55021,0031,166N
onmetropolitan counties1,063,324Area actually
reporting100.0%3,366601921732,94122,3568,44312,2391,674St
ate
Total6,296,25442,0414611,9939,64729,940236,36563,646157,7
4614,973Rate per 100,000
inhabitants667.77.331.7153.2475.53,754.11,010.92,505.4237.8T
EXASMetropolitan Statistical Area21,787,209Area actually
reporting99.9%111,7931,1947,27536,95866,366919,563216,655
629,98772,921Estimated
total100.0%111,8091,1947,27636,96266,377919,761216,697630
,13072,934Cities outside metropolitan areas1,388,267Area
actually
reporting99.3%6,550546378724,98751,27313,51535,7941,964Es
timated
total100.0%6,574546408745,00651,45113,56935,9171,965Non
metropolitan counties1,606,826Area actually
17. reporting100.0%3,285803711992,63523,9339,96712,3061,660St
ate
Total24,782,302121,6681,3288,28738,03574,018995,145240,23
3678,35376,559Rate per 100,000
inhabitants490.95.433.4153.5298.74,015.5969.42,737.2308.9UT
AHMetropolitan Statistical Area2,483,636Area actually
reporting99.9%5,497347911,2723,40084,55713,74964,1906,618
Estimated
total100.0%5,501347921,2733,40284,62013,75964,2386,623Citi
es outside metropolitan areas148,931Area actually
reporting88.2%210153161403,7526352,960157Estimated
total100.0%238160181594,2547203,356178Nonmetropolitan
counties152,005Area actually
reporting88.2%16424771082,0566001,36591Estimated
total100.0%18525381222,3316801,548103State
Total2,784,5725,924379051,2993,68391,20515,15969,1426,904
Rate per 100,000
inhabitants212.71.332.546.6132.33,275.4544.42,483.0247.9VER
MONTMetropolitan Statistical Area209,200Area actually
reporting100.0%332158392346,4171,1485,102167Cities outside
metropolitan areas204,883Area actually
reporting100.0%310132542235,1961,0124,065119Nonmetropoli
tan counties207,677Area actually
reporting98.0%172533181163,2531,2671,827159Estimated
total100.0%175534181183,3181,2921,864162State
Total621,760817712411157514,9313,45211,031448Rate per
100,000
inhabitants131.41.119.917.992.52,401.4555.21,774.272.1VIRGI
NIAMetropolitan Statistical Area6,766,343Area actually
reporting100.0%16,1182911,2995,9358,593172,20027,276134,5
4110,383Cities outside metropolitan areas270,931Area actually
reporting100.0%64911671514208,3671,2456,831291Nonmetrop
olitan counties845,316Area actually
reporting100.0%1,1124514517175110,8863,0557,086745State
Total7,882,59017,8793471,5116,2579,764191,45331,576148,45
811,419Rate per 100,000
18. inhabitants226.84.419.279.4123.92,428.8400.61,883.4144.9WA
SHINGTONMetropolitan Statistical Area5,846,504Area actually
reporting100.0%20,1731492,1566,40211,466218,91946,062151,
07021,787Cities outside metropolitan areas332,214Area
actually
reporting97.3%1,1341324121466615,6043,34311,1791,082Esti
mated
total100.0%1,1661324822068516,0423,43711,4931,112Nonmetr
opolitan counties485,477Area actually
reporting100.0%71717135774889,4073,2925,334781State
Total6,664,19522,0561792,5396,69912,639244,36852,791167,8
9723,680Rate per 100,000
inhabitants331.02.738.1100.5189.73,666.9792.22,519.4355.3W
EST VIRGINIAMetropolitan Statistical Area1,012,423Area
actually
reporting93.0%3,057382316282,16026,8717,04418,1811,646Est
imated
total100.0%3,238412416592,29728,9897,54719,6891,753Cities
outside metropolitan areas221,473Area actually
reporting77.6%66211671184666,0791,2174,625237Estimated
total100.0%85214861526007,8331,5685,960305Nonmetropolita
n counties585,881Area actually
reporting91.7%1,1972797979768,3962,6005,170626Estimated
total100.0%1,306291061061,0659,1592,8365,640683State
Total1,819,7775,396844339173,96245,98111,95131,2892,741Ra
te per 100,000
inhabitants296.54.623.850.4217.72,526.7656.71,719.4150.6WIS
CONSINMetropolitan Statistical Area4,126,916Area actually
reporting99.8%12,6461258704,7446,907117,11420,65788,5947,
863Estimated
total100.0%12,6561258714,7476,913117,29020,68088,7427,868
Cities outside metropolitan areas627,299Area actually
reporting98.4%1,03181197582919,1832,53116,180472Estimated
total100.0%1,04781217684219,4872,57116,437479Nonmetropol
itan counties900,559Area actually
reporting100.0%830111162767610,7093,4896,641579State
19. Total5,654,77414,5331441,1084,8508,431147,48626,740111,82
08,926Rate per 100,000
inhabitants257.02.519.685.8149.12,608.2472.91,977.4157.8WY
OMINGMetropolitan Statistical Area164,211Area actually
reporting100.0%343466462275,8388964,636306Cities outside
metropolitan areas224,827Area actually
reporting97.9%648476255436,6169395,352325Estimated
total100.0%663478265556,7599595,468332Nonmetropolitan
counties155,232Area actually
reporting100.0%23654051861,7573751,249133State
Total544,2701,242131847796814,3542,23011,353771Rate per
100,000
inhabitants228.22.433.814.1177.92,637.3409.72,085.9141.71
Includes offenses reported by the Zoological Police and the
Metro Transit Police.2 Limited data for 2009 were available for
Illinois. See Data Declaration.3 The data collection
methodology for the offense of forcible rape used by the Illinois
and the Minnesota state Uniform Crime Reporting (UCR)
Programs (with the exception of Rockford, IL, and Minneapolis
and St. Paul, MN) does not comply with national UCR
guidelines. Consequently, their state figures for forcible rape
(with the exception of Rockford, IL, and Minneapolis and St.
Paul, MN) have been estimated for inclusion in this table.
Table 8, Offenses Known to Law Enforcement, provides the
reported female
forcible rape crime figure.4 Because of changes in the state's
reporting practices, figures are not comparable to previous
years' data.NOTE: Although arson data are included in the
trend and clearance tables, sufficient data are not available to
estimate totals for this offense. Therefore, no arson data are
published in this table.