SlideShare a Scribd company logo
1 of 3
Download to read offline
The Development Data Portal
Custom solution for evidence-based development policy.
Measuring inequality and poverty is extremely challeng-
ing when making evidence-based policy decisions. The
reality is multidimensional and requires taking into con-
sideration a wide range of statistics in different areas in-
cluding income, health, nutrition, education and skills,
livelihoods, housing conditions, gender inequality, social
exclusion and participation.

Policy-makers, development specialists, social scientists
and statisticians often have to rely on many different
tools to handle daily data tasks. At PROGNOZ, we under-
stand the importance of offering our customers a solution
that takes into account the multiple dimensions of human
development and that supports all aspects of the data
management and dissemination process.

PROGNOZ introduces the Human Development Data por-
tal, a set of interactive and user-friendly tools that sup-
port the measurement of progress towards the MDG and
the setting up of evidence-based development policy.


                                    Intuitive, interactive and user-friendly
                                Fully integrated into your web-environment
                      Fast access to data from multiple development data sources
                                       Easy analysis of complex datasets
                 Automatic data combination to create new indicators and indexes.
                         Visually appealing reports and data visualization tools.
                            Improved communication of your data and results


Copyright © 2010 Prognoz Corporation. All rights reserved. All trademarks are the property of their respective owners.
Thanks to our 20 years experience in Business Intelligence and statistical know-how working with
public and private organizations from various sectors, PROGNOZ has built core competencies to
offer solutions fitted to your organization needs.

Portal content
Together we will define the content of your portal, to make sure every element is relevant. Prognoz will take care of
data consistency, updates and quality control. We will create a unique customized package including:

    Your research and statistics. The portal will integrate     data to create indexes that will be updated as soon as
    all the statistics from your organisation and use inter-    new data are released.
    active visualization tools specifically designed to com-    Reports. The portal will include all relevant publica-
    municate and disseminate your results better.               tions to support your work.
    Official statistics. Prognoz has many years’ experience
    of working with global and local statistics providers
    such as the World Bank, IMF, UN Institutions, the Eu-
    ropean Commission, and statistical offices around the
    world.
    A wide range of subjects. Our team is familiar with
    multiple subjects including micro/macro-economy,
    income, trade, agriculture, food security, nutrition,
    health, education and skills, housing conditions, gen-
    der equality, social exclusion, environment, and many
    more.
    Specific indicators and indexes. The Prognoz system
    will support the calculation and transformation of

Key features
The Web-based solution is built for the analysis, reporting and dissemination of data in an intuitive, interactive and
user-friendly way.

    Easily explore and query complex datasets. The por-         able to a large audience. Improve statistical literacy
    tal enables you to explore multiple data sources and        within your organization and of the public at large.
    work with complex statistics in a very simple way.          Share your results in common formats. Each time
    Usability is our main goal when developing your solu-       you process a query or consult a report, you can easily
    tion.                                                       extract the results into Word, Excel, PowerPoint, or
    Visually appealing dash-boards to measure and sup-          PDF.
    port policies. Together we will design predefined           Usable from anywhere. Gain access to the portal
    dashboards that will be automatically updated as            from any computer or smart phone with an Internet
    soon as new data are available.                             connection. The portal can also be integrated into
    Get the most valuable insights thanks to powerful
    data visualization tools. We offer multiple ways to
    look at data, including tables, charts, and maps as well
    as dynamic bubble charts.
    Take into account different types of users with dif-
    ferent needs all within the same platform. We un-
    derstand that statisticians do not work with data in
    the same way as final decision-makers.
    Improve collaboration and dissemination of statis-
    tics. Work and share your insight with your col-
    leagues. Easily publish statistics and make them avail-
Full customization
    Each application that we develop is built on our own plat-
    form. In other words, we do not have any licensing re-
    strictions or technological constraints in providing high-
    level customization.
    We will make the application look and feel like your own
    internal solution (specific design, logo, color, and so on).
    We will adapt the functionalities and data structure to
    your organizational process.
    We will incorporate all requested data sources, reports,
    and publications.


Benefit from expert support
Our Web portal is backed by the following support services:
    A single point of contact who knows every detail of your
    customized solution and its data environment.
    Consulting on data visualization, external data sources,
    and data management issues.
    On-site, online, and on-demand training and multimedia
    tutorials.
    Technical and customer service support around the clock
    and around the world.


About PROGNOZ
PROGNOZ develops Business Intelligence (BI) and Business
Performance Management (BPM) solutions that help public
and private agencies harness the power of data to make in-
formed decisions.
With roots in the Russian tradition of technological innova-
tion, today PROGNOZ is a global software developer that
helps organizations better understand business and economic
data, the lifeblood of the Information Age, through innovative
BI solutions.
The more than 800 developers, analysts, and economists who
form the backbone of PROGNOZ are completely dedicated to
understanding user-level needs and developing tailor-made
software that makes today’s business and economies more
efficient.


              PROGNOZ Brussels Office                          Contact
              Avenue des Arts, 3-4-5,                          Thibault Truyen
              1210 Brussels, Belgium.                          Tel +32 2 203 44 48
              Email: Info@prognoz.com                          Email: Thibault.truyen@prognoz.com


                                                 www.prognoz.com

More Related Content

Similar to The Development Data Portal

Data Storytelling: Neptune Digital Space
Data Storytelling: Neptune Digital SpaceData Storytelling: Neptune Digital Space
Data Storytelling: Neptune Digital SpaceNeptune Digital Space
 
See Your Data In A New Way. SAS Visual Analytics
See Your Data In A New Way.  SAS Visual AnalyticsSee Your Data In A New Way.  SAS Visual Analytics
See Your Data In A New Way. SAS Visual AnalyticsEvan Greenberg
 
[Case study] meinestadt’s web analytics department develops data culture.
[Case study] meinestadt’s web analytics department develops data culture.[Case study] meinestadt’s web analytics department develops data culture.
[Case study] meinestadt’s web analytics department develops data culture.AT Internet
 
Achieving Triple Aims in Healthcare
Achieving Triple Aims in HealthcareAchieving Triple Aims in Healthcare
Achieving Triple Aims in HealthcareLee Hannis
 
Big Data - Analytics iC-360
Big Data - Analytics iC-360Big Data - Analytics iC-360
Big Data - Analytics iC-360davemishra
 
Business intelligence tools to handle big data
Business intelligence tools to handle big dataBusiness intelligence tools to handle big data
Business intelligence tools to handle big dataIshucs
 
Toobler profile
Toobler profileToobler profile
Toobler profileUXDOTS
 
Toobler Company Profile
Toobler Company ProfileToobler Company Profile
Toobler Company ProfileJose Gonsalo
 
Meltwater enterprise solutions
Meltwater enterprise solutions Meltwater enterprise solutions
Meltwater enterprise solutions Ajay Khari
 
Managing the Impact of COVID-19 Using Data Virtualization
Managing the Impact of COVID-19 Using Data VirtualizationManaging the Impact of COVID-19 Using Data Virtualization
Managing the Impact of COVID-19 Using Data VirtualizationDenodo
 

Similar to The Development Data Portal (20)

Data Storytelling: Neptune Digital Space
Data Storytelling: Neptune Digital SpaceData Storytelling: Neptune Digital Space
Data Storytelling: Neptune Digital Space
 
See Your Data In A New Way. SAS Visual Analytics
See Your Data In A New Way.  SAS Visual AnalyticsSee Your Data In A New Way.  SAS Visual Analytics
See Your Data In A New Way. SAS Visual Analytics
 
SAS Visual Analytics
SAS Visual AnalyticsSAS Visual Analytics
SAS Visual Analytics
 
Data solutions
Data solutionsData solutions
Data solutions
 
Media offering
Media offeringMedia offering
Media offering
 
[Case study] meinestadt’s web analytics department develops data culture.
[Case study] meinestadt’s web analytics department develops data culture.[Case study] meinestadt’s web analytics department develops data culture.
[Case study] meinestadt’s web analytics department develops data culture.
 
Ruvos - Capabilities - 2022
Ruvos - Capabilities - 2022  Ruvos - Capabilities - 2022
Ruvos - Capabilities - 2022
 
Achieving Triple Aims in Healthcare
Achieving Triple Aims in HealthcareAchieving Triple Aims in Healthcare
Achieving Triple Aims in Healthcare
 
ARTICLE ON BI AND BO
ARTICLE ON BI AND BOARTICLE ON BI AND BO
ARTICLE ON BI AND BO
 
PART 1.docx
PART 1.docxPART 1.docx
PART 1.docx
 
Spss
SpssSpss
Spss
 
Big Data - Analytics iC-360
Big Data - Analytics iC-360Big Data - Analytics iC-360
Big Data - Analytics iC-360
 
Business intelligence tools to handle big data
Business intelligence tools to handle big dataBusiness intelligence tools to handle big data
Business intelligence tools to handle big data
 
BSS_4_ENG
BSS_4_ENGBSS_4_ENG
BSS_4_ENG
 
Buzzdetector corporate april 17
Buzzdetector corporate april 17Buzzdetector corporate april 17
Buzzdetector corporate april 17
 
Toobler profile
Toobler profileToobler profile
Toobler profile
 
Toobler Company Profile
Toobler Company ProfileToobler Company Profile
Toobler Company Profile
 
toobler_profile
toobler_profiletoobler_profile
toobler_profile
 
Meltwater enterprise solutions
Meltwater enterprise solutions Meltwater enterprise solutions
Meltwater enterprise solutions
 
Managing the Impact of COVID-19 Using Data Virtualization
Managing the Impact of COVID-19 Using Data VirtualizationManaging the Impact of COVID-19 Using Data Virtualization
Managing the Impact of COVID-19 Using Data Virtualization
 

The Development Data Portal

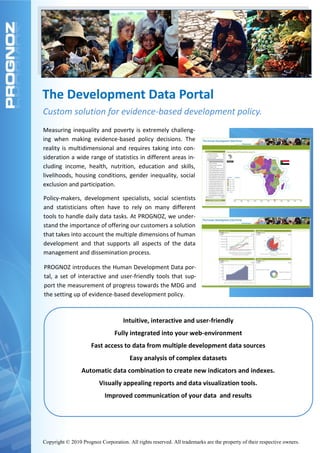
  • 1. The Development Data Portal Custom solution for evidence-based development policy. Measuring inequality and poverty is extremely challeng- ing when making evidence-based policy decisions. The reality is multidimensional and requires taking into con- sideration a wide range of statistics in different areas in- cluding income, health, nutrition, education and skills, livelihoods, housing conditions, gender inequality, social exclusion and participation. Policy-makers, development specialists, social scientists and statisticians often have to rely on many different tools to handle daily data tasks. At PROGNOZ, we under- stand the importance of offering our customers a solution that takes into account the multiple dimensions of human development and that supports all aspects of the data management and dissemination process. PROGNOZ introduces the Human Development Data por- tal, a set of interactive and user-friendly tools that sup- port the measurement of progress towards the MDG and the setting up of evidence-based development policy. Intuitive, interactive and user-friendly Fully integrated into your web-environment Fast access to data from multiple development data sources Easy analysis of complex datasets Automatic data combination to create new indicators and indexes. Visually appealing reports and data visualization tools. Improved communication of your data and results Copyright © 2010 Prognoz Corporation. All rights reserved. All trademarks are the property of their respective owners.
  • 2. Thanks to our 20 years experience in Business Intelligence and statistical know-how working with public and private organizations from various sectors, PROGNOZ has built core competencies to offer solutions fitted to your organization needs. Portal content Together we will define the content of your portal, to make sure every element is relevant. Prognoz will take care of data consistency, updates and quality control. We will create a unique customized package including: Your research and statistics. The portal will integrate data to create indexes that will be updated as soon as all the statistics from your organisation and use inter- new data are released. active visualization tools specifically designed to com- Reports. The portal will include all relevant publica- municate and disseminate your results better. tions to support your work. Official statistics. Prognoz has many years’ experience of working with global and local statistics providers such as the World Bank, IMF, UN Institutions, the Eu- ropean Commission, and statistical offices around the world. A wide range of subjects. Our team is familiar with multiple subjects including micro/macro-economy, income, trade, agriculture, food security, nutrition, health, education and skills, housing conditions, gen- der equality, social exclusion, environment, and many more. Specific indicators and indexes. The Prognoz system will support the calculation and transformation of Key features The Web-based solution is built for the analysis, reporting and dissemination of data in an intuitive, interactive and user-friendly way. Easily explore and query complex datasets. The por- able to a large audience. Improve statistical literacy tal enables you to explore multiple data sources and within your organization and of the public at large. work with complex statistics in a very simple way. Share your results in common formats. Each time Usability is our main goal when developing your solu- you process a query or consult a report, you can easily tion. extract the results into Word, Excel, PowerPoint, or Visually appealing dash-boards to measure and sup- PDF. port policies. Together we will design predefined Usable from anywhere. Gain access to the portal dashboards that will be automatically updated as from any computer or smart phone with an Internet soon as new data are available. connection. The portal can also be integrated into Get the most valuable insights thanks to powerful data visualization tools. We offer multiple ways to look at data, including tables, charts, and maps as well as dynamic bubble charts. Take into account different types of users with dif- ferent needs all within the same platform. We un- derstand that statisticians do not work with data in the same way as final decision-makers. Improve collaboration and dissemination of statis- tics. Work and share your insight with your col- leagues. Easily publish statistics and make them avail-
  • 3. Full customization Each application that we develop is built on our own plat- form. In other words, we do not have any licensing re- strictions or technological constraints in providing high- level customization. We will make the application look and feel like your own internal solution (specific design, logo, color, and so on). We will adapt the functionalities and data structure to your organizational process. We will incorporate all requested data sources, reports, and publications. Benefit from expert support Our Web portal is backed by the following support services: A single point of contact who knows every detail of your customized solution and its data environment. Consulting on data visualization, external data sources, and data management issues. On-site, online, and on-demand training and multimedia tutorials. Technical and customer service support around the clock and around the world. About PROGNOZ PROGNOZ develops Business Intelligence (BI) and Business Performance Management (BPM) solutions that help public and private agencies harness the power of data to make in- formed decisions. With roots in the Russian tradition of technological innova- tion, today PROGNOZ is a global software developer that helps organizations better understand business and economic data, the lifeblood of the Information Age, through innovative BI solutions. The more than 800 developers, analysts, and economists who form the backbone of PROGNOZ are completely dedicated to understanding user-level needs and developing tailor-made software that makes today’s business and economies more efficient. PROGNOZ Brussels Office Contact Avenue des Arts, 3-4-5, Thibault Truyen 1210 Brussels, Belgium. Tel +32 2 203 44 48 Email: Info@prognoz.com Email: Thibault.truyen@prognoz.com www.prognoz.com