SlideShare a Scribd company logo
1 of 2
Q1/2013
 Fixed Telephone Line Services: January
1.1 Post Paid      227,186
1.2 Prepaid Lines  26,205
1.3 Public Telephone – Payphones     6,801
1.4 ISDN Channels (Equivalent DELs)        44,374
1.5 WLL Connections 1,875
1. Total Fixed Telephone Lines  (1.1-1.5) 306,441
       Fixed Telephone Lines Penetration/inhabitant 9.30%
     Fixed Telephone Lines Penetration/household 76.17%
 Mobile Services: January
2.1 Post-paid (2.1.1+2.1.2) 467,026
2.1.1 Operators 467,026
2.1.2 Resellers 0
2.2 Prepaid (2.2.1+2.2.2) 4,839,534
2.2.1 Operators    4,261,429
2.2.2 Resellers 578,105
2. Total Mobile Subscribers; (2.1+2.2): 5,306,560
Mobile Penetration/inhabitant 161.03%
Fixed Internet Services:  January
3.1.1. Post paid 5,126
3.1.2. Pre paid 623
3.1 Dial up Internet Subscribers(3.1.1+3.1.2): 5,749
3.2 Fixed Broadband Subscribers 117,922
3. Total Fixed Internet  Subscribers; (3.1+3.2) 123,671
Fixed Internet Penetration/inhabitant 3.75%
Fixed Internet Penetration/household 30.74%
Mobile Broadband  January
4. Active Mobile Broadband Subscribers ¹ 1,815,823
Mobile Broadband Penetration/inhabitant 55.10%
¹ As per ITU definition the (Mobile broadband subscribers (potential access)) has
been replaced with the Active Mobile Broadband Subscribers. 
The Active Mobile Broadband subscribers has been calculated as per ITU Handbook to
represent the sum of: 
(i) Dedicated mobile broadband subscriptions: (All subscribers who have subscribed
to a data plan which has a subscription charge and fixed period of subscription
irrespective of the subscription duration (daily, weekly or monthly plans) 
(ii) Standard Mobile Broadband Subscriptions: (subscribers who use 3G broadband
service at least once in a month without subscribing to a fixed duration plan. These
are generally called “pay as you go” (PAYG) users. 
Note: The New provisional population is (3,295,298) up to Mid of 2011; according to
the lastest statistics provided by the National Center for Statistics & Information and
households (402,286)

More Related Content

Similar to 1st Quarter 2013

Communications Statistics December 2021_1643809069 (1).pdf
Communications Statistics December 2021_1643809069 (1).pdfCommunications Statistics December 2021_1643809069 (1).pdf
Communications Statistics December 2021_1643809069 (1).pdfEricklucas30
 
Q1 jan mar 2011
Q1 jan mar 2011Q1 jan mar 2011
Q1 jan mar 2011traoman
 
Csp 2016 lec-1
Csp 2016 lec-1Csp 2016 lec-1
Csp 2016 lec-1Charuka_R
 
Quarter 2, 2012.pdf
 Quarter 2, 2012.pdf Quarter 2, 2012.pdf
Quarter 2, 2012.pdftraoman
 
Quarter 4, 2012
 Quarter 4, 2012 Quarter 4, 2012
Quarter 4, 2012traoman
 
Quarter1, 2012
 Quarter1, 2012 Quarter1, 2012
Quarter1, 2012traoman
 
1st quarter 2012
1st quarter 20121st quarter 2012
1st quarter 2012traoman
 
Performance indicator report_jun_2015
Performance indicator report_jun_2015Performance indicator report_jun_2015
Performance indicator report_jun_2015Megha Jain
 

Similar to 1st Quarter 2013 (14)

Q3 2009
Q3 2009Q3 2009
Q3 2009
 
Q2 2008
Q2 2008Q2 2008
Q2 2008
 
Q4 2008
Q4 2008Q4 2008
Q4 2008
 
Q4 2008
Q4 2008Q4 2008
Q4 2008
 
Q4 2009
Q4 2009Q4 2009
Q4 2009
 
Communications Statistics December 2021_1643809069 (1).pdf
Communications Statistics December 2021_1643809069 (1).pdfCommunications Statistics December 2021_1643809069 (1).pdf
Communications Statistics December 2021_1643809069 (1).pdf
 
Q1 jan mar 2011
Q1 jan mar 2011Q1 jan mar 2011
Q1 jan mar 2011
 
Csp 2016 lec-1
Csp 2016 lec-1Csp 2016 lec-1
Csp 2016 lec-1
 
Quarter 2, 2012.pdf
 Quarter 2, 2012.pdf Quarter 2, 2012.pdf
Quarter 2, 2012.pdf
 
Q3 2008
Q3 2008Q3 2008
Q3 2008
 
Quarter 4, 2012
 Quarter 4, 2012 Quarter 4, 2012
Quarter 4, 2012
 
Quarter1, 2012
 Quarter1, 2012 Quarter1, 2012
Quarter1, 2012
 
1st quarter 2012
1st quarter 20121st quarter 2012
1st quarter 2012
 
Performance indicator report_jun_2015
Performance indicator report_jun_2015Performance indicator report_jun_2015
Performance indicator report_jun_2015
 

More from traoman

passive_infrastructure draft regulationar-AR
  passive_infrastructure draft regulationar-AR  passive_infrastructure draft regulationar-AR
passive_infrastructure draft regulationar-ARtraoman
 
522 tra position_onpassiveinfrastructurepc_ar
522 tra position_onpassiveinfrastructurepc_ar522 tra position_onpassiveinfrastructurepc_ar
522 tra position_onpassiveinfrastructurepc_artraoman
 
الربع الرابع 2005
الربع الرابع 2005الربع الرابع 2005
الربع الرابع 2005traoman
 
الربع الثالث 2005
الربع الثالث 2005الربع الثالث 2005
الربع الثالث 2005traoman
 
الربع الثاني 2005
الربع الثاني 2005الربع الثاني 2005
الربع الثاني 2005traoman
 
الربع الاول 2005
الربع الاول 2005الربع الاول 2005
الربع الاول 2005traoman
 
الربع الرابع 2006
الربع الرابع 2006الربع الرابع 2006
الربع الرابع 2006traoman
 
الربع الثالث 2006
الربع الثالث 2006الربع الثالث 2006
الربع الثالث 2006traoman
 
الربع الثاني 2006
الربع الثاني 2006الربع الثاني 2006
الربع الثاني 2006traoman
 
الربع الاول 2006
الربع الاول 2006الربع الاول 2006
الربع الاول 2006traoman
 
الربع الثالث 2007
الربع الثالث 2007الربع الثالث 2007
الربع الثالث 2007traoman
 
الربع الاول 2007
الربع الاول 2007 الربع الاول 2007
الربع الاول 2007 traoman
 
الربع الثالث 2008
الربع الثالث 2008الربع الثالث 2008
الربع الثالث 2008traoman
 
الربع الثاني 2008
الربع الثاني 2008الربع الثاني 2008
الربع الثاني 2008traoman
 
الربع الاول 2008
الربع الاول 2008الربع الاول 2008
الربع الاول 2008traoman
 
الربع الرابع 2009
الربع الرابع 2009الربع الرابع 2009
الربع الرابع 2009traoman
 
الربع الثالث 2009
الربع الثالث 2009الربع الثالث 2009
الربع الثالث 2009traoman
 

More from traoman (20)

passive_infrastructure draft regulationar-AR
  passive_infrastructure draft regulationar-AR  passive_infrastructure draft regulationar-AR
passive_infrastructure draft regulationar-AR
 
522 tra position_onpassiveinfrastructurepc_ar
522 tra position_onpassiveinfrastructurepc_ar522 tra position_onpassiveinfrastructurepc_ar
522 tra position_onpassiveinfrastructurepc_ar
 
الربع الرابع 2005
الربع الرابع 2005الربع الرابع 2005
الربع الرابع 2005
 
الربع الثالث 2005
الربع الثالث 2005الربع الثالث 2005
الربع الثالث 2005
 
الربع الثاني 2005
الربع الثاني 2005الربع الثاني 2005
الربع الثاني 2005
 
الربع الاول 2005
الربع الاول 2005الربع الاول 2005
الربع الاول 2005
 
الربع الرابع 2006
الربع الرابع 2006الربع الرابع 2006
الربع الرابع 2006
 
الربع الثالث 2006
الربع الثالث 2006الربع الثالث 2006
الربع الثالث 2006
 
الربع الثاني 2006
الربع الثاني 2006الربع الثاني 2006
الربع الثاني 2006
 
الربع الاول 2006
الربع الاول 2006الربع الاول 2006
الربع الاول 2006
 
Q1 2010
Q1  2010Q1  2010
Q1 2010
 
Q4 2007
Q4 2007Q4 2007
Q4 2007
 
Q2 2007
Q2 2007Q2 2007
Q2 2007
 
الربع الثالث 2007
الربع الثالث 2007الربع الثالث 2007
الربع الثالث 2007
 
الربع الاول 2007
الربع الاول 2007 الربع الاول 2007
الربع الاول 2007
 
الربع الثالث 2008
الربع الثالث 2008الربع الثالث 2008
الربع الثالث 2008
 
الربع الثاني 2008
الربع الثاني 2008الربع الثاني 2008
الربع الثاني 2008
 
الربع الاول 2008
الربع الاول 2008الربع الاول 2008
الربع الاول 2008
 
الربع الرابع 2009
الربع الرابع 2009الربع الرابع 2009
الربع الرابع 2009
 
الربع الثالث 2009
الربع الثالث 2009الربع الثالث 2009
الربع الثالث 2009
 

1st Quarter 2013

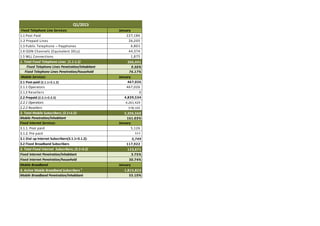
  • 1. Q1/2013  Fixed Telephone Line Services: January 1.1 Post Paid      227,186 1.2 Prepaid Lines  26,205 1.3 Public Telephone – Payphones     6,801 1.4 ISDN Channels (Equivalent DELs)        44,374 1.5 WLL Connections 1,875 1. Total Fixed Telephone Lines  (1.1-1.5) 306,441        Fixed Telephone Lines Penetration/inhabitant 9.30%      Fixed Telephone Lines Penetration/household 76.17%  Mobile Services: January 2.1 Post-paid (2.1.1+2.1.2) 467,026 2.1.1 Operators 467,026 2.1.2 Resellers 0 2.2 Prepaid (2.2.1+2.2.2) 4,839,534 2.2.1 Operators    4,261,429 2.2.2 Resellers 578,105 2. Total Mobile Subscribers; (2.1+2.2): 5,306,560 Mobile Penetration/inhabitant 161.03% Fixed Internet Services:  January 3.1.1. Post paid 5,126 3.1.2. Pre paid 623 3.1 Dial up Internet Subscribers(3.1.1+3.1.2): 5,749 3.2 Fixed Broadband Subscribers 117,922 3. Total Fixed Internet  Subscribers; (3.1+3.2) 123,671 Fixed Internet Penetration/inhabitant 3.75% Fixed Internet Penetration/household 30.74% Mobile Broadband  January 4. Active Mobile Broadband Subscribers ¹ 1,815,823 Mobile Broadband Penetration/inhabitant 55.10%
  • 2. ¹ As per ITU definition the (Mobile broadband subscribers (potential access)) has been replaced with the Active Mobile Broadband Subscribers.  The Active Mobile Broadband subscribers has been calculated as per ITU Handbook to represent the sum of:  (i) Dedicated mobile broadband subscriptions: (All subscribers who have subscribed to a data plan which has a subscription charge and fixed period of subscription irrespective of the subscription duration (daily, weekly or monthly plans)  (ii) Standard Mobile Broadband Subscriptions: (subscribers who use 3G broadband service at least once in a month without subscribing to a fixed duration plan. These are generally called “pay as you go” (PAYG) users.  Note: The New provisional population is (3,295,298) up to Mid of 2011; according to the lastest statistics provided by the National Center for Statistics & Information and households (402,286)