Scaling API-first – The story of a global engineering organization
080403 CCE Coolum
1. Rapid Process Improvement Achieved by Applying a Rational Approach to Culture Media Optimization
Tom Fletcher, Scott D Storms, and Jenny Y Bang
Irvine Scientific, Santa Ana, CA, USA
Abstract Results
The challenge of effective cell culture process development often involves how to simultaneously Phase I. Cell Line Characterization Phase III. Hydrolysate Development Using Design of Experiments for Media Development
meet two competing needs: the need to maximize improvement of process performance and the Evaluate the growth kinetics, productivity and metabolic profile of the cell line in simple batch Blending of three prequalified protein hydrolysates derived from three different non-animal sources Statistical Design of Experiments (DoE) has become an increasingly popular tool for optimizing
need to minimize time spent on process development. This case study describes how applying a culture to establish a process performance baseline was performed using a statistical Design of Experiments (DoE) approach. Each of these culture media. Using computer software, this approach can help address the complexity of
rational approach to culture media optimization produced results that alone led to a seven-fold hydrolysates has been ultrafiltered and proven for performance, low endotoxin, and lot-to-lot evaluating multiple media components and their interactions.
increase in recombinant protein production in less than the available six months time. Employing a consistency. A surface response generated by regression analysis was then used to predict
previously developed approach, the project involved conducting just nine cell culture experiments Cell Growth optimal blends.
to complete six overlapping development phases. The project resulted in an optimized basal A General Description of How Design of Experiments (DoE) was Applied
4 100
Viable Cell Density (x1E6 cells/mL)
medium, an optimized feed medium and an optimized feeding strategy, each tailored to the specific
metabolic requirements of a previously established recombinant Chinese Hamster Ovary (CHO) 90 Optima
1. Experiments were planned – factors, levels, and responses
cell line. 80 Growth Production
3 2. Experiments were performed
70
60
% Viability
The goal of this project was to improve the cell culture process yield from the initial level of 3. Regression analysis was used to generate surface responses
approximately 200 mg/L to at least 500 mg/L. An important first step was to characterize the 2 50 4. Optima were predicted (growth and production)
behavior of the cell line in batch culture by acquiring data describing both its growth kinetics and, 40
through chemical analysis, a metabolic profile. Analysis of these data provided enough guidance to
CCD Titer 5. Weighted optima were combined to predict “Desirability”
VCD 30
establish a preliminary fed-batch process based on the simple replacement of potentially limiting 1 % Viability 6. Verification experiments were performed
components at rates approximately matching their calculated cell specific depletion rates. The 20
project proceeded to focus on feed optimization; hydrolysate selection, blending and optimization; 10 A A
basal medium optimization; feed volume and timing; and finally, the combination of results from
each phase into a practical process. Although incremental improvements were achieved at each
0 0 B Phase VI. Final Verification
B
phase of development, the complete value of those individual discoveries was not apparent until 0 1 2 3 4 5 6 7 8 9 10 11 12 13 14 Verify the performance of the new process by combining all of the individual improvements
they were combined into a final verification experiment. The resulting fed-batch process produced Days discovered in the preceding phases into a combined fed-batch process and comparing the results
over 1,500 mg/L recombinant protein in less than two weeks. to the initial process. The resulting fed-batch process produced over 1,500 mg/L recombinant
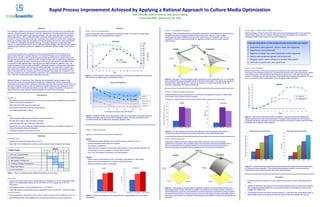
Figure 1. Growth Kinetics. Initial cell growth behavior of the previously established recombinant C
CHO cell line was determined in a simple batch culture. C protein in a fourteen day cell culture process. These results were subsequently verified by the end-
user (our customer) both in shaker flasks and in bioreactors (data not shown).
Figure 4. Each apex of these triangular graphs represents a pure hydrolysate (A, B, or C) while the
Statistical Design of Experiments (DoE) methods were employed in several phases to help area in-between the apices represents blends of the three hydrolysates. The vertical axis represents
minimize the number of experiments and thereby save valuable time. Certain critical media Amino Acid Depletion the performance response; growth measured on the left as cumulative cell density (CCD) and
component concentrations were optimized individually while other less important components were production measured on the right as product titer. 9 Growth
optimized in logically chosen groups. By measuring multiple responses and including up to forty-
Viable Cell Density (x1E6 cells/mL)
0. 1 0
8
one design points in individual experiments we were able to explore broad fields of prospective 0. 0 9
design space and rapidly generate reliable predictions of optima within that space. 0. 0 8
7
Phase IV. Feeding Strategy Development
Concentration (g/L)
6
0. 0 7
Introduction
0. 0 6
Using the feeding solution developed in P II, this Phase of development focused on determining 5
0. 0 5
Histidine the total feed volume and the timing of addition. CD Batch
Background Tyrosine 4 Optimized FB
Conclusion – Feed 2% of the culture working volume daily on days two through seven.
0. 0 4
• Recombinant Chinese Hamster Ovary (CHO) cell line was previously established to produce the 0. 0 3
Phenylalanine 3
protein of interest as a therapeutic 0. 0 2
Methionine 70 Growth 1200 Production
2
• Initial yield of 200-250 mg/L in fourteen days 0. 0 1
Tryptophan
Cumulative Cell Density (x1E6 cell-days/mL)
60 1000 1
• Cell specific productivity of less than 20 pg/cell/day
0. 0 0
0 5 10 15 20 25 30 50 0
• Chemically-defined batch cultures 800
0 1 2 3 4 5 6 7 8 9 10 11 12 13 14
Titer (mg/L)
Cumulative Cell Density (x1E6 cells-days/mL)
40 Days
600
Goals Figure 2. Metabolic Profile. Amino acid analysis of five out of the twenty amino acids analyzed. 30 Figure 7. Daily cell counting allowed direct comparison of growth performance between the
• Improve process yields through cell culture media development Samples were taken daily from the initial simple batch culture. Results were plotted versus
400 original process and the new improved process. This graph helps illustrate how the increase in
cumulative cell density to determine cell-specific depletion rates. 20
• Develop basal medium, feed and feeding strategy cumulative cell density (cell-days/mL) for the new process is due both to a higher maximum viable
200 cell density and increased culture longevity.
• Achieve at least 500 mg/L in fed-batch cell culture 10
• Develop the cell culture media as complete powders requiring only the addition of water and 0 0
Batch FB d2-7 FB d3-8
Sodium Bicarbonate during reconstitution Batch FB d2-7 FB d3-8
• Complete the project in less than six months Phase II. Feed Development
Figure 5. Six daily feeding events were more effective in improving process performance if Growth Improvements by Phase YieId Improvements by Phase
1600
conducted on days two through seven than if conducted on days three through eight. 80
Approach: Conduct two rounds of feed development
Methods
Cumulative Cell Density (x1E6 cell‐days/mL)
70 1400
Overall Approach Round 1 Phase V. Basal Optimization 60 1200
• Organize the project into logical phases (Table 1) • Calculate cell-specific depletion rates of Amino Acids and Vitamins (Figure 2) Although the original chemically-defined basal medium had been chosen for its superior
50 1000
• Include all depleted Amino Acids and Vitamins performance compared to other available media, the final phase of development applied DoE to
Titer (mg/L)
• Begin with Feed Development in order to achieve maximum initial process improvement
• Omit surplus components discover empirically how the existing nutrients could be optimized for this individual cell line. 40 800
• Determine each component concentration based directly on its cell-specific depletion rate Nutrients were grouped logically either by functional role or by physical characteristics.
Month 30 600
Project Phase • Concentrate as much as possible to minimize dilution effects Optima
1 2 3 4 5
• Use 1X for Trace Metals, Antioxidants, and Intermediates 20 400
I. Cell Line Characterization Growth Production
10 200
II. Feed Development Round 2
• Perform spent media analysis on day 14 fed-batch supernatants (vs. fresh basal) 0
PI PII PIII PIV PV
0
PI PII PIII PIV PV
III. Hydrolysate Development
• Adjust component concentrations to restore original basal ratios
IV. Feeding Strategy Development • Maximize total feed medium concentration
V. Basal Optimization Figure 8. Incremental process performance improvements were achieved at each project phase
40
Growth 500
Production CCD Titer for both growth and production. The combined improvements resulted in a new process that
VI. Final Verification produced more than seven times the yield of the original process.
Cumulative Cell Density (x1E6 cell-days/mL)
171%
157% 450
35 151% 151%
Table 1. The six overlapping project phases distributed over five months. 400
30
350
Summary
Titer (mg/L)
25
Cell Culture 300
20 250
• Conduct cell culture experiments in parallel 30 mL cultures grown in 125 mL disposable shaker Group C 1. Process yields were increased more than seven-fold through cell culture media development
Group B Group C Group B
flasks on an orbital shaker platform set at 120 RPM in a 37°C incubator with a 5% CO2 15
200 alone.
atmosphere 150
10 2. Applying an effective project approach that included statistical Design of Experiments methods
• Initial seeding density in each experiment was 2 x 10⁵ cells/mL 100
Figure 6. These graphs were generated by regression analysis of culture performance data from and overlapping phases allowed the process improvements to be developed in less than the
5
50
• Viable cell density was measured using an automated counter (Vi-Cell XR™, Beckman Coulter) thirty design points. Although the approach itself is not limited by the number of factors, this type of available six months time.
0 0
“three-dimensional” graph can only illustrate the combined responses (vertical axis) when two factors
Chemical Analysis CD Batch CD FedBatch CD Optimized CD Batch CD FedBatch CD Optimized 3. The resulting fed-batch cell culture process produced 1.5 grams per liter recombinant protein in
are varied (horizontal axes). This pair of graphs shows how two groups of amino acids affect culture
• Product yields were measured by HPLC using a protein-G column and UV detection at 214 nm shaker flasks using a pre-existing cell line producing less than 20 picograms per cell-day.
Figure 3. Growth and production were measured and compared after each round of feed performance and illustrate how regression analysis allows the prediction of optima for both growth and
• Spent media samples were analyzed for amino acids and vitamins by reverse-phase HPLC development. production.