確信=未来は明るい!
• 推定結果とかちかち調査の結果が、概ね一致。
• ヤフーの位置情報は、街の人の動きを表している。
KentaroNishi, Kota Tsubouchi, and Masamichi Shimosaka. 2014. Hourly pedestrian population
trends estimation using location data from smartphones dealing with temporal and spatial
sparsity. In Proceedings of the 22nd ACM SIGSPATIAL International Conference on Advances in
Geographic Information Systems (SIGSPATIAL '14). ACM, New York, NY, USA, 281-290.
Copyright 2018 YahooJapan Corporation. All Rights Reserved.
いつものパタン?
• 簡単な統計処理の求め方ではうまくいかない!
19.
Copyright 2018 YahooJapan Corporation. All Rights Reserved.
バイリニアポアソン回帰モデル
• 時間tと要因dの組合せを考慮
• 早く計算できる!
• 条件を指定して、パタンをうまく
抽出できる!
20.
Copyright 2018 YahooJapan Corporation. All Rights Reserved.
バイリニアポアソン回帰モデルの評価
• 予測誤差が小さい
• 人数
• 波形(ピーク)
• 既存手法より優れた方法
21.
Copyright 2018 YahooJapan Corporation. All Rights Reserved.
武器=いつものパタンを正しく
• バイリニアポアソン回帰モデル
• いつものパタンを抽出できる。
• “いつも”の意味を指定できる。
Masamichi Shimosaka, Keisuke Maeda, Takeshi Tsukiji, and Kota Tsubouchi. 2015. Forecasting
urban dynamics with mobility logs by bilinear Poisson regression. In Proceedings of the 2015
ACM International Joint Conference on Pervasive and Ubiquitous Computing(UbiComp '15). ACM,
New York, NY, USA, 535-546.
Copyright 2018 YahooJapan Corporation. All Rights Reserved.
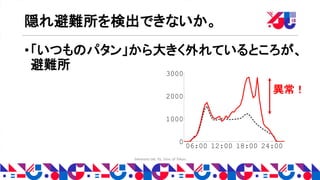
事例2:隠れ避難所検出
• 「いつものパタン」との差異で避難地域を特定
• 公式避難所との差分で、隠れ避難所を検出
• 解析自体は数時間程度で可能
Takahiro Yabe, Kota Tsubouchi, Akihito Sudo, and Yoshihide Sekimoto. 2016. Predicting irregular
individual movement following frequent mid-level disasters using location data from
smartphones. In Proceedings of the 24th ACM SIGSPATIAL International Conference on Advances
in Geographic Information Systems (GIS '16). ACM, New York, NY, USA, Article 54
Copyright 2018 YahooJapan Corporation. All Rights Reserved.
事例3:街の頑強性評価
• いつものパタンとの差異を調べ、災害に対する頑強
性を評価。
• 直感に合う結果、頑強性を数値化。
Takahiro Yabe, Kota Tsubouchi, and Yoshihide Sekimoto. 2017. CityFlowFragility: Measuring the
Fragility of People Flow in Cities to Disasters using GPS Data Collected from Smartphones. Proc.
ACM Interact. Mob. Wearable Ubiquitous Technol. 1, 3, Article 117 (September 2017), 17 pages.