SlideShare a Scribd company logo
1 of 3
Download to read offline
CONFÉRENCE DES NATIONS UNIES SUR                                                                                 UNITED NATIONS CONFERENCE
  LE COMMERCE ET LE DÉVELOPPEMENT                                                                                  ON TRADE AND DEVELOPMENT


            World Investment Report 2010
                                                         Investing in a Low-Carbon Economy


                                                                                                                                           EMBARGO
                                                                                                                             The content of this fact sheet, released in 
                                                                                                                           conjunction with WIR10 , must not be quoted, 

Country fact sheet:                                      Malaysia                                                             or summarized in the press, radio, or on 
                                                                                                                                        television before:
                                                                                                                                  17:00 hrs GMT on 22 July 2010


                                           Foreign direct investment (FDI) overview, selected years
                                                                (Millions of dollars and percentages)
                                                                                                            as a percentage of gross fixed capital formation
     FDI flows          1995-2005                2006          2007            2008             2009    1995-2005              2007            2008                2009
                        (Annual average)                                                                (Annual average)

Malaysia
     Inward                      4 068          6 060         8 538           7 318            1 381               14.4             21.2            16.8             3.5
     Outward                     1 983          6 084        11 280          14 988            8 038                7.0             28.0            34.5            20.6
Memorandum
 Indonesia
       Inward                     1 444         4 914         6 928           9 318            4 877                3.1              6.4             6.6             2.9
       Outward                     850          2 726         4 675           5 900            2 949                1.8              4.3             4.2             1.8
 Thailand
       Inward                     4 805          9 517        11 355          8 544            5 949               11.6             17.4            11.4             9.2
       Outward                     425            970          2 850          2 560            3 818                1.0              4.4             3.4             5.9
 South-East Asia
       Inward                   27 954         56 408        73 971          47 289           36 806               16.2             23.9            12.5             9.4
       Outward                  11 543         28 808        50 178          15 387           21 284                7.1             16.4             4.1             5.5
 Asia and Oceania
       Inward                 123 886         284 426       338 226        374 639           303 230                9.7             11.2             9.8             7.5
       Outward                 54 314         154 013       225 550        204 344           176 795                4.3              7.5             5.4             4.4
 Developing economies
       Inward                 211 470         434 366       564 930        630 013           478 349               11.9             14.0            12.5             9.3
       Outward                 79 351         228 691       292 147        296 286           229 159                4.6              7.3             5.9             4.5
 World
       Inward                 741 045        1 459 133     2 099 973     1 770 873         1 114 189               10.3             16.9            12.6             9.1
       Outward                717 852        1 410 574     2 267 547     1 928 799         1 100 993               10.0             18.4            13.8             9.0

                                                                                                                  as a percentage of gross domestic product
     FDI stocks
                                  1995           2000          2007            2008             2009              1995            2007           2008              2009
Malaysia
     Inward                     28 731         52 747        76 612          73 262           74 643               32.3             41.2            33.1            39.0
     Outward                     5 123         15 878        58 233          67 580           75 618                5.8             31.3            30.5            39.5
Memorandum
 Indonesia
       Inward                   20 626          25 060       79 927          67 964           72 841                9.3             18.5            13.3            13.5
       Outward                   5 896           6 940       21 333          27 233           30 183                2.7              4.9             5.3             5.6
 Thailand
       Inward                   17 684          29 915        94 112         93 046           99 000               10.5             38.1            34.2            37.5
       Outward                   2 276           2 203         9 835         12 467           16 303                1.4              4.0             4.6             6.2
 South-East Asia
       Inward                 152 475         266 985       654 935        653 169           689 980               22.6             50.6            43.3            46.3
       Outward                 50 127          84 481       314 272        321 207           342 367                7.7             26.1            23.1            25.2
 Asia and Oceania
       Inward                 571 926        1 072 150     2 877 821     2 540 106         2 905 987               16.3             29.5            22.4            25.8
       Outward                210 589         614 051      1 820 112     1 719 462         1 946 038                6.1             19.0            15.4            17.6
 Developing economies
       Inward                 848 381        1 728 455     4 452 645     4 213 666         4 893 490               14.6             30.0            24.4            29.1
       Outward                329 982         862 628      2 420 321     2 393 251         2 691 484                5.9             16.8            14.3            16.5
 World
       Inward               3 381 329        7 442 548    17 990 069    15 491 182        17 743 408               11.4             32.5            25.4            30.7
       Outward              3 606 556        7 967 460    19 313 981    16 206 795        18 982 118               12.2             35.3            26.8            33.2
Source: UNCTAD, World Investment Report 2010; www.unctad.org/wir or www.unctad.org/fdistatistics.
Cross-border merger and acquisition overview, 1995–2009
                                                                                          (Millions of dollars)
                                                                                Sales(net)                                                                  Purchases(net)
    Region/economy                              1995-2005                     2007                 2008                2009       1995-2005                 2007           2008                  2009
                                               (Annual average)                                                                  (Annual average)

Malaysia                                                    608               6 976                2 781                   354             1 477            3 654             9 751              3 277
Memorandum
      Indonesia                                          1 045               1 706              2 070                1 332                    91            826               913             - 2 590
      Thailand                                           1 000               2 372                142                  346                    60             54             1 416                 872
    South-East Asia                                      4 174              20 061             22 743               12 913                 6 543         25 936            18 922               4 325
   Asia and Oceania                                     19 142              71 657             68 167               38 295                18 927         94 743            95 167             67 534
 Developing economies                                   40 624             100 381            104 812               39 077                25 868        144 830           105 849             73 975
World                                                  357 132           1 022 725            706 543              249 732               357 132      1 022 725           706 543            249 732

Source: UNCTAD, World Investment Report 2010 ; www.unctad.org/wir or www.unctad.org/fdistatistics.


              Country rankings by Inward FDI performance Index and Inward FDI Potential Index, 2007–2009
Economy                                                      Inward FDI Performance                        Economy                                            Inward FDI Potential Index
                                                    2007              2008                  2009                                                     2007              2008              2009
United States                                        116                99                  118            Italy                                      31                 32                 ..
Indonesia                                            120                109                 119            Czech Republic                             34                 33                 ..
Iran, Islamic Republic of                            133                130                 120            Slovenia                                   33                 34                 ..
Bangladesh                                           130                115                 121            Kuwait                                     37                 35                 ..
Taiwan Province of China                             114                116                 122            Libyan Arab Jamahiriya                     35                 36                 ..
Malaysia                                             74                 79                  123            Malaysia                                   39                 37                 ..
Korea, Republic of                                   137                123                 124            New Zealand                                36                 38                 ..
Ecuador                                              136                107                 125            Lithuania                                  38                 39                 ..
Haiti                                                128                132                 126            Hungary                                    40                 40                 ..
Yemen                                                89                 56                  127            Venezuela, Bolivarian Republic of          62                 41                 ..
Kenya                                                99                 133                 128            Poland                                     42                 42                 ..

Source: UNCTAD, World Investment Report 2010 ; www.unctad.org/wir or www.unctad.org/fdistatistics.
Note: Ranking is that of the latest year available. Covering 141 economies. The potential index is based on 12 economic and policy variables.


                       Presence in the world's top 100 non-financial TNCs, ranked by foreign assets, 2008
                                                                        (Millions of dollars and number of employees)

                                                                                                   Ranking by:                                      Foreign                                      a
                                                                                                                                                                                        TNI
    Corporation                                 Industry                                                               a
                                                                                       Foreign assets            TNI                Assets           Sales           Employment       (Per cent)

Petronas - Petroliam Nasional Bhd             Petroleum expl./ref./distr.                     78                  99                 28 447          32 477              7 847              30

Source: UNCTAD/Erasmus University database; www.unctad.org/wir or www.unctad.org/fdistatistics.
a
  TNI, the Transnationlity Index, is calculated as the average of the following three ratios: foreign assets to total assets, foreign sales to total sales and foreign employment to tota
employment.


        Presence in the top 100 non-financial TNCs from developing countries, ranked by foreign assets, 2008
                                                                        (Millions of dollars and number of employees)

                                                                                                   Ranking by:                                      Foreign
                                                                                                                                                                                        TNI a
    Corporation                                 Industry                                                               a
                                                                                       Foreign assets            TNI                Assets           Sales          Employment        (Per cent)

Petronas - Petroliam Nasional Bhd             Petroleum expl./ref./distr.                      5                  79                 28 447          32 477             7 847               30
Axiata Group Bhd                              Telecommunications                              31                  23                  8 184           1 746            18 975               68
YTL Corp. Berhad                              Utilities (Electricity, gas and water)          38                  51                  7 014             968             1 931               48
Genting Berhad                                Other consumer services                         56                  50                  5 139             667            16 631               48
Sime Darby Berhad                             Diversified                                     66                  55                  4 307           6 065            25 432               46
Tanjong Public Limited Company                Pharmaceuticals                                 91                  47                  2 445             455               902               49

Source: UNCTAD, World Investment Report 2010; www.unctad.org/wir or www.unctad.org/fdistatistics.
a
 TNI, the Transnationlity Index, is calculated as the average of the following three ratios: foreign assets to total assets, foreign sales to total sales and foreign employment to total
employment.
 *** * * * * * * * * * * * * * * * * * * * * ***
                         This fact sheet and additional information on the World Investment Report 2010 and the Report itself can be found at the following URL:
                                                                             http://www.unctad.org/wir
                 The sources for all this information are the World Investment Report 2010 and UNCTAD databases on FDI/TNC and cross‐border M&As.  These databases can be 
 found at the following URL: 
                                                                       http://www.unctad.org/fdistatistics
The World Investment Report 2010 (WIR10) ( Sales No. E.09.II.D.15 , ISBN: 978‐92‐1‐112775‐1 ) may be obtained from UN Sales Offices at the below mentioned addresses or from UN 
sales agents in many countries.  Price:  US$ 95.00 (50% discount for residents in Developing countries and 75% discount for residents in Least developed countries).  This includes the book 
and the CD‐ROM.  Customers who would like to buy the book or the CD‐ROM separately, or obtain quotations for large quantities, should enquire from the sales offices.

Please send orders or inquiries to: Europe, Africa, Western Asia: United Nations Publication/Sales Section, Palais des Nations, CH‐1211 Geneva 10, fax: +41 22 917 0027, e‐mail: 
unpubli@un.org; Americas, Eastern Asia: United Nations Publications, Two UN Plaza, DC2‐853, New York, N.Y. 10017, U.S.A., telephone: 1 212 963 8302 or 1 800 253 9646, fax: 1 212 963 
3489, e‐mail: publications@un.org. Internet: http://www.un.org/publications.

For more information, please contact:   Masataka Fujita, Officer‐in‐Charge, Investment Trends and Issues Branch, Division on Investment and Enterprise, UNCTAD, tel: +41 22 917 6217, 
fax: +41 22 917 0194, or e‐mail: masataka.fujita@unctad.org; or Press Office, tel: +41 22 917 5828 / 1646, fax: +41 22 917 0051, or e‐mail: unctadpress@unctad.org 

More Related Content

What's hot

Nrf13 brasil varejo vencer na arena global
Nrf13 brasil varejo vencer na arena globalNrf13 brasil varejo vencer na arena global
Nrf13 brasil varejo vencer na arena globalBrasil Varejo
 
The Bayt.com Middle East Consumer Confidence Index- March 2013
The Bayt.com Middle East Consumer Confidence Index- March 2013The Bayt.com Middle East Consumer Confidence Index- March 2013
The Bayt.com Middle East Consumer Confidence Index- March 2013Bayt.com
 
Fact sheet industry facts iata
Fact sheet industry facts   iataFact sheet industry facts   iata
Fact sheet industry facts iataprinci05
 
Venture Backed Exits - Q4 '07/full year 2007
 	Venture Backed Exits - Q4 '07/full year 2007   	Venture Backed Exits - Q4 '07/full year 2007
Venture Backed Exits - Q4 '07/full year 2007 mensa25
 
India Hydrocarbon Sector : The End of Beginning.
India Hydrocarbon Sector : The End of Beginning.India Hydrocarbon Sector : The End of Beginning.
India Hydrocarbon Sector : The End of Beginning.vgresearch
 
Connecting Dubai to Global Markets-Dubai Exports
Connecting Dubai to Global Markets-Dubai  ExportsConnecting Dubai to Global Markets-Dubai  Exports
Connecting Dubai to Global Markets-Dubai ExportsDubaiExports
 
FOSS4G opening session
FOSS4G opening sessionFOSS4G opening session
FOSS4G opening sessionPeter Batty
 
Countries having GDP less than net worth of Stanford founded companies
Countries having GDP less than net worth of Stanford founded companies Countries having GDP less than net worth of Stanford founded companies
Countries having GDP less than net worth of Stanford founded companies Arun Prasad
 
Apresentação 2 t11 e 1s11 eng
Apresentação 2 t11 e 1s11 engApresentação 2 t11 e 1s11 eng
Apresentação 2 t11 e 1s11 engLocaliza
 
Smgr corp presentation_juni_2013
Smgr corp presentation_juni_2013Smgr corp presentation_juni_2013
Smgr corp presentation_juni_2013Bobby D'Arch
 
VC Fundraising Q2 2005
  	VC Fundraising Q2 2005   	VC Fundraising Q2 2005
VC Fundraising Q2 2005 mensa25
 
David A. Gantz and Bashar H. Malkawi, The strong will inherit
David A. Gantz and Bashar H. Malkawi, The strong will inheritDavid A. Gantz and Bashar H. Malkawi, The strong will inherit
David A. Gantz and Bashar H. Malkawi, The strong will inheritBashar H. Malkawi
 

What's hot (16)

Tech Room Power Point
Tech Room Power PointTech Room Power Point
Tech Room Power Point
 
Nrf13 brasil varejo vencer na arena global
Nrf13 brasil varejo vencer na arena globalNrf13 brasil varejo vencer na arena global
Nrf13 brasil varejo vencer na arena global
 
Think Latin America: Live Positively
Think Latin America: Live PositivelyThink Latin America: Live Positively
Think Latin America: Live Positively
 
Migrant Entrepreneurship in OECD Countries
Migrant Entrepreneurship in OECD CountriesMigrant Entrepreneurship in OECD Countries
Migrant Entrepreneurship in OECD Countries
 
The Bayt.com Middle East Consumer Confidence Index- March 2013
The Bayt.com Middle East Consumer Confidence Index- March 2013The Bayt.com Middle East Consumer Confidence Index- March 2013
The Bayt.com Middle East Consumer Confidence Index- March 2013
 
Fact sheet industry facts iata
Fact sheet industry facts   iataFact sheet industry facts   iata
Fact sheet industry facts iata
 
Venture Backed Exits - Q4 '07/full year 2007
 	Venture Backed Exits - Q4 '07/full year 2007   	Venture Backed Exits - Q4 '07/full year 2007
Venture Backed Exits - Q4 '07/full year 2007
 
India Hydrocarbon Sector : The End of Beginning.
India Hydrocarbon Sector : The End of Beginning.India Hydrocarbon Sector : The End of Beginning.
India Hydrocarbon Sector : The End of Beginning.
 
Connecting Dubai to Global Markets-Dubai Exports
Connecting Dubai to Global Markets-Dubai  ExportsConnecting Dubai to Global Markets-Dubai  Exports
Connecting Dubai to Global Markets-Dubai Exports
 
FOSS4G opening session
FOSS4G opening sessionFOSS4G opening session
FOSS4G opening session
 
Countries having GDP less than net worth of Stanford founded companies
Countries having GDP less than net worth of Stanford founded companies Countries having GDP less than net worth of Stanford founded companies
Countries having GDP less than net worth of Stanford founded companies
 
One Nielsen Press Briefing, 28 March 2011
One Nielsen Press Briefing, 28 March 2011One Nielsen Press Briefing, 28 March 2011
One Nielsen Press Briefing, 28 March 2011
 
Apresentação 2 t11 e 1s11 eng
Apresentação 2 t11 e 1s11 engApresentação 2 t11 e 1s11 eng
Apresentação 2 t11 e 1s11 eng
 
Smgr corp presentation_juni_2013
Smgr corp presentation_juni_2013Smgr corp presentation_juni_2013
Smgr corp presentation_juni_2013
 
VC Fundraising Q2 2005
  	VC Fundraising Q2 2005   	VC Fundraising Q2 2005
VC Fundraising Q2 2005
 
David A. Gantz and Bashar H. Malkawi, The strong will inherit
David A. Gantz and Bashar H. Malkawi, The strong will inheritDavid A. Gantz and Bashar H. Malkawi, The strong will inherit
David A. Gantz and Bashar H. Malkawi, The strong will inherit
 

Similar to UNCTAD report highlights Malaysia's FDI trends

Fdi & Fii Final
Fdi & Fii  FinalFdi & Fii  Final
Fdi & Fii FinalJonty Mohta
 
2009 Annual Results
2009 Annual Results2009 Annual Results
2009 Annual ResultsAREVA
 
Recap des résultats 2010 sociétés cotées
Recap des résultats 2010 sociétés cotéesRecap des résultats 2010 sociétés cotées
Recap des résultats 2010 sociétés cotéesIDIR2001
 
Recap des sociétés cotées
Recap des sociétés cotéesRecap des sociétés cotées
Recap des sociétés cotéesIDIR2001
 
Tabla salarial magisterio colombiano año 2012
Tabla salarial magisterio colombiano año 2012Tabla salarial magisterio colombiano año 2012
Tabla salarial magisterio colombiano año 2012IVAN LOPEZ DUQUE
 
หนี้สาธารณะโลก
หนี้สาธารณะโลกหนี้สาธารณะโลก
หนี้สาธารณะโลกBoom Rakkanchanan
 
ธนาคารกสิกรไทย
ธนาคารกสิกรไทย ธนาคารกสิกรไทย
ธนาคารกสิกรไทย Adcha'z Tawinprai
 
Webcast 3Q09 Sep09 Eng
Webcast 3Q09 Sep09  EngWebcast 3Q09 Sep09  Eng
Webcast 3Q09 Sep09 EngLocaliza
 
Webcast 1 q13 eng
Webcast 1 q13 engWebcast 1 q13 eng
Webcast 1 q13 engLocaliza
 
Presentation of alanya by i̇sak uzun
Presentation of alanya by i̇sak uzunPresentation of alanya by i̇sak uzun
Presentation of alanya by i̇sak uzunİsak Uzun
 
اثر اتفاقية اغادير على الميزان التجارى بين مصر ودول الاتفاقية
اثر اتفاقية اغادير على الميزان التجارى بين مصر ودول الاتفاقيةاثر اتفاقية اغادير على الميزان التجارى بين مصر ودول الاتفاقية
اثر اتفاقية اغادير على الميزان التجارى بين مصر ودول الاتفاقيةخالد سمير الهلالي
 
Impacts of economic recession on cambodia garment industries
Impacts of economic recession on cambodia garment industriesImpacts of economic recession on cambodia garment industries
Impacts of economic recession on cambodia garment industriesNarith Por
 
national oilwell varco Fourth Quarter 2008 Segmented Financial Data
national oilwell varco Fourth Quarter 2008 Segmented Financial Datanational oilwell varco Fourth Quarter 2008 Segmented Financial Data
national oilwell varco Fourth Quarter 2008 Segmented Financial Datafinance40
 
Abch group results booklet 2010
Abch group results booklet 2010Abch group results booklet 2010
Abch group results booklet 2010wgjlubbe
 
Is Ireland the Role Model for Austerity?
Is Ireland the Role Model for Austerity?Is Ireland the Role Model for Austerity?
Is Ireland the Role Model for Austerity?Stephen Kinsella
 

Similar to UNCTAD report highlights Malaysia's FDI trends (20)

Fdi & Fii Final
Fdi & Fii  FinalFdi & Fii  Final
Fdi & Fii Final
 
2009 Annual Results
2009 Annual Results2009 Annual Results
2009 Annual Results
 
Recap des résultats 2010 sociétés cotées
Recap des résultats 2010 sociétés cotéesRecap des résultats 2010 sociétés cotées
Recap des résultats 2010 sociétés cotées
 
Recap des sociétés cotées
Recap des sociétés cotéesRecap des sociétés cotées
Recap des sociétés cotées
 
Tabla salarial magisterio colombiano año 2012
Tabla salarial magisterio colombiano año 2012Tabla salarial magisterio colombiano año 2012
Tabla salarial magisterio colombiano año 2012
 
หนี้สาธารณะโลก
หนี้สาธารณะโลกหนี้สาธารณะโลก
หนี้สาธารณะโลก
 
Apec ppt
Apec pptApec ppt
Apec ppt
 
ธนาคารกสิกรไทย
ธนาคารกสิกรไทย ธนาคารกสิกรไทย
ธนาคารกสิกรไทย
 
Webcast 3Q09 Sep09 Eng
Webcast 3Q09 Sep09  EngWebcast 3Q09 Sep09  Eng
Webcast 3Q09 Sep09 Eng
 
Webcast 1 q13 eng
Webcast 1 q13 engWebcast 1 q13 eng
Webcast 1 q13 eng
 
Presentation of alanya by i̇sak uzun
Presentation of alanya by i̇sak uzunPresentation of alanya by i̇sak uzun
Presentation of alanya by i̇sak uzun
 
اثر اتفاقية اغادير على الميزان التجارى بين مصر ودول الاتفاقية
اثر اتفاقية اغادير على الميزان التجارى بين مصر ودول الاتفاقيةاثر اتفاقية اغادير على الميزان التجارى بين مصر ودول الاتفاقية
اثر اتفاقية اغادير على الميزان التجارى بين مصر ودول الاتفاقية
 
Canon factbook
Canon factbookCanon factbook
Canon factbook
 
VW Financial Services AG Annual Report 2010
VW Financial Services AG Annual Report 2010VW Financial Services AG Annual Report 2010
VW Financial Services AG Annual Report 2010
 
Presentation 4Q09
Presentation 4Q09Presentation 4Q09
Presentation 4Q09
 
Impacts of economic recession on cambodia garment industries
Impacts of economic recession on cambodia garment industriesImpacts of economic recession on cambodia garment industries
Impacts of economic recession on cambodia garment industries
 
national oilwell varco Fourth Quarter 2008 Segmented Financial Data
national oilwell varco Fourth Quarter 2008 Segmented Financial Datanational oilwell varco Fourth Quarter 2008 Segmented Financial Data
national oilwell varco Fourth Quarter 2008 Segmented Financial Data
 
Abch group results booklet 2010
Abch group results booklet 2010Abch group results booklet 2010
Abch group results booklet 2010
 
VW Financial Services AG Annual Report 2011
VW Financial Services AG Annual Report 2011VW Financial Services AG Annual Report 2011
VW Financial Services AG Annual Report 2011
 
Is Ireland the Role Model for Austerity?
Is Ireland the Role Model for Austerity?Is Ireland the Role Model for Austerity?
Is Ireland the Role Model for Austerity?
 

Recently uploaded

Opportunities, challenges, and power of media and information
Opportunities, challenges, and power of media and informationOpportunities, challenges, and power of media and information
Opportunities, challenges, and power of media and informationReyMonsales
 
57 Bidens Annihilation Nation Policy.pdf
57 Bidens Annihilation Nation Policy.pdf57 Bidens Annihilation Nation Policy.pdf
57 Bidens Annihilation Nation Policy.pdfGerald Furnkranz
 
Referendum Party 2024 Election Manifesto
Referendum Party 2024 Election ManifestoReferendum Party 2024 Election Manifesto
Referendum Party 2024 Election ManifestoSABC News
 
Quiz for Heritage Indian including all the rounds
Quiz for Heritage Indian including all the roundsQuiz for Heritage Indian including all the rounds
Quiz for Heritage Indian including all the roundsnaxymaxyy
 
Top 10 Wealthiest People In The World.pdf
Top 10 Wealthiest People In The World.pdfTop 10 Wealthiest People In The World.pdf
Top 10 Wealthiest People In The World.pdfauroraaudrey4826
 
complaint-ECI-PM-media-1-Chandru.pdfra;;prfk
complaint-ECI-PM-media-1-Chandru.pdfra;;prfkcomplaint-ECI-PM-media-1-Chandru.pdfra;;prfk
complaint-ECI-PM-media-1-Chandru.pdfra;;prfkbhavenpr
 
Different Frontiers of Social Media War in Indonesia Elections 2024
Different Frontiers of Social Media War in Indonesia Elections 2024Different Frontiers of Social Media War in Indonesia Elections 2024
Different Frontiers of Social Media War in Indonesia Elections 2024Ismail Fahmi
 
AP Election Survey 2024: TDP-Janasena-BJP Alliance Set To Sweep Victory
AP Election Survey 2024: TDP-Janasena-BJP Alliance Set To Sweep VictoryAP Election Survey 2024: TDP-Janasena-BJP Alliance Set To Sweep Victory
AP Election Survey 2024: TDP-Janasena-BJP Alliance Set To Sweep Victoryanjanibaddipudi1
 
HARNESSING AI FOR ENHANCED MEDIA ANALYSIS A CASE STUDY ON CHATGPT AT DRONE EM...
HARNESSING AI FOR ENHANCED MEDIA ANALYSIS A CASE STUDY ON CHATGPT AT DRONE EM...HARNESSING AI FOR ENHANCED MEDIA ANALYSIS A CASE STUDY ON CHATGPT AT DRONE EM...
HARNESSING AI FOR ENHANCED MEDIA ANALYSIS A CASE STUDY ON CHATGPT AT DRONE EM...Ismail Fahmi
 
Manipur-Book-Final-2-compressed.pdfsal'rpk
Manipur-Book-Final-2-compressed.pdfsal'rpkManipur-Book-Final-2-compressed.pdfsal'rpk
Manipur-Book-Final-2-compressed.pdfsal'rpkbhavenpr
 
Brief biography of Julius Robert Oppenheimer
Brief biography of Julius Robert OppenheimerBrief biography of Julius Robert Oppenheimer
Brief biography of Julius Robert OppenheimerOmarCabrera39
 
Chandrayaan 3 Successful Moon Landing Mission.pdf
Chandrayaan 3 Successful Moon Landing Mission.pdfChandrayaan 3 Successful Moon Landing Mission.pdf
Chandrayaan 3 Successful Moon Landing Mission.pdfauroraaudrey4826
 
VIP Girls Available Call or WhatsApp 9711199012
VIP Girls Available Call or WhatsApp 9711199012VIP Girls Available Call or WhatsApp 9711199012
VIP Girls Available Call or WhatsApp 9711199012ankitnayak356677
 
Dynamics of Destructive Polarisation in Mainstream and Social Media: The Case...
Dynamics of Destructive Polarisation in Mainstream and Social Media: The Case...Dynamics of Destructive Polarisation in Mainstream and Social Media: The Case...
Dynamics of Destructive Polarisation in Mainstream and Social Media: The Case...Axel Bruns
 
Global Terrorism and its types and prevention ppt.
Global Terrorism and its types and prevention ppt.Global Terrorism and its types and prevention ppt.
Global Terrorism and its types and prevention ppt.NaveedKhaskheli1
 
N Chandrababu Naidu Launches 'Praja Galam' As Part of TDP’s Election Campaign
N Chandrababu Naidu Launches 'Praja Galam' As Part of TDP’s Election CampaignN Chandrababu Naidu Launches 'Praja Galam' As Part of TDP’s Election Campaign
N Chandrababu Naidu Launches 'Praja Galam' As Part of TDP’s Election Campaignanjanibaddipudi1
 

Recently uploaded (16)

Opportunities, challenges, and power of media and information
Opportunities, challenges, and power of media and informationOpportunities, challenges, and power of media and information
Opportunities, challenges, and power of media and information
 
57 Bidens Annihilation Nation Policy.pdf
57 Bidens Annihilation Nation Policy.pdf57 Bidens Annihilation Nation Policy.pdf
57 Bidens Annihilation Nation Policy.pdf
 
Referendum Party 2024 Election Manifesto
Referendum Party 2024 Election ManifestoReferendum Party 2024 Election Manifesto
Referendum Party 2024 Election Manifesto
 
Quiz for Heritage Indian including all the rounds
Quiz for Heritage Indian including all the roundsQuiz for Heritage Indian including all the rounds
Quiz for Heritage Indian including all the rounds
 
Top 10 Wealthiest People In The World.pdf
Top 10 Wealthiest People In The World.pdfTop 10 Wealthiest People In The World.pdf
Top 10 Wealthiest People In The World.pdf
 
complaint-ECI-PM-media-1-Chandru.pdfra;;prfk
complaint-ECI-PM-media-1-Chandru.pdfra;;prfkcomplaint-ECI-PM-media-1-Chandru.pdfra;;prfk
complaint-ECI-PM-media-1-Chandru.pdfra;;prfk
 
Different Frontiers of Social Media War in Indonesia Elections 2024
Different Frontiers of Social Media War in Indonesia Elections 2024Different Frontiers of Social Media War in Indonesia Elections 2024
Different Frontiers of Social Media War in Indonesia Elections 2024
 
AP Election Survey 2024: TDP-Janasena-BJP Alliance Set To Sweep Victory
AP Election Survey 2024: TDP-Janasena-BJP Alliance Set To Sweep VictoryAP Election Survey 2024: TDP-Janasena-BJP Alliance Set To Sweep Victory
AP Election Survey 2024: TDP-Janasena-BJP Alliance Set To Sweep Victory
 
HARNESSING AI FOR ENHANCED MEDIA ANALYSIS A CASE STUDY ON CHATGPT AT DRONE EM...
HARNESSING AI FOR ENHANCED MEDIA ANALYSIS A CASE STUDY ON CHATGPT AT DRONE EM...HARNESSING AI FOR ENHANCED MEDIA ANALYSIS A CASE STUDY ON CHATGPT AT DRONE EM...
HARNESSING AI FOR ENHANCED MEDIA ANALYSIS A CASE STUDY ON CHATGPT AT DRONE EM...
 
Manipur-Book-Final-2-compressed.pdfsal'rpk
Manipur-Book-Final-2-compressed.pdfsal'rpkManipur-Book-Final-2-compressed.pdfsal'rpk
Manipur-Book-Final-2-compressed.pdfsal'rpk
 
Brief biography of Julius Robert Oppenheimer
Brief biography of Julius Robert OppenheimerBrief biography of Julius Robert Oppenheimer
Brief biography of Julius Robert Oppenheimer
 
Chandrayaan 3 Successful Moon Landing Mission.pdf
Chandrayaan 3 Successful Moon Landing Mission.pdfChandrayaan 3 Successful Moon Landing Mission.pdf
Chandrayaan 3 Successful Moon Landing Mission.pdf
 
VIP Girls Available Call or WhatsApp 9711199012
VIP Girls Available Call or WhatsApp 9711199012VIP Girls Available Call or WhatsApp 9711199012
VIP Girls Available Call or WhatsApp 9711199012
 
Dynamics of Destructive Polarisation in Mainstream and Social Media: The Case...
Dynamics of Destructive Polarisation in Mainstream and Social Media: The Case...Dynamics of Destructive Polarisation in Mainstream and Social Media: The Case...
Dynamics of Destructive Polarisation in Mainstream and Social Media: The Case...
 
Global Terrorism and its types and prevention ppt.
Global Terrorism and its types and prevention ppt.Global Terrorism and its types and prevention ppt.
Global Terrorism and its types and prevention ppt.
 
N Chandrababu Naidu Launches 'Praja Galam' As Part of TDP’s Election Campaign
N Chandrababu Naidu Launches 'Praja Galam' As Part of TDP’s Election CampaignN Chandrababu Naidu Launches 'Praja Galam' As Part of TDP’s Election Campaign
N Chandrababu Naidu Launches 'Praja Galam' As Part of TDP’s Election Campaign
 

UNCTAD report highlights Malaysia's FDI trends

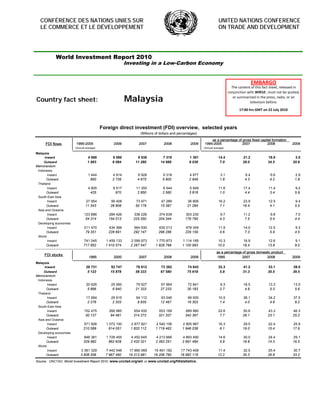
  • 1. CONFÉRENCE DES NATIONS UNIES SUR UNITED NATIONS CONFERENCE LE COMMERCE ET LE DÉVELOPPEMENT ON TRADE AND DEVELOPMENT World Investment Report 2010 Investing in a Low-Carbon Economy EMBARGO The content of this fact sheet, released in  conjunction with WIR10 , must not be quoted,  Country fact sheet: Malaysia or summarized in the press, radio, or on  television before: 17:00 hrs GMT on 22 July 2010 Foreign direct investment (FDI) overview, selected years (Millions of dollars and percentages) as a percentage of gross fixed capital formation FDI flows 1995-2005 2006 2007 2008 2009 1995-2005 2007 2008 2009 (Annual average) (Annual average) Malaysia Inward 4 068 6 060 8 538 7 318 1 381 14.4 21.2 16.8 3.5 Outward 1 983 6 084 11 280 14 988 8 038 7.0 28.0 34.5 20.6 Memorandum Indonesia Inward 1 444 4 914 6 928 9 318 4 877 3.1 6.4 6.6 2.9 Outward 850 2 726 4 675 5 900 2 949 1.8 4.3 4.2 1.8 Thailand Inward 4 805 9 517 11 355 8 544 5 949 11.6 17.4 11.4 9.2 Outward 425 970 2 850 2 560 3 818 1.0 4.4 3.4 5.9 South-East Asia Inward 27 954 56 408 73 971 47 289 36 806 16.2 23.9 12.5 9.4 Outward 11 543 28 808 50 178 15 387 21 284 7.1 16.4 4.1 5.5 Asia and Oceania Inward 123 886 284 426 338 226 374 639 303 230 9.7 11.2 9.8 7.5 Outward 54 314 154 013 225 550 204 344 176 795 4.3 7.5 5.4 4.4 Developing economies Inward 211 470 434 366 564 930 630 013 478 349 11.9 14.0 12.5 9.3 Outward 79 351 228 691 292 147 296 286 229 159 4.6 7.3 5.9 4.5 World Inward 741 045 1 459 133 2 099 973 1 770 873 1 114 189 10.3 16.9 12.6 9.1 Outward 717 852 1 410 574 2 267 547 1 928 799 1 100 993 10.0 18.4 13.8 9.0 as a percentage of gross domestic product FDI stocks 1995 2000 2007 2008 2009 1995 2007 2008 2009 Malaysia Inward 28 731 52 747 76 612 73 262 74 643 32.3 41.2 33.1 39.0 Outward 5 123 15 878 58 233 67 580 75 618 5.8 31.3 30.5 39.5 Memorandum Indonesia Inward 20 626 25 060 79 927 67 964 72 841 9.3 18.5 13.3 13.5 Outward 5 896 6 940 21 333 27 233 30 183 2.7 4.9 5.3 5.6 Thailand Inward 17 684 29 915 94 112 93 046 99 000 10.5 38.1 34.2 37.5 Outward 2 276 2 203 9 835 12 467 16 303 1.4 4.0 4.6 6.2 South-East Asia Inward 152 475 266 985 654 935 653 169 689 980 22.6 50.6 43.3 46.3 Outward 50 127 84 481 314 272 321 207 342 367 7.7 26.1 23.1 25.2 Asia and Oceania Inward 571 926 1 072 150 2 877 821 2 540 106 2 905 987 16.3 29.5 22.4 25.8 Outward 210 589 614 051 1 820 112 1 719 462 1 946 038 6.1 19.0 15.4 17.6 Developing economies Inward 848 381 1 728 455 4 452 645 4 213 666 4 893 490 14.6 30.0 24.4 29.1 Outward 329 982 862 628 2 420 321 2 393 251 2 691 484 5.9 16.8 14.3 16.5 World Inward 3 381 329 7 442 548 17 990 069 15 491 182 17 743 408 11.4 32.5 25.4 30.7 Outward 3 606 556 7 967 460 19 313 981 16 206 795 18 982 118 12.2 35.3 26.8 33.2 Source: UNCTAD, World Investment Report 2010; www.unctad.org/wir or www.unctad.org/fdistatistics.
  • 2. Cross-border merger and acquisition overview, 1995–2009 (Millions of dollars) Sales(net) Purchases(net) Region/economy 1995-2005 2007 2008 2009 1995-2005 2007 2008 2009 (Annual average) (Annual average) Malaysia 608 6 976 2 781 354 1 477 3 654 9 751 3 277 Memorandum Indonesia 1 045 1 706 2 070 1 332 91 826 913 - 2 590 Thailand 1 000 2 372 142 346 60 54 1 416 872 South-East Asia 4 174 20 061 22 743 12 913 6 543 25 936 18 922 4 325 Asia and Oceania 19 142 71 657 68 167 38 295 18 927 94 743 95 167 67 534 Developing economies 40 624 100 381 104 812 39 077 25 868 144 830 105 849 73 975 World 357 132 1 022 725 706 543 249 732 357 132 1 022 725 706 543 249 732 Source: UNCTAD, World Investment Report 2010 ; www.unctad.org/wir or www.unctad.org/fdistatistics. Country rankings by Inward FDI performance Index and Inward FDI Potential Index, 2007–2009 Economy Inward FDI Performance Economy Inward FDI Potential Index 2007 2008 2009 2007 2008 2009 United States 116 99 118 Italy 31 32 .. Indonesia 120 109 119 Czech Republic 34 33 .. Iran, Islamic Republic of 133 130 120 Slovenia 33 34 .. Bangladesh 130 115 121 Kuwait 37 35 .. Taiwan Province of China 114 116 122 Libyan Arab Jamahiriya 35 36 .. Malaysia 74 79 123 Malaysia 39 37 .. Korea, Republic of 137 123 124 New Zealand 36 38 .. Ecuador 136 107 125 Lithuania 38 39 .. Haiti 128 132 126 Hungary 40 40 .. Yemen 89 56 127 Venezuela, Bolivarian Republic of 62 41 .. Kenya 99 133 128 Poland 42 42 .. Source: UNCTAD, World Investment Report 2010 ; www.unctad.org/wir or www.unctad.org/fdistatistics. Note: Ranking is that of the latest year available. Covering 141 economies. The potential index is based on 12 economic and policy variables. Presence in the world's top 100 non-financial TNCs, ranked by foreign assets, 2008 (Millions of dollars and number of employees) Ranking by: Foreign a TNI Corporation Industry a Foreign assets TNI Assets Sales Employment (Per cent) Petronas - Petroliam Nasional Bhd Petroleum expl./ref./distr. 78 99 28 447 32 477 7 847 30 Source: UNCTAD/Erasmus University database; www.unctad.org/wir or www.unctad.org/fdistatistics. a TNI, the Transnationlity Index, is calculated as the average of the following three ratios: foreign assets to total assets, foreign sales to total sales and foreign employment to tota employment. Presence in the top 100 non-financial TNCs from developing countries, ranked by foreign assets, 2008 (Millions of dollars and number of employees) Ranking by: Foreign TNI a Corporation Industry a Foreign assets TNI Assets Sales Employment (Per cent) Petronas - Petroliam Nasional Bhd Petroleum expl./ref./distr. 5 79 28 447 32 477 7 847 30 Axiata Group Bhd Telecommunications 31 23 8 184 1 746 18 975 68 YTL Corp. Berhad Utilities (Electricity, gas and water) 38 51 7 014 968 1 931 48 Genting Berhad Other consumer services 56 50 5 139 667 16 631 48 Sime Darby Berhad Diversified 66 55 4 307 6 065 25 432 46 Tanjong Public Limited Company Pharmaceuticals 91 47 2 445 455 902 49 Source: UNCTAD, World Investment Report 2010; www.unctad.org/wir or www.unctad.org/fdistatistics. a TNI, the Transnationlity Index, is calculated as the average of the following three ratios: foreign assets to total assets, foreign sales to total sales and foreign employment to total employment.
  • 3.  *** * * * * * * * * * * * * * * * * * * * * *** This fact sheet and additional information on the World Investment Report 2010 and the Report itself can be found at the following URL: http://www.unctad.org/wir                 The sources for all this information are the World Investment Report 2010 and UNCTAD databases on FDI/TNC and cross‐border M&As.  These databases can be  found at the following URL:  http://www.unctad.org/fdistatistics The World Investment Report 2010 (WIR10) ( Sales No. E.09.II.D.15 , ISBN: 978‐92‐1‐112775‐1 ) may be obtained from UN Sales Offices at the below mentioned addresses or from UN  sales agents in many countries.  Price:  US$ 95.00 (50% discount for residents in Developing countries and 75% discount for residents in Least developed countries).  This includes the book  and the CD‐ROM.  Customers who would like to buy the book or the CD‐ROM separately, or obtain quotations for large quantities, should enquire from the sales offices. Please send orders or inquiries to: Europe, Africa, Western Asia: United Nations Publication/Sales Section, Palais des Nations, CH‐1211 Geneva 10, fax: +41 22 917 0027, e‐mail:  unpubli@un.org; Americas, Eastern Asia: United Nations Publications, Two UN Plaza, DC2‐853, New York, N.Y. 10017, U.S.A., telephone: 1 212 963 8302 or 1 800 253 9646, fax: 1 212 963  3489, e‐mail: publications@un.org. Internet: http://www.un.org/publications. For more information, please contact:   Masataka Fujita, Officer‐in‐Charge, Investment Trends and Issues Branch, Division on Investment and Enterprise, UNCTAD, tel: +41 22 917 6217,  fax: +41 22 917 0194, or e‐mail: masataka.fujita@unctad.org; or Press Office, tel: +41 22 917 5828 / 1646, fax: +41 22 917 0051, or e‐mail: unctadpress@unctad.org