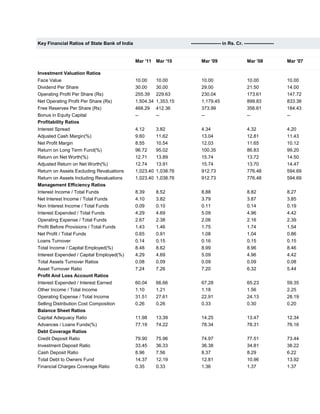
1. Key Financial Ratios of State Bank of India------------------- in Rs. Cr. -------------------<br />Mar '11Mar '10Mar '09Mar '08Mar '07Investment Valuation RatiosFace Value10.0010.0010.0010.0010.00Dividend Per Share30.0030.0029.0021.5014.00Operating Profit Per Share (Rs)255.39229.63230.04173.61147.72Net Operating Profit Per Share (Rs)1,504.341,353.151,179.45899.83833.38Free Reserves Per Share (Rs)468.29412.36373.99356.61184.43Bonus in Equity Capital----------Profitability RatiosInterest Spread4.123.824.344.324.20Adjusted Cash Margin(%)9.6011.6213.0412.8111.43Net Profit Margin8.5510.5412.0311.6510.12Return on Long Term Fund(%)96.7295.02100.3586.8399.20Return on Net Worth(%)12.7113.8915.7413.7214.50Adjusted Return on Net Worth(%)12.7413.9115.7413.7014.47Return on Assets Excluding Revaluations1,023.401,038.76912.73776.48594.69Return on Assets Including Revaluations1,023.401,038.76912.73776.48594.69Management Efficiency RatiosInterest Income / Total Funds8.398.528.888.828.27Net Interest Income / Total Funds4.103.823.793.873.85Non Interest Income / Total Funds0.090.100.110.140.19Interest Expended / Total Funds4.294.695.094.964.42Operating Expense / Total Funds2.672.382.062.162.39Profit Before Provisions / Total Funds1.431.461.751.741.54Net Profit / Total Funds0.650.911.081.040.86Loans Turnover0.140.150.160.150.15Total Income / Capital Employed(%)8.488.628.998.968.46Interest Expended / Capital Employed(%)4.294.695.094.964.42Total Assets Turnover Ratios0.080.090.090.090.08Asset Turnover Ratio7.247.267.206.325.44Profit And Loss Account RatiosInterest Expended / Interest Earned60.0466.6667.2865.2359.35Other Income / Total Income1.101.211.181.562.25Operating Expense / Total Income31.5127.6122.9124.1328.19Selling Distribution Cost Composition0.260.260.330.300.20Balance Sheet RatiosCapital Adequacy Ratio11.9813.3914.2513.4712.34Advances / Loans Funds(%)77.1974.2278.3478.3176.16Debt Coverage RatiosCredit Deposit Ratio79.9075.9674.9777.5173.44Investment Deposit Ratio33.4536.3336.3834.8138.22Cash Deposit Ratio8.967.568.378.296.22Total Debt to Owners Fund14.3712.1912.8110.9613.92Financial Charges Coverage Ratio0.350.331.361.371.37Financial Charges Coverage Ratio Post Tax1.191.211.231.231.22Leverage RatiosCurrent Ratio0.040.040.040.070.05Quick Ratio8.509.075.746.156.52Cash Flow Indicator RatiosDividend Payout Ratio Net Profit26.0323.3622.9022.6418.98Dividend Payout Ratio Cash Profit23.2421.2021.1320.5616.75Earning Retention Ratio74.0376.6777.1177.3380.97Cash Earning Retention Ratio76.8078.8278.8879.4183.21AdjustedCash Flow Times100.7179.5475.0572.6484.87Mar '11Mar '10Mar '09Mar '08Mar '07Earnings Per Share116.07144.37143.67106.5686.29Book Value1,023.401,038.76912.73776.48594.69<br />