SlideShare a Scribd company logo
1 of 4
Download to read offline
Research
methodology
การออกแบบการวิจัยเปนขันตอนทีสําคัญทีจะมําให้งานวิจัยนัน
ได้รับการยอมรับ และนําไปอ้างอิงได้หรือไม่ได้ ทุกขันตอนและ
กระบวนการจะต้องมีการคิด และการวางแผนทีดีตังแต่เริมต้น
งานวิจัย และผู้วิจัยก็ต้องมีการควบคุมให้เปนไปตามขันตอน
กระบวนการวางแผนทีทําไว้
Research
design
QUALITATIVE
QUANTITATIVE
susheewa@gmail.com
Phenomenology
Ethnography
Experiment
non-
experiment
survey
Historical
Grounded
Theory
development
+
(Inductive)
(deductive)
correlation
laboratory
Experiment
Qausi-
experiment
community
survey
National
survey
simple
correlation
descriptive
correlation
case
study causal
comparative
Predictive
cross
sectional
longitudinal
Cross
culture
Trend
Retrospective
Prospective
cohort
principleof
researchdesign
Validity
Control
extraneous
variables
Max Min Con Principle
ทําให้ตัวแปรต้นและตามต่างกัน
มากทีสุด
ลดความแปรปรวนอันเกิดจาก
ความคลาดเคลือนให้น้อยทีสุด
ควบคุมอิทธิพลตัวแปรเกิน
Statistical conclusion validity
Internal Validity
External Validity
Construct validity
คือตัวแปรทีผู้วิจัยไม่ได้นํามาศึกษาแต่มี
อิทธิพลต่อตัวแปรตาม เช่น สิงแวดล้อม เวลา
ลักษณะส่วนบุคคล เพศ วัย IQ EQ
ความเครียด เปนต้น
วิธิการควบคุม
-ควบคุมปจจัยภายนอก ด้านสิงแวดล้อม เวลา
-การสุ่มเฉลียความเท่าเทียม
-Homogenity เลือกกลุ่มตัวอย่างสองกลุ่มทีใกล้เคียงกัน
-นําตัวแปรแทรกซ้อนมาศึกษา
- การจับคู่
-การวิเคราะห์ตัวแปรปรวนร่วม Analysis of
Covariance)
-ควบคุมตัวแปรแทรกซ้อนจากผู้ทดลอง Halo effect และกลุ่ม
ตัวอย่าง โดยการอบรมผู้ร่วมวิจัย Single blind, Double
blind procedure
มีการจัดกระทําสิงทดลอง Manipulation
มีการควบคุม Control extraneous variable
Control treatment and control group
มีการสุ่ม Random selection ต้องไม่ลําเอียง
และมีความคลาดเคลือนน้อยทีสุด
กลุ่มตัวอย่างทีดี เท่าทียม ทําให้วิจัยมีความตรง
ภายใน กลุ่มตัวอย่างทีมาจาก random selection
ทําให้งานวิจัยมีความตรงภายนอก
ศึกษาจากผลไปหาเหตุ ถ้าศึกษา
แบบมีกลุ่มควบคุมเรียกว่าcase
control study
ศึกษาความสัมพันธ์ระหว่าง
ตัวแปรทีจะศึกษา
การวิจัยเชิงสํารวจ
การวิจัยกึงทดลอง จะมีลักษณะคล้ายๆกับ
การวิจัยเชิงทดลองเพียงแต่การจัดกระทํา
และการควบคุม setting ต่างๆไม่ ไม่เข้มข้น
เหมือนการวิจัยเชิงทดลอง
การวิจัยแบบไม่
ทดลอง
Research
considerations
ข้อทีควรตะหนักและระมัดระวังในการออกแบบงานวิจัย
Research
population
validity
ความตรง
reliabilitY
susheewa@gmail.com
internal validity
ใช้สูตร
External
validity
sample size
+
sampling
technique
Proability
sampling
Constructional
validity
ใช้ตาราง
กําหนดเกณฑ์
ทราบประชากรทีแน่นอน ใช้
สุตร ทาโร่ยามาเน่ เครซี and
มอร์แกน
ถ้าไม่ทราบใช้สูตรคอเครน
G-Power
ทราบประชากรทีแน่นอน ใช้
ตาราง ทาโร่ยามาเน่ เครซี
and มอร์แกน
Non-
Proability
sampling
Sample random sampling
Systemic random sampling จัดระบบประชากรก่อนทีจะ
เลือดเช่นคนทีลงท้ายด้วยเลข 5
Stratified random สุ่มแบบช่วงชันโดยแบ่งกลุ่มประชากรให้
ครอบคลุมทีจะศึกษา เช่นกลุ่มอายุ อาชีพ และส่มตัวอย่าง
ออกมาจากแต่ละกลุ่ม
Cluster randomสุ่มจากลุ่มประชากรทีแบ่งเปนส่วนๆ เช่น
จังหวัด อําเภอทีต่างกัน
Multi stage random sampling อาจผสมผสานระหว่าง
probability and non probability
Accidental sampling สุ่มโดย
บังเอิญ
Purposive sampling สุ่มตามจุด
มุ่งหมายตามสะดวก โดยมี
inclusion and exclusion criteria
Snowball sampling สุ่มจากการได้
รับการแนะนํา
Quote sampling คล้ายๆสุ่มแบบ
ช่วงชัน
Ethical
consideration
Volunteering
Harmless
Confidentiality
Recruitment ตาม inclusion criteria
Free to withdraw
Risk control
Place to complaint
Anonymity
Data control
Publication
ผลของงานวิจัยตอบได้ตรงวัตถุประสงค์
และเปนจริง ซึงขึนอยู่กับการออกแบบทีดี
ซึงหมายถึงผลหการวิจัยทีได้มาจากตัวแปร
อิสระทีศึกษาไม่ได้มาจากตัวแปรแทรกซ้อน
ภายนอก
ความสามารถในการนําผลการวิจัยไปใช้
สรุปเปนลักษณะประชากร อ้างอิงได้
Statistical
conclusion
validity
ความตรงจากการใช้สถิติทีถูกต้อง
เกิดได้จากการใช้สถิติทีมีอํานาจการทดสอบตํา ทําให้เกิด Type
II error
การใช้สถิติทีไม่ตรงตามเงือนไขการใช้สถิติตัวนัน
Type I error ทีเกิดจากการวิเคราะห์หลายรอบ
ปจจัยทีมีผลต่อ Internal validity
เหตุการณ์พ้อง (History), วุฒิภาวะ,
การทดสอบข้อสอบชุดเดิมมากกว่า 1ครัง,
คุณภาพของเครืองมือวิจัย, การถดถอยทาง
สถิติ(Floor effect), การสุ่มตัวอย่างเข้ากลุ่ม,
การสูญหายของกลุ่มตัวอย่าง, อิทธิพลร่วม
ระหว่างปจจัยอืนกับการเลือกกลุ่มตัวอย่าง,
ความคลุมเครือของแนวคิดทฤษฎี, การเผย
แพร่ของสิงทดลอง(Contamonation),การไม่
ใช้ความร่วมมือของกลุ่มตัวอย่างของกลุ่ม
ควบคุม, Fake response ของกลุ่ม
ทดลอง(Hawthorne effect)
ปจจัยทีมีผลต่อความครงภายนอก
- อิทธิพลระหว่างการเลือกตัวอย่าง/สิงทดลอง
เช่นความลําเอียง
- อิทธิพลระหว่างแหล่งทดลองและสิงทดลอง เช่น
เลือกสถานทีทีสะดวก
- อิทธพลร่วมระหว่างการทดสอบและสิงทดสอบ
เช่นให้กลุ่มตัวอย่างทําสิงทดสอบก่อน
- อิทธิพลร่วมระหว่างเหตุการณ์พ้องและสิง
ทดสอบ เช่นเหตุการณ์ไม่คาดฝนทีทําให้กลุ่ม
ตัวอย่างตืนตัว
- ปฏิกิริยาของกลุ่มตัวอย่างต่อสิงทดลอง fake
response (Hawthorne effect)
การได้รับสิงทดลองหลายๆครัง
พิจารณาจากนิยามเชิงปฏิบัติการที
ครอบคลุมกรอบแนวคิด โครงสร้างของ
ตัวแปรทีระบุในแนวคิดหรือทฤษฎี
ปจจัยทีมีผลต่อความตรงทางโครงสร้าง
- การแปลและสรุปเนือหาของแนวคิดทฤษฎี
- คํานิยามเชิงปฏิบัติการ ต้องเขียนใน
ลักษณะทีนํามาจัดกระทําได้อย่างเปนรูป
ธรรม
- ใช้เครืองมือวัดแค่เครืองมือเดียว
- การเก็บรวบรวมทีไม่เหมาะสม เช่นการเก็บ
ข้อมูลในคนทีอ่านหนังสือไม่ออก
Research
statistic
สถิติทีใช้ในงานวิจัย
Statistic
qualitative
QUANTITATIVE
Cross
tabulation
susheewa@gmail.com
Transcription
Video
Audio
Descriptive
Correlation
Chi-square
Computing
NVIVO
T-test
+
statistic
statistic
F-test
A cross-
tabulation gives
you a basic
picture of how
two variables
inter-relate.
ANOVA
The most basic description of your data
comes from a simple frequency table or
plot.
Analysis of variance (ANOVA)
ANOVA is available for both parametric (score
data) and non-parametric (ranking/ordering) data.
One-way between groups
One-way repeated measures
Two-way between groups
Two-way repeated measures
This type of ANOVA can also be used to compare variables
between different groups - tutorial performance from different
intakes.
A one way repeated measures ANOVA is used when you have a
single group on which you have measured something a few times.
For example, the grades by tutorial analysis could be
extended to see if overseas students performed differently
to local students. What you would have from this form of
ANOVA is:
The effect of final grade
The effect of overseas versus local
The interaction between final grade and overseas/local
Rating Frequency
1 20
2 37
3 28
4 12
5 8
6 2
7 1
Skew
Kurtosis
เงือนไขการใช้ T-test
ข้อมูลมีค่าต่อเนือง Interval scaleขึนไป
Normal distribution
Random Sampling
กลุ่มตัวอย่างมีขนาดใหญ่เพียงพอ
ไม่ทราบความแปรปรวนของประชากร
Non-parameter ใช้ Wilcoxon-Mann
Whitney
เงือนไขของการวิเคราะห์จําแนกกลุ่ม
- ตัวแปรตามซึงเปนตัวแปรกลุ่มต้องมีอย่างน้อย2กลุ่ม
- ตัวแปรอิสระต้องมีค่าต่อเนือง ถ้าเปนNormnal scale ต้องทําเปน Dummy
- ตัวแปรอิสระทุกตัวต้องเปน Normal distribution
- ตัวแปรอิสระต้องไม่มีความสัมพันธ์กัน (Multicolinearity)
- ความแปรปรวนของตัวแปรอิสระแต่ละตัวต้องเท่ากัน
- กลุ่มตัวอย่างมีขนาดใหญ่พอ
Dependent T-test or pair T-test,
Wilcoxin signed rank,
McNemar test
Independent T-test, Wilcoxon-
Mann Whitney
วิเคราะห์ความสัมพันธ์อย่างง่าย
Simple correlation (Pearson)
Non-Parametric ใช้ Spearman or
Chi-square
วิเคราะ์อํานาจพยากรณ์โดยใช้สถิติ
Multiple regression
Documentation
Conceptualization, Coding and
Categorizing
Examining reltionship and
displaying data
Authenticating Conclusion
Reflexivity
เปรียบเทียบความแปรปรวนของ
ประชากร 2 กลุ่มขึนไป (One way
ANOVA) เงือนไข
-Randomly
-Normal
distribution
ข้อตกลงการใช้ ANOVA
Randomly
Normal distribution
ข้อมูล(Interval Scale)ขึนไป
กลุ่มตัวอย่างแต่ละกลุ่มเปนอิสระต่อกัน
มีความเปนอิสระภายในตัวอย่าง
ไม่ทราบความแปรปรวนของประชากร แต่
ความแปรปรวนของประชากรแต่ละกลุ่มมี
ค่าเท่ากัน
เปรียบเทียบประชากรมากกว่า2กลุ่ม ใช้
Factorial ANOVA
Non Parametric ใช้ KRUSKAL
WALIS TEST
Z-test
Randomly
Normal distribution
Interval Scale)ขึนไป
ทราบความแปรปรวนของ
ประชากร
Multiple Linear
Regression
แบ่งเปนการวัดการถดถอยอย่างง่ายและ
พหุคูณโดยการนําตัวแปรเข้ามการเพือ
สร้างแบบจําลอง (สมการพยากรณ์)
All enter
Forward
Backward
Stepwise
Non- Parametric
มีเงือนไขการใช้คือ
-Test of goodness fit
-Test of independence
-Test of homogeneity
ใช้กับข้อมูล Nominal and ordinal
scale 2 กลุ่มขึนไป
กรณีค่าสังเกตในcell บาง cell ตํากว่า 5
อาจใช้ FISHER's EXACT TEST
Research
scaleofmeSUREMENT
มาตรวัดและเครืองมือทีใช้ในการวิจัย
Scaleof
measurement
norminal
inteerval
ordinal
scale
susheewa@gmail.com
+
scale
scale
RATIO
จัดกลุ่มได้ จัดลําดับก่อนหลังได้ มีระยะห่างของช่องตัวชีวัดเท่ากัน
have a “true zero Sample TIME OF DAY on a 12-hour clock
Interval scale data would use parametric statistical techniques:
Mean and standard deviation
Correlation - r ( Pearson correlation coefficient)
Regression
Analysis of variance (ANOVA) for parametric ANOVA
Factor analysis
Remember that you can use non-parametric techniques with
interval and ratio data. But non-paramteric techniques are less
powerful than the parametric ones.
They also have an absolute zero
Sample RULER: inches or
centimeters YEARS of work
experience INCOME:
money earned last year
NUMBER of children . GPA: grade
point average
Statistic used the same as
INTERVAL DATA
จัดกลุ่มได้ ไม่สามารถบอกระยะห่างของ
กลุ่มได้
provide good information about the
order of choices, such as in a
customer satisfaction survey.
Typically these ratings are made
on a 5-point or a 7-point scale.
Ordinal data would use non-
parametric statistics. These would
include:
Median and mode
rank order correlation
non-parametric analysis of
variance (ANOVA)
Modelling techniques can also be
used with ordinal data.
The statistics which can be
used with nominal scales
are in the non-parametric
group. The most likely
ones would be:
mode
crosstabulation - with chi-
square

More Related Content

More from Susheewa Mulmuang

การพยาบาลผู้ป่วยเด็กที่ใช้เครื่องช่วยหายใจ
การพยาบาลผู้ป่วยเด็กที่ใช้เครื่องช่วยหายใจการพยาบาลผู้ป่วยเด็กที่ใช้เครื่องช่วยหายใจ
การพยาบาลผู้ป่วยเด็กที่ใช้เครื่องช่วยหายใจSusheewa Mulmuang
 
การพยาบาลผู้ป่วยใช้เครื่องช่วยหายใจ
การพยาบาลผู้ป่วยใช้เครื่องช่วยหายใจการพยาบาลผู้ป่วยใช้เครื่องช่วยหายใจ
การพยาบาลผู้ป่วยใช้เครื่องช่วยหายใจSusheewa Mulmuang
 
สโมสรนิสิต
สโมสรนิสิตสโมสรนิสิต
สโมสรนิสิตSusheewa Mulmuang
 
International Nosocomial Infection Control Consortium 2010
International Nosocomial Infection Control Consortium 2010International Nosocomial Infection Control Consortium 2010
International Nosocomial Infection Control Consortium 2010Susheewa Mulmuang
 
Ic in countries with limited resource
Ic in countries with limited resourceIc in countries with limited resource
Ic in countries with limited resourceSusheewa Mulmuang
 
Hai in england 2008 2009 report
Hai in england 2008 2009 reportHai in england 2008 2009 report
Hai in england 2008 2009 reportSusheewa Mulmuang
 
การพยาบาลก่อนและหลังผ่าตัดในเด็ก
การพยาบาลก่อนและหลังผ่าตัดในเด็กการพยาบาลก่อนและหลังผ่าตัดในเด็ก
การพยาบาลก่อนและหลังผ่าตัดในเด็กSusheewa Mulmuang
 

More from Susheewa Mulmuang (16)

การพยาบาลผู้ป่วยเด็กที่ใช้เครื่องช่วยหายใจ
การพยาบาลผู้ป่วยเด็กที่ใช้เครื่องช่วยหายใจการพยาบาลผู้ป่วยเด็กที่ใช้เครื่องช่วยหายใจ
การพยาบาลผู้ป่วยเด็กที่ใช้เครื่องช่วยหายใจ
 
การพยาบาลผู้ป่วยใช้เครื่องช่วยหายใจ
การพยาบาลผู้ป่วยใช้เครื่องช่วยหายใจการพยาบาลผู้ป่วยใช้เครื่องช่วยหายใจ
การพยาบาลผู้ป่วยใช้เครื่องช่วยหายใจ
 
Nursing informatics
Nursing informaticsNursing informatics
Nursing informatics
 
สโมสรนิสิต
สโมสรนิสิตสโมสรนิสิต
สโมสรนิสิต
 
Content analysis20 07-12
Content analysis20 07-12Content analysis20 07-12
Content analysis20 07-12
 
Qualitative data collection
Qualitative data collectionQualitative data collection
Qualitative data collection
 
Critical thinking 22 08-55
Critical thinking 22 08-55Critical thinking 22 08-55
Critical thinking 22 08-55
 
International Nosocomial Infection Control Consortium 2010
International Nosocomial Infection Control Consortium 2010International Nosocomial Infection Control Consortium 2010
International Nosocomial Infection Control Consortium 2010
 
Ic in countries with limited resource
Ic in countries with limited resourceIc in countries with limited resource
Ic in countries with limited resource
 
Hai in england 2008 2009 report
Hai in england 2008 2009 reportHai in england 2008 2009 report
Hai in england 2008 2009 report
 
Infection control in clinic
Infection control in clinicInfection control in clinic
Infection control in clinic
 
Children Care
Children CareChildren Care
Children Care
 
Child Seizure
Child SeizureChild Seizure
Child Seizure
 
การพยาบาลก่อนและหลังผ่าตัดในเด็ก
การพยาบาลก่อนและหลังผ่าตัดในเด็กการพยาบาลก่อนและหลังผ่าตัดในเด็ก
การพยาบาลก่อนและหลังผ่าตัดในเด็ก
 
Lower Gi
Lower GiLower Gi
Lower Gi
 
Gastoschisis
GastoschisisGastoschisis
Gastoschisis
 

วิจัย maindmap.pdf

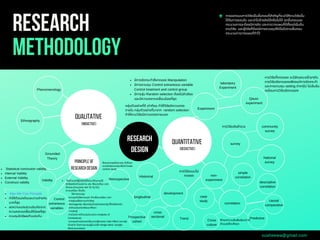
  • 1. Research methodology การออกแบบการวิจัยเปนขันตอนทีสําคัญทีจะมําให้งานวิจัยนัน ได้รับการยอมรับ และนําไปอ้างอิงได้หรือไม่ได้ ทุกขันตอนและ กระบวนการจะต้องมีการคิด และการวางแผนทีดีตังแต่เริมต้น งานวิจัย และผู้วิจัยก็ต้องมีการควบคุมให้เปนไปตามขันตอน กระบวนการวางแผนทีทําไว้ Research design QUALITATIVE QUANTITATIVE susheewa@gmail.com Phenomenology Ethnography Experiment non- experiment survey Historical Grounded Theory development + (Inductive) (deductive) correlation laboratory Experiment Qausi- experiment community survey National survey simple correlation descriptive correlation case study causal comparative Predictive cross sectional longitudinal Cross culture Trend Retrospective Prospective cohort principleof researchdesign Validity Control extraneous variables Max Min Con Principle ทําให้ตัวแปรต้นและตามต่างกัน มากทีสุด ลดความแปรปรวนอันเกิดจาก ความคลาดเคลือนให้น้อยทีสุด ควบคุมอิทธิพลตัวแปรเกิน Statistical conclusion validity Internal Validity External Validity Construct validity คือตัวแปรทีผู้วิจัยไม่ได้นํามาศึกษาแต่มี อิทธิพลต่อตัวแปรตาม เช่น สิงแวดล้อม เวลา ลักษณะส่วนบุคคล เพศ วัย IQ EQ ความเครียด เปนต้น วิธิการควบคุม -ควบคุมปจจัยภายนอก ด้านสิงแวดล้อม เวลา -การสุ่มเฉลียความเท่าเทียม -Homogenity เลือกกลุ่มตัวอย่างสองกลุ่มทีใกล้เคียงกัน -นําตัวแปรแทรกซ้อนมาศึกษา - การจับคู่ -การวิเคราะห์ตัวแปรปรวนร่วม Analysis of Covariance) -ควบคุมตัวแปรแทรกซ้อนจากผู้ทดลอง Halo effect และกลุ่ม ตัวอย่าง โดยการอบรมผู้ร่วมวิจัย Single blind, Double blind procedure มีการจัดกระทําสิงทดลอง Manipulation มีการควบคุม Control extraneous variable Control treatment and control group มีการสุ่ม Random selection ต้องไม่ลําเอียง และมีความคลาดเคลือนน้อยทีสุด กลุ่มตัวอย่างทีดี เท่าทียม ทําให้วิจัยมีความตรง ภายใน กลุ่มตัวอย่างทีมาจาก random selection ทําให้งานวิจัยมีความตรงภายนอก ศึกษาจากผลไปหาเหตุ ถ้าศึกษา แบบมีกลุ่มควบคุมเรียกว่าcase control study ศึกษาความสัมพันธ์ระหว่าง ตัวแปรทีจะศึกษา การวิจัยเชิงสํารวจ การวิจัยกึงทดลอง จะมีลักษณะคล้ายๆกับ การวิจัยเชิงทดลองเพียงแต่การจัดกระทํา และการควบคุม setting ต่างๆไม่ ไม่เข้มข้น เหมือนการวิจัยเชิงทดลอง การวิจัยแบบไม่ ทดลอง
  • 2. Research considerations ข้อทีควรตะหนักและระมัดระวังในการออกแบบงานวิจัย Research population validity ความตรง reliabilitY susheewa@gmail.com internal validity ใช้สูตร External validity sample size + sampling technique Proability sampling Constructional validity ใช้ตาราง กําหนดเกณฑ์ ทราบประชากรทีแน่นอน ใช้ สุตร ทาโร่ยามาเน่ เครซี and มอร์แกน ถ้าไม่ทราบใช้สูตรคอเครน G-Power ทราบประชากรทีแน่นอน ใช้ ตาราง ทาโร่ยามาเน่ เครซี and มอร์แกน Non- Proability sampling Sample random sampling Systemic random sampling จัดระบบประชากรก่อนทีจะ เลือดเช่นคนทีลงท้ายด้วยเลข 5 Stratified random สุ่มแบบช่วงชันโดยแบ่งกลุ่มประชากรให้ ครอบคลุมทีจะศึกษา เช่นกลุ่มอายุ อาชีพ และส่มตัวอย่าง ออกมาจากแต่ละกลุ่ม Cluster randomสุ่มจากลุ่มประชากรทีแบ่งเปนส่วนๆ เช่น จังหวัด อําเภอทีต่างกัน Multi stage random sampling อาจผสมผสานระหว่าง probability and non probability Accidental sampling สุ่มโดย บังเอิญ Purposive sampling สุ่มตามจุด มุ่งหมายตามสะดวก โดยมี inclusion and exclusion criteria Snowball sampling สุ่มจากการได้ รับการแนะนํา Quote sampling คล้ายๆสุ่มแบบ ช่วงชัน Ethical consideration Volunteering Harmless Confidentiality Recruitment ตาม inclusion criteria Free to withdraw Risk control Place to complaint Anonymity Data control Publication ผลของงานวิจัยตอบได้ตรงวัตถุประสงค์ และเปนจริง ซึงขึนอยู่กับการออกแบบทีดี ซึงหมายถึงผลหการวิจัยทีได้มาจากตัวแปร อิสระทีศึกษาไม่ได้มาจากตัวแปรแทรกซ้อน ภายนอก ความสามารถในการนําผลการวิจัยไปใช้ สรุปเปนลักษณะประชากร อ้างอิงได้ Statistical conclusion validity ความตรงจากการใช้สถิติทีถูกต้อง เกิดได้จากการใช้สถิติทีมีอํานาจการทดสอบตํา ทําให้เกิด Type II error การใช้สถิติทีไม่ตรงตามเงือนไขการใช้สถิติตัวนัน Type I error ทีเกิดจากการวิเคราะห์หลายรอบ ปจจัยทีมีผลต่อ Internal validity เหตุการณ์พ้อง (History), วุฒิภาวะ, การทดสอบข้อสอบชุดเดิมมากกว่า 1ครัง, คุณภาพของเครืองมือวิจัย, การถดถอยทาง สถิติ(Floor effect), การสุ่มตัวอย่างเข้ากลุ่ม, การสูญหายของกลุ่มตัวอย่าง, อิทธิพลร่วม ระหว่างปจจัยอืนกับการเลือกกลุ่มตัวอย่าง, ความคลุมเครือของแนวคิดทฤษฎี, การเผย แพร่ของสิงทดลอง(Contamonation),การไม่ ใช้ความร่วมมือของกลุ่มตัวอย่างของกลุ่ม ควบคุม, Fake response ของกลุ่ม ทดลอง(Hawthorne effect) ปจจัยทีมีผลต่อความครงภายนอก - อิทธิพลระหว่างการเลือกตัวอย่าง/สิงทดลอง เช่นความลําเอียง - อิทธิพลระหว่างแหล่งทดลองและสิงทดลอง เช่น เลือกสถานทีทีสะดวก - อิทธพลร่วมระหว่างการทดสอบและสิงทดสอบ เช่นให้กลุ่มตัวอย่างทําสิงทดสอบก่อน - อิทธิพลร่วมระหว่างเหตุการณ์พ้องและสิง ทดสอบ เช่นเหตุการณ์ไม่คาดฝนทีทําให้กลุ่ม ตัวอย่างตืนตัว - ปฏิกิริยาของกลุ่มตัวอย่างต่อสิงทดลอง fake response (Hawthorne effect) การได้รับสิงทดลองหลายๆครัง พิจารณาจากนิยามเชิงปฏิบัติการที ครอบคลุมกรอบแนวคิด โครงสร้างของ ตัวแปรทีระบุในแนวคิดหรือทฤษฎี ปจจัยทีมีผลต่อความตรงทางโครงสร้าง - การแปลและสรุปเนือหาของแนวคิดทฤษฎี - คํานิยามเชิงปฏิบัติการ ต้องเขียนใน ลักษณะทีนํามาจัดกระทําได้อย่างเปนรูป ธรรม - ใช้เครืองมือวัดแค่เครืองมือเดียว - การเก็บรวบรวมทีไม่เหมาะสม เช่นการเก็บ ข้อมูลในคนทีอ่านหนังสือไม่ออก
  • 3. Research statistic สถิติทีใช้ในงานวิจัย Statistic qualitative QUANTITATIVE Cross tabulation susheewa@gmail.com Transcription Video Audio Descriptive Correlation Chi-square Computing NVIVO T-test + statistic statistic F-test A cross- tabulation gives you a basic picture of how two variables inter-relate. ANOVA The most basic description of your data comes from a simple frequency table or plot. Analysis of variance (ANOVA) ANOVA is available for both parametric (score data) and non-parametric (ranking/ordering) data. One-way between groups One-way repeated measures Two-way between groups Two-way repeated measures This type of ANOVA can also be used to compare variables between different groups - tutorial performance from different intakes. A one way repeated measures ANOVA is used when you have a single group on which you have measured something a few times. For example, the grades by tutorial analysis could be extended to see if overseas students performed differently to local students. What you would have from this form of ANOVA is: The effect of final grade The effect of overseas versus local The interaction between final grade and overseas/local Rating Frequency 1 20 2 37 3 28 4 12 5 8 6 2 7 1 Skew Kurtosis เงือนไขการใช้ T-test ข้อมูลมีค่าต่อเนือง Interval scaleขึนไป Normal distribution Random Sampling กลุ่มตัวอย่างมีขนาดใหญ่เพียงพอ ไม่ทราบความแปรปรวนของประชากร Non-parameter ใช้ Wilcoxon-Mann Whitney เงือนไขของการวิเคราะห์จําแนกกลุ่ม - ตัวแปรตามซึงเปนตัวแปรกลุ่มต้องมีอย่างน้อย2กลุ่ม - ตัวแปรอิสระต้องมีค่าต่อเนือง ถ้าเปนNormnal scale ต้องทําเปน Dummy - ตัวแปรอิสระทุกตัวต้องเปน Normal distribution - ตัวแปรอิสระต้องไม่มีความสัมพันธ์กัน (Multicolinearity) - ความแปรปรวนของตัวแปรอิสระแต่ละตัวต้องเท่ากัน - กลุ่มตัวอย่างมีขนาดใหญ่พอ Dependent T-test or pair T-test, Wilcoxin signed rank, McNemar test Independent T-test, Wilcoxon- Mann Whitney วิเคราะห์ความสัมพันธ์อย่างง่าย Simple correlation (Pearson) Non-Parametric ใช้ Spearman or Chi-square วิเคราะ์อํานาจพยากรณ์โดยใช้สถิติ Multiple regression Documentation Conceptualization, Coding and Categorizing Examining reltionship and displaying data Authenticating Conclusion Reflexivity เปรียบเทียบความแปรปรวนของ ประชากร 2 กลุ่มขึนไป (One way ANOVA) เงือนไข -Randomly -Normal distribution ข้อตกลงการใช้ ANOVA Randomly Normal distribution ข้อมูล(Interval Scale)ขึนไป กลุ่มตัวอย่างแต่ละกลุ่มเปนอิสระต่อกัน มีความเปนอิสระภายในตัวอย่าง ไม่ทราบความแปรปรวนของประชากร แต่ ความแปรปรวนของประชากรแต่ละกลุ่มมี ค่าเท่ากัน เปรียบเทียบประชากรมากกว่า2กลุ่ม ใช้ Factorial ANOVA Non Parametric ใช้ KRUSKAL WALIS TEST Z-test Randomly Normal distribution Interval Scale)ขึนไป ทราบความแปรปรวนของ ประชากร Multiple Linear Regression แบ่งเปนการวัดการถดถอยอย่างง่ายและ พหุคูณโดยการนําตัวแปรเข้ามการเพือ สร้างแบบจําลอง (สมการพยากรณ์) All enter Forward Backward Stepwise Non- Parametric มีเงือนไขการใช้คือ -Test of goodness fit -Test of independence -Test of homogeneity ใช้กับข้อมูล Nominal and ordinal scale 2 กลุ่มขึนไป กรณีค่าสังเกตในcell บาง cell ตํากว่า 5 อาจใช้ FISHER's EXACT TEST
  • 4. Research scaleofmeSUREMENT มาตรวัดและเครืองมือทีใช้ในการวิจัย Scaleof measurement norminal inteerval ordinal scale susheewa@gmail.com + scale scale RATIO จัดกลุ่มได้ จัดลําดับก่อนหลังได้ มีระยะห่างของช่องตัวชีวัดเท่ากัน have a “true zero Sample TIME OF DAY on a 12-hour clock Interval scale data would use parametric statistical techniques: Mean and standard deviation Correlation - r ( Pearson correlation coefficient) Regression Analysis of variance (ANOVA) for parametric ANOVA Factor analysis Remember that you can use non-parametric techniques with interval and ratio data. But non-paramteric techniques are less powerful than the parametric ones. They also have an absolute zero Sample RULER: inches or centimeters YEARS of work experience INCOME: money earned last year NUMBER of children . GPA: grade point average Statistic used the same as INTERVAL DATA จัดกลุ่มได้ ไม่สามารถบอกระยะห่างของ กลุ่มได้ provide good information about the order of choices, such as in a customer satisfaction survey. Typically these ratings are made on a 5-point or a 7-point scale. Ordinal data would use non- parametric statistics. These would include: Median and mode rank order correlation non-parametric analysis of variance (ANOVA) Modelling techniques can also be used with ordinal data. The statistics which can be used with nominal scales are in the non-parametric group. The most likely ones would be: mode crosstabulation - with chi- square