
Recommended
Recommended
More Related Content
Similar to Strategy MapsOnce change leaders have framed their vision and st.docx
Similar to Strategy MapsOnce change leaders have framed their vision and st.docx (20)
More from susanschei
More from susanschei (20)
Recently uploaded
Recently uploaded (20)
Strategy MapsOnce change leaders have framed their vision and st.docx
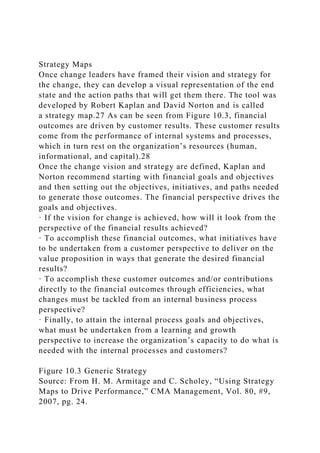
- 1. Strategy Maps Once change leaders have framed their vision and strategy for the change, they can develop a visual representation of the end state and the action paths that will get them there. The tool was developed by Robert Kaplan and David Norton and is called a strategy map.27 As can be seen from Figure 10.3, financial outcomes are driven by customer results. These customer results come from the performance of internal systems and processes, which in turn rest on the organization’s resources (human, informational, and capital).28 Once the change vision and strategy are defined, Kaplan and Norton recommend starting with financial goals and objectives and then setting out the objectives, initiatives, and paths needed to generate those outcomes. The financial perspective drives the goals and objectives. · If the vision for change is achieved, how will it look from the perspective of the financial results achieved? · To accomplish these financial outcomes, what initiatives have to be undertaken from a customer perspective to deliver on the value proposition in ways that generate the desired financial results? · To accomplish these customer outcomes and/or contributions directly to the financial outcomes through efficiencies, what changes must be tackled from an internal business process perspective? · Finally, to attain the internal process goals and objectives, what must be undertaken from a learning and growth perspective to increase the organization’s capacity to do what is needed with the internal processes and customers? Figure 10.3 Generic Strategy Source: From H. M. Armitage and C. Scholey, “Using Strategy Maps to Drive Performance,” CMA Management, Vol. 80, #9, 2007, pg. 24.
- 2. The learning and growth perspective embodies people, information, and organizational capital (e.g., culture, intellectual property, leadership, internal alignment, and teamwork). For not-for-profit organizations, many recommend placing the customer perspective at the top of the model (some have relabeled it as the stakeholder perspective), since this is the reason for the organization’s existence. Some place the financial perspective parallel with the customer or stakeholder perspective, while others place it below learning and growth or elsewhere. Others have added levels or changed labels on the strategy map. However, the goal remains the same: develop a coherent picture that aligns your change strategy with the organization’s purpose so it generates the desired outcomes. It is all about translating the change vision into action, communicating with key constituents, integrating and aligning the specific action plans, implementing, and learning and refining as you go. The assumption underlying strategy maps in for-profit organizations is that financial outcomes are the end goals that they are striving for and that other objectives within the change program should be aligned to produce and support those desired outcomes. If particular activities and the objectives don’t support the changes, they should be seriously questioned and either dropped or reduced in importance. Each of the change initiatives identified by the strategy map will need to be managed as to goals and objectives, success measures, timelines, resource requirements, and an action plan. These, in turn, need to be integrated with the other change initiatives that are embodied in the strategy map. When properly deployed, strategy maps provide change leaders with a powerful organizing and communication tool.29 This visualization helps people understand what is being proposed and why. It clarifies why certain actions are important and how they contribute to other outcomes that are critical to achieving the end goals of the change (i.e., cause–effect relationships). It helps people focus and align their efforts and appropriately
- 3. measure and report progress. It can assist change leaders to identify gaps in their logic, including missing objectives and measures. When Mobil used strategy maps, it helped them to identify gaps in the plans that had been developed for one of their business units. Objectives and metrics were missing for dealers—a critical component for a strategy map focused on selling more gasoline.30 To give you a concrete example of how a strategy map can be used to help, one is set out in Figure 10.4. It shows the vision and mission for Control Production Systems, Inc. (discussed earlier in this chapter). Then it shows the specific measures used in each category. Figure 10.4 Strategy Map for Control Production Systems Source: Adapted from: Simon, T. “ How Risky is Your Company?”, Harvard Business Review, Vol. 77, #3, 1999, 85– 94. The Balanced Scorecard If the strategy map links capabilities, change strategies, and outcomes, the balanced scorecard integrates measures into a relatively simple way of tracking the critical success factors. Kaplan and Norton argue that four categories of goals and measures need to be highlighted in a balanced scorecard: financial, a company’s relationship with its customers, its internal business process, and its learning and growth. In doing so, management can achieve a balanced, integrated, and aligned perspective concerning what needs to be done to produce the desired strategic outcomes.31 Among these indicators, some will lead while others will lag. For example, improvements in service levels such as the response time to a customer’s inquiry could be lead indicators of improvements in customer satisfaction. However, this may not immediately translate into new sales and increased profitability. Improvements in such measures will often be lag indicators of improvements in service levels because of the nature of the purchase cycle involved. The balanced scorecard
- 4. recognizes that not all effects are immediate. By setting out assumptions concerning what leads to what, it makes it easier for the change leader to test assumptions, track progress, and make appropriate alternations as necessary. When developing a strategy map and balanced scorecard for an internal change initiative, remember that the relevant customers may be employees in other departments of the organization. Kaplan and Norton argue that the use of multiple measures ensure a more balanced perspective on what a successful change will require. The likelihood that multiple measures will inadvertently mislead change leaders about what a successful change will require is much less than if they rely on a single indicator. Figure 10.5 outlines a generic balanced scorecard for a change project. Figure 10.6 outlines the scorecard for Control Production Systems. Toolkit Exercise 10.4 asks you to construct a strategy map and balanced scorecard for an organization that you know. Remember that customers can be internal or external to the firm. Risk Exposure Calculator Robert Simon has developed a risk exposure calculator for use in assessing the level of risk associated with a company’s actions.32 Simon argues that risk is related to the rate of growth of the company, its culture, and how information is managed. The tool focuses primarily on internal rather than external environmental risks. Although it was designed for use on the overall organization, it has been modified to assess the risk exposure related to a particular change initiative as well as maintaining the status quo. The first three risk drivers are grouped under change pressure. When the change leader is (a) under significant pressure to produce, (b) there is a great deal of ambiguity, or (c) employees are inexperienced in change, then the risks associated with the change initiative will be higher than if those three conditions were less present.
- 5. Figure 10.3 Generic Strategy Figure 10.4 Strategy Map for Control Production Systems