More Related Content
Similar to Descriptive (20)
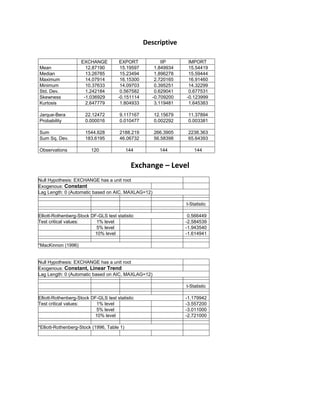
Descriptive
- 1. Descriptive
EXCHANGE EXPORT IIP IMPORT
Mean 12.87190 15.19597 1.849934 15.54419
Median 13.26785 15.23494 1.896278 15.59444
Maximum 14.07914 16.15300 2.720165 16.91460
Minimum 10.37633 14.09703 0.395251 14.32299
Std. Dev. 1.242184 0.567582 0.629041 0.677531
Skewness -1.036929 -0.151114 -0.709200 -0.123999
Kurtosis 2.647779 1.804933 3.119481 1.645383
Jarque-Bera 22.12472 9.117167 12.15679 11.37894
Probability 0.000016 0.010477 0.002292 0.003381
Sum 1544.628 2188.219 266.3905 2238.363
Sum Sq. Dev. 183.6195 46.06732 56.58398 65.64393
Observations 120 144 144 144
Exchange – Level
Null Hypothesis: EXCHANGE has a unit root
Exogenous: Constant
Lag Length: 0 (Automatic based on AIC, MAXLAG=12)
t-Statistic
Elliott-Rothenberg-Stock DF-GLS test statistic 0.566449
Test critical values: 1% level -2.584539
5% level -1.943540
10% level -1.614941
*MacKinnon (1996)
Null Hypothesis: EXCHANGE has a unit root
Exogenous: Constant, Linear Trend
Lag Length: 0 (Automatic based on AIC, MAXLAG=12)
t-Statistic
Elliott-Rothenberg-Stock DF-GLS test statistic -1.179942
Test critical values: 1% level -3.557200
5% level -3.011000
10% level -2.721000
*Elliott-Rothenberg-Stock (1996, Table 1)
- 2. Exchange – First Difference
Null Hypothesis: D(EXCHANGE) has a unit root
Exogenous: Constant
Lag Length: 0 (Automatic based on AIC, MAXLAG=12)
t-Statistic
Elliott-Rothenberg-Stock DF-GLS test statistic -10.02823
Test critical values: 1% level -2.584707
5% level -1.943563
10% level -1.614927
*MacKinnon (1996)
Null Hypothesis: D(EXCHANGE) has a unit root
Exogenous: Constant, Linear Trend
Lag Length: 0 (Automatic based on AIC, MAXLAG=12)
t-Statistic
Elliott-Rothenberg-Stock DF-GLS test statistic -10.30065
Test critical values: 1% level -3.558400
5% level -3.012000
10% level -2.722000
*Elliott-Rothenberg-Stock (1996, Table 1)
Phillip Perron test - Level
Null Hypothesis: EXCHANGE has a unit root
Exogenous: Constant
Bandwidth: 1 (Newey-West using Bartlett kernel)
Adj. t-Stat Prob.*
Phillips-Perron test statistic -1.776306 0.3906
Test critical values: 1% level -3.486064
5% level -2.885863
10% level -2.579818
*MacKinnon (1996) one-sided p-values.
Residual variance (no correction) 0.022469
HAC corrected variance (Bartlett kernel) 0.023009
- 3. Null Hypothesis: EXCHANGE has a unit root
Exogenous: Constant, Linear Trend
Bandwidth: 1 (Newey-West using Bartlett kernel)
Adj. t-Stat Prob.*
Phillips-Perron test statistic -1.361211 0.8672
Test critical values: 1% level -4.036983
5% level -3.448021
10% level -3.149135
*MacKinnon (1996) one-sided p-values.
Residual variance (no correction) 0.022393
HAC corrected variance (Bartlett kernel) 0.023175
Phillip Perron test – First Difference