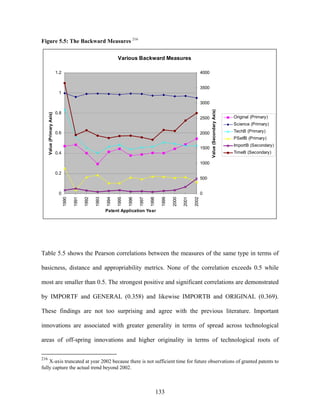
This dissertation examines the impact of intellectual property rights on scientific knowledge diffusion, accumulation, and utilization in the life sciences. It focuses on the Human Genome Project and associated gene patents. It finds that while patenting does not inherently stifle knowledge dissemination, gene patenting can impede temporal knowledge diffusion and decrease citations once patents are granted, as predicted by the "anti-commons effect." However, publications with matched patent-gene pairs receive more citations on average. The dissertation also finds a growing convergence of public/academic and private innovations in life sciences, and evidence that variations in institutional settings associate with different innovation characteristics.


![2003).36,37,38 These arguments about the benefits versus the adverse impacts of patenting are
ever more crucial in the United States, Europe and other developed countries as increasingly
more genes are discovered and patented, and genetic testing becomes part of standard medical
care. For example, in 2001 alone, it is estimated that about 1,500 patents were issued
claiming human genetic material.39,40 This controversy is especially manifest after the
completion of the Human Genome Project (HGP).41 These debates are central to my
dissertation research and are important for the formulation of alternative hypotheses and
explanations.
The next three sections describe in more details the debates in the economics, public policy,
sociology of science and ethics literature, in terms of the alternative theoretical arguments and
the evidence available, over the pros and cons of intellectual property rights (i.e. patenting) on
knowledge accumulation, dissemination and utilization.
36
Heller, M. A. and R. S. Eisenberg (1998). “Can Patents Deter Innovation? The Anti-commons in Biomedical
Research.” Science, 280 (5364): 698-701.
37
Henry, R. Michelle, Mildred K. Cho, Meredith A. Weaver, and Jon F. Merz (2002). “DNA Patenting and
Licensing.” Science, Vol. 297, pp. 1279.
38
Cho, Mildred K., Samantha Illangasekare, Meredith A. Weaver, Debra G. B. Leonard and Jon F. Merz (2003).
"Effects of Patents and Licenses on the Provision of Clinical Genetic Testing Services." Journal of Molecular
Diagnostics, Vol. 5, No.1: 3-8.
39
Genetic Inventions, Intellectual Property Rights and Licensing Practices, Evidence and Policies, Organization
for Economic Co-operation and Development (2002) [online] (cited 12.23.02)
http://www.oecd.org/dataoecd/42/21/2491084.pdf
40
Furthermore, according to the same OECD report, if one looks specifically at gene patents, grants have also
climbed rapidly since the second half of the 1990s in the United States. One estimates that the total number of
DNA patents granted by the USPTO to date is somewhere around 10 000. In 2001 alone over 5 000 DNA
patents were granted by the USPTO. Source: Leroy Walters, DNA Patent Database, Georgetown University and
Foundation for Genetic Medicine, as cited on the World Survey of Genomics Research
www.stanford.edu/class/siw198q/websites/genomics/
41
See for example, Borson, D. Benjamin (1995). “The Human Genome Projects: Patenting Human Genes and
Biotechnology. Is the Human Genome Patentable?” IDEA: The Journal of Law and Technology, Vol. 35, No. 4,
p.461-496
28](https://image.slidesharecdn.com/huang-120225055012-phpapp01/85/Huang-28-320.jpg)


![However, David (2004)60 asserted that patenting may shift academic culture, incentives and
restrict access to knowledge by arguing “… in a few specific research fields, and particularly
in the life sciences (biotechnology, pharmaceuticals and medical devices), where the share of
funding from industrial sources approaches twenty-five percent at the leading institutions, the
commercialization movement is perceptibly encroaching upon the culture of academic
research and challenging the ethos of collaborative, open science… [and] we must worry that
further and sustained policies of applying the same ‘remedy’ for the current fiscal situation of
the global open science system is likely to have profound and seriously adverse
transformative effects. In the end it could result in the paradoxical rise of excessively
duplicative research projects by scientists and engineers who find themselves effectively
isolated from recent additions to the stock of codified knowledge by increasingly dense
‘patent thickets,’ and by steeper ‘royalty stacking’ in the licenses imposed collectively by
owners of copyrights and database rights.”
In addition, patenting jeopardizes “disinterestedness” which refers to the restraining of
personal emotions, biases and financial attachment to scientists’ work – another norm of
science proposed by Merton. Disinterestedness involves institutional mechanisms to control
the motives for scientific research to advance scientific knowledge. Rewards constitute peer
recognition of scientific achievement, not through monetary gains. Ideally, the system of
reward and punishment in science should align the interests of the scientists with the scientific
institution to act in a disinterested manner (Merton, 1973).61 The incentives of patenting rests
60
David, Paul A. (2004). “Can "Open Science" be Protected from the Evolving Regime of IPR Protections?”
Journal of Institutional and Theoretical Economics (JITE), 160, 1, pp. 9-34
61
Merton, Robert K. (1973). “The Normative Structure of Science”, The Sociology of Science: Theoretical and
Empirical Investigations, Chicago, IL: The University of Chicago Press, Chapter 13, pp. 275-277.
38](https://image.slidesharecdn.com/huang-120225055012-phpapp01/85/Huang-38-320.jpg)
![on the shifting and growing acceptance of motives from pure academic recognition to a
balance with financial incentives and entrepreneurship (Etzkowitz, 1998).62,63 Such
incentives further promote the emotional attachment of scientists to their work and adversely
impacts scientists’ behavior in a disinterested manner.
Other Deviant Behaviors and Social Control
Extending from the previous discussion, it is worthwhile to consider some other forms of
deviant behaviors and social controls among modern scientists that Merton (1973 [1957]) and
other sociology of science scholars have described (Mulkay, 1969; Hagstrom, 1974;
Zuckerman, 1977). Priorities in particular scientific discoveries have often become the causes
of contention among biological scientists and other scientists alike – “on being first in
contributing new knowledge and in being recognized for it” and there is “often the ironic
consequences of this institutionalized pattern” (Smelser, 1988). Sometimes, the competition
may get too intense in Biology, and fraud, plagiarism and other forms of deviant behaviors
can occur when the desire for recognition surpasses the endeavor and will to advance
knowledge (Smelser, 1988).
Fraud is typically concerned with deviant behavior from the norms of “disinterestedness” and
“organized skepticism”. Fraud usually occurs when scientists knowingly attempt deceptive
activities for peer recognition or monetary gains. It can come in the forms of “forging” or
data fabrication, “trimming” or data manipulation, and “cooking” or data suppression
62
Etzkowitz, Henry (1998). “The norms of entrepreneurial science: cognitive effects of the new university-
industry linkages.” Research Policy, 27, 823-833.
63
For example, in the survey conducted by Etzkowitz (1998), although it identified half the faculty in MIT
Biology department as having industrial ties in the late 1980s, the informant could identify only one of his
colleagues as uninvolved.
39](https://image.slidesharecdn.com/huang-120225055012-phpapp01/85/Huang-39-320.jpg)
![(Babbage, 1976 [1830]). Data suppression is perhaps among the most difficult form of fraud
to identify as no lies are told and scientists have to decide about the selection of trustworthy
data. All three forms of fraud described by sociology of science scholars have occurred
occasionally in Biology.
Plagiarism, on the other hand, typically involves deviation from the norms of “communism”
and “universalism” as scientists illegitimately claim credits for work that was not originally
performed by them. When scientists engage in deliberate acts of deception by taking credits
where they are not theirs, including the copying of documents and wrongful appropriation of
intellectual properties, plagiarism occurs. The latter is usually harder to detect especially
under the circumstances of weak intellectual property right protection (such as copyrights and
patents), or a lack of consensus on what constitutes property rights in science.64 This situation
can be further complicated by instances of “multiples” as mentioned previously. This illegal
act, although sometimes observed in the scientific community, remains an ill-defined
normative area in modern science (Smelser, 1988).
Sociologists of science have considered that the social control of deviant behavior to entail
procedures for deterrence, detection and punishment. For example, to instill the biological
scientists with the norms through education and social pressure is one way of deterrence.
Another particularly effective social control is the “methodological canon of reproducibility
64
A particularly controversial example of intellectual property claim in Biology is a DNA patent application
demanding protection for cDNAs associated with Expressed Sequence Tags (ESTs). The U.S. Patent &
Trademark Office (USPTO) takes the position that an EST may be patentable if it meets the utility, novelty and
unobviousness requirements (e.g. ESTs sequenced from areas of the genome that have never been sequenced
before would meet the novelty and unobviousness requirements.) The issue can get even more controversial and
complicated when the invention claims not only the EST itself, but also the full-length gene that encompasses
the EST and other related genes that will hybridize to the EST under specified stringency conditions.
40](https://image.slidesharecdn.com/huang-120225055012-phpapp01/85/Huang-40-320.jpg)


![costs. This is the most vulnerable segment of society that needs them most. These remain as
critical ethical issues to be addressed.
2.3 Research, Development and the Innovative Process
Research and development (R&D) in the public sector and university-affiliated research
centers create new knowledge and tools and produces highly trained researchers. All these
contribute to the growth, dissemination and utilization of knowledge in the public domain and
private sector R&D and commercialization efforts, as well as create beneficial spillover
effects.
R&D can be viewed as inputs to the innovative process, while patents can be viewed as an
output. It is important to have a basic understanding of the innovative process and the
distinction between invention and innovation. The innovative process can be generally
characterized into three-stage: invention, innovation, and imitation (Hall, 1994, p. 21).
Invention is defined as “…the devising of new ways of attaining given ends … [embracing]
both the creation of new things previously non-existent, using either new or existing
knowledge, and the ‘creation’ of things which have existed all the time (e.g. penicillin).”74
Inventive activity requires inputs such as university research although much inventive activity
can be characterized as utilizing existing knowledge in a new or different way. As inventions
74
Hall, Peter (1994) Innovation, Economics and Evolution: Theoretical Perspectives on Changing Technology in
Economic Systems. London: Harvester Wheatsheaf.
Hall quoting from page 51 of Kennedy, C. and A. Thirlwall (1972) "Technical Progress", Economic Journal, 82,
11-72.
44](https://image.slidesharecdn.com/huang-120225055012-phpapp01/85/Huang-44-320.jpg)
![may be patented, they can be considered as an input to the development of an innovation.
Innovation is defined as "the commercial application of inventions for the first time"
[Kennedy and Thirlwall (1972, p. 56) referenced by Hall (1994, p. 21)]. Invention brings
about an idea while commercialization of that idea occurs in innovations for imitation to
occur, whereby successful innovations are adopted throughout the market for society benefits.
This dissertation is primarily concerned with the characteristics (i.e. basicness and
appropriability) of innovations in the life sciences, the diffusion and accumulation of
scientific knowledge, and the impact of patenting on that process, set against the backdrop of
the Human Genome Project. It is natural to begin with a discussion and historical review of
the Human Genome Project in the next Chapter.
45](https://image.slidesharecdn.com/huang-120225055012-phpapp01/85/Huang-45-320.jpg)


![recommended a 15-year, multidisciplinary, scientific, and technological undertaking to map
and sequence the human genome. DOE also designated important multidisciplinary human
genome centers that year, including the Whitehead Institute Center for Genome Research at
Massachusetts Institute of Technology, Washington University School of Medicine Genome
Sequencing Center, University of Washington Genome Center in the U.S. National Institute
of General Medical Sciences at National Institutes of Health84 (NIGMS-NIH) began funding
of genome projects that year.
In 1988, congressional Office of Technology Assessment (OTA) and National Academy of
Sciences (NAS) National Research Council (NRC) committees recommended a concerted
genome research program. Over the next year, DOE and NIH held several other meetings and
independent hearings by OTA and by NAS to discuss the plans for the HGP.
Also in the same year, the Human Genome Organization (HUGO)85 was founded by scientists
to coordinate efforts internationally. The first annual Cold Spring Harbor Laboratory meeting
on human genome mapping and sequencing was also held.
That year, Congress funded both the Department of Energy (DOE) and the National Institute
of Health (NIH) to start further exploration of the human genome, and DOE and NIH signed a
84
The National Institutes of Health (NIH), founded in 1887, is one of the world's premier medical research
centers, and the Federal focal point for medical research in the U.S. The NIH, comprising 27 separate Institutes
and Centers , is one of eight health agencies of the Public Health Service which, in turn, is part of the U.S.
Department of Health and Human Services.
The primary mission of NIH is to “acquire new knowledge to help prevent, detect, diagnose, and treat disease
and disability, from the rarest genetic disorder to the common cold…[and] to uncover new knowledge that will
lead to better health for everyone.” By its key involvement in the HGP, NIH works toward that mission and
advances human health by “conducting research in its own laboratories; supporting the research of non-Federal
scientists in universities, medical schools, hospitals, and research institutions throughout the country and abroad;
helping in the training of research investigators; and fostering communication of medical and health sciences
information.”
85
http://www.gene.ucl.ac.uk/hugo/
51](https://image.slidesharecdn.com/huang-120225055012-phpapp01/85/Huang-51-320.jpg)


![The ensuing years saw continued and promising development and improvement of resources,
technologies and scientific techniques, and optimism for the potential for commercialization
of the human genome sequences.102 In 1992, low-resolution genetic linkage map of entire
human genome was published. The guidelines103 for data release and resource sharing of the
human genome project were also announced by DOE and NIH to encourage data and resource
sharing.
In 1993, the international Integrated Molecular Analysis of Gene Expression (IMAGE)
Consortium104 was established to coordinate efficient mapping and sequencing of gene-
representing cDNAs. The consortium produced highly cited scientific papers that made
significant contribution to the progress of the Human Genome Project.105 At the same time,
DOE and NIH revised their initial 5-year plan for the Human Genome Project due to rapid
advances in genome research and more in-depth understanding of how to attain long-term
objectives.106,107 In terms of technology advances, Lawrence Berkeley National Laboratory
(LBNL) of DOE implemented a novel transposon-mediated chromosome-sequencing system
while Gene Recognition and Analysis Internet Link (GRAIL) sequence-interpretation
102
Business Week (3-2-92), “Cover Story – This Genetic Map will Lead to a Pot of Gold”, Vol. No. 3254, Pg
74, McGraw-Hill, Inc
103
Human Genome News, January 1993; 4(5), “NIH, DOE Guidelines Encourage Sharing of Data, Resources.”
http://www.ornl.gov/sci/techresources/Human_Genome/publicat/hgn/v4n5/04share.shtml
104
Human Genome News, Mar.-Apr. 1995; 6(6), “IMAGE Characterizes cDNA Clones”.
http://www.ornl.gov/sci/techresources/Human_Genome/publicat/hgn/v6n6/3image.shtml
105
The Scientist 13[4]: 17, Feb. 15, 1999. Hot Papers In Genomics: G. Lennon, C. Auffray, M. Polymeropoulos,
M.B. Soares, "The I.M.A.G.E. Consortium: An Integrated Molecular Analysis of Genomes and Their
Expression," Genomics, 33:1512, 1996. (Cited in more than 290 papers since publication).
http://www.ornl.gov/sci/techresources/meetings/wccs/hot1_990215.html
106
Human Genome News, November 1993: 5(4), “U.S. Human Genome Project Updates Goals”.
http://www.ornl.gov/sci/techresources/Human_Genome/publicat/hgn/v5n4/5yrtextr.shtml
107
Science 262, 43-46 (Oct. 1, 1993)
56](https://image.slidesharecdn.com/huang-120225055012-phpapp01/85/Huang-56-320.jpg)
![service108 maintained by Oak Ridge National Laboratory (ORNL) of DOE started to provide
Internet access.
1994 brought in encouraging news that the genetic-mapping 5-year goal presented by DOE
and NIH was achieved one year ahead of schedule.109 The second-generation DNA clone
libraries representing each human chromosome were also completed that same year by
Lawrence Livermore National Laboratory (LLNL) and Lawrence Berkeley National
Laboratory (LBNL).
In terms of scientific breakthroughs, LANL and LLNL respectively announced in 1995 the
completion of high-resolution physical maps of chromosome 16 and 19.110 Moderate-
resolution maps of chromosomes 3, 11, 12, and 22 maps were also published.111 Research led
by scientists from the MIT Whitehead Institute Center for Genome Research and Genethon
revealed and published the physical map of the human genome with more than 15,000
sequence tagged site (STS) markers.112
In 1996, DOE and National Center for Human Genome Research (NCHGR) at National
Institutes of Health issued human subject guidelines for large-scale sequencing projects.113 In
the same year, DOE started another 6 pilot projects on BAC and sequencing.114, 115 This new
108
http://genome.ornl.gov/
109
Human Genome News, Nov. 1994; 6(4):1, “Genetic Map Goal Met Ahead of Schedule”
http://www.ornl.gov/sci/techresources/Human_Genome/publicat/hgn/V6N4/MAPGOALS.shtml
110
Human Genome News, Jan.-Feb. 1995; 6(5): 2, “High-Resolution Physical Maps of Chromosomes 16 and 19
Completed”. http://www.ornl.gov/sci/techresources/Human_Genome/publicat/hgn/v6n5/2safchrm.shtml
111
Human Genome News, Jan.-Feb. 1995; 6(5): 14, “Groups Publish Detailed Chromosome 22 Map”.
http://www.ornl.gov/sci/techresources/Human_Genome/publicat/hgn/v6n5/14chrom2.shtml
112
Human Genome News, January-March 1996; 7(5), “Detailed Human Physical Map Published by Whitehead-
MIT”. http://www.ornl.gov/sci/techresources/Human_Genome/publicat/hgn/v7n5/05detail.shtml
113
Human Genome News, July-September 1996; 8:(1), “DOE, NCHGR Issue Human Subject Guidelines”.
http://www.ornl.gov/sci/techresources/Human_Genome/publicat/hgn/v8n1/08humans.shtml
114
These pilot projects to test the feasibility of this new strategy, its technologies, and its economics were
conducted by Mark Adams [The Institute for Genomic Research (TIGR)], Leroy Hood (University of
57](https://image.slidesharecdn.com/huang-120225055012-phpapp01/85/Huang-57-320.jpg)
![strategy to assemble ordered, overlapping sets (or contigs) of high-quality, sequence-ready
clones for complete genome sequencing was prompted by the availability of newer, more
stable clone resources containing large human DNA inserts (up to 150,000 bases).
Another landmark event that occurred during that year is the large-scale sequencing strategy
meeting for international coordination of human genome sequencing in Bermuda on February
25-28, 1996 sponsored by the Wellcome Trust, U.K. Medical Research Council. About 50
scientists from countries publicly supporting large-scale human genome sequencing attended
the conference, which was designed to coordinate, compare, and evaluate human genome
mapping and sequencing strategies; consider the potential role of new technologies in
sequencing and informatics; and discuss scenarios for data release. A consensus was reached
that the eventual sequencing outcome representing the first human genome sequence should
be conducted at a high degree of accuracy.
In 1997, the Human Genome Project participants (participating organizations and funding
agencies) agreed on sequencing data release policy at the Second International Strategy
Meeting on Human Genome Sequencing.116 That year, in order to implement high-
throughput activities, DOE also made effort to tie the expertise and resources in genome
mapping, DNA sequencing, technology development, and information sciences pioneered at
the DOE genome centers at Lawrence Berkeley National Laboratory (LBNL), Lawrence
Livermore National Laboratory (LLNL), and Los Alamos National Laboratory (LANL) by
Washington, Seattle), and Melvin Simon (California Institute of Technology); and Glen Evans with Harold
Garner [University of Texas Southwest (UTSW) Medical Center], Pieter de Jong (Roswell Park Cancer Center),
and Julie Korenberg (Cedars Sinai Medical Center).
See also Human Genome News, July-September 1996; 8:(1), “BAC End-Sequencing Projects Initiated”.
http://www.ornl.gov/sci/techresources/Human_Genome/publicat/hgn/v8n1/08bacend.shtml
115
Also see Nature (381, 364-66)
116
Held in Bermuda from 27th February 1997 to 2nd March 1997.
58](https://image.slidesharecdn.com/huang-120225055012-phpapp01/85/Huang-58-320.jpg)


![DNA microarrays 1996
Normalized and subtracted cDNA
1996
libraries
Eukaryotic, whole-genome knockouts
1999
(yeast)
Scale-up of two-hybrid mapping 2002
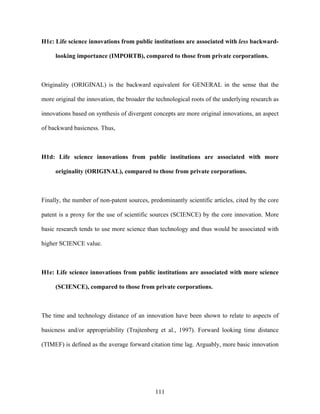
Figure 3.4 below illustrates the inter-relationship among the key stakeholders (or
organizations) involved in the HGP.
Figure 3.4: HGP Organization Map of the Key Stakeholders
The Human Genome Project (1990-2003)
PUBLIC: HERAC
(Advisory)
NIH DOE
OTA
NAS-NRC
DHHS NIGMS BER [OHER]
(Renaming Org,) (Funding) (Announcement) RTI
(Genome
Database)
NHGRI (1997) Joint Genome Institute (JGI)
[NCHGR] LBNL, LLNL, LANL (1997)
Genome Centers (U.S.A.) Other Genome Centers in the World
Whitehead, U Wash, Wash U Sanger (U.K.), CHGC (China) etc.
PRIVATE:
Celera Genomics (1998)
63](https://image.slidesharecdn.com/huang-120225055012-phpapp01/85/Huang-63-320.jpg)


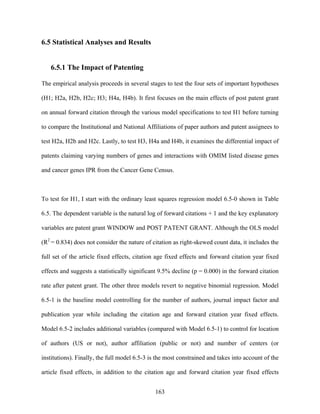
![181
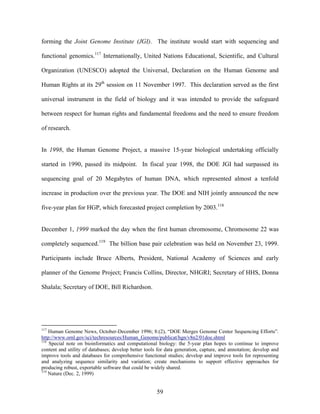
Table 4.6: Summary of Variables in Fixed-Effects NBRM and OLS Model Output
[4.6-0] NBRM: DV = CFC
OLS HGP Related Publication Only
DV = ln(CFC+1) Coefficients reported as incidence rate ratios, IRR
HGP Related Pub Only [4.6-1] [4.6-2] [4.6-3]
[Non-exponentiated Baseline: Full w/o Full w/ Center FE
coefficients reported in w/o Publication Center FE
square brackets] Characteristics
Independent Variables
Matched Patent [322] (2) 2.59 2.89 2.25 (1)
(163) (.700) (.706) (.529)
Control Variables
Publication Year [-10.2] .812 .819 .804
(1.59) (.016) (.014) (.014)
Author Count [5.13] 1.003 (N) 1.004 (2) 1.004 (2)
(1.14) (.0026) (.0018) (.0019)
Center Count [9.94] (2) 1.05 1.05 1.05
(4.09) (.013) (.0099) (.0105)
Journal IF 2003 [1.68] (3) 1.08 1.09 1.08
(Journal Quality) (.957) (.0056) (.0049) (.0050)
Article Type [30.2] 16.1 14.5 14.9
(Article/ Review) (7.67) (2.49) (2.15) (2.12)
Industrial (Research) [112] (2) .987 (N) .922 (N) 1.01 (N)
Collaboration (46.5) (.177) (.148) (.179)
Human or Direct [33.5] (2) .961 (N) 1.01 (N)
Application to Human (16.6) (.110) (.105)
Specific Human [2.14] (N) .568 .593
Genome Sequencing (12.5) (.060) (.061)
Techniques/ Tools/ [42.4] (1) 2.45 2.41
Software (13.4) (.500) (.484)
Parametric Restrictions
Center Fixed Effects # Restrict 6 # Restrict 6
χ2 30.89 χ2 27.23
p-value 0.00 p-value 0.00
Regression Statistics
Log Pseudo-likelihood -5745 -5708 -5684
P-value of Wald χ2 0.000 0.000 0.000
R-Squared 0.52
# of Observations 1412 1412 1412 1412
All with p-value = 0.000 unless otherwise specified below:
(1) < 0.01; (2) < 0.05; (3) < 0.10; (N) > 0.10 (not stat. sig.)
Robust standard errors are shown in parentheses.
Lighter shade: statistically significant. Darker shade: not statistically significant
181
In all cases, we employed NBRM with dispersion as a function of the expected mean of the counts for the i-th
observation, which yields a higher likelihood ratio (better goodness-of-fit) than NBRM with dispersion as a
constant for all observations.
Note: Including a “publication age” fixed effects, defined by year 2003 minus year of publication, on full model
4.6-3 generated very similar results.
98](https://image.slidesharecdn.com/huang-120225055012-phpapp01/85/Huang-98-320.jpg)

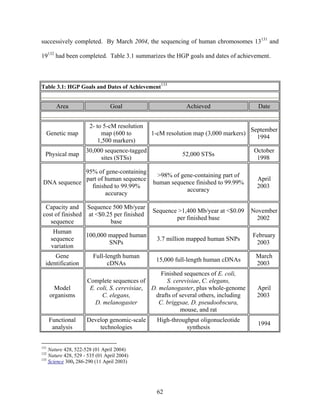
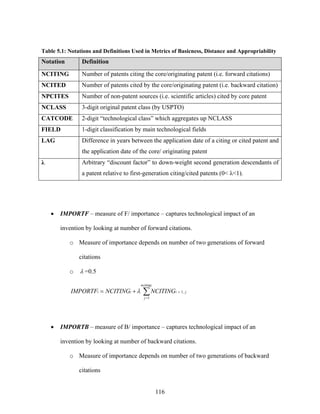
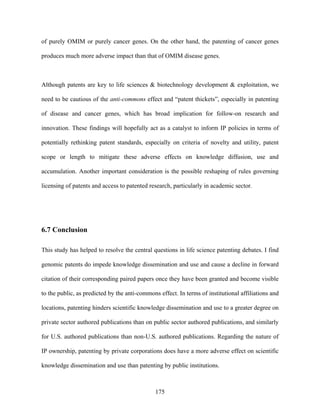
![average), citation rate of publications with matched patent pair displays a significant
boost of more than two times over the citation rate of publications without patent
pairs. However, the chart also shows that at the fifth year from publication, citation
rate of publication with patent pair decreases rapidly and converges to that of
publication without patent on its eighth year. During these later years, patented articles
are often in their post patent grant phase, perhaps helping to explain the rapid decline.
Chapter 6 complements this analysis in these regards by exploiting the temporal trend
of pre- versus post- patent grant period for approved patents with paired publication.
Figure 4.6: Citations of Publications with and without Patent Pairs (All Whitehead HGP
Articles)
Citations by Type (w and w/o Patent Pair) by Age
[All Whitehead HGP Articles]
160
140
A v e r a g e C ita tio n s P e r
120
100 Avg Citation Per Year (w Pat Pair)
80
Year
60 Avg Citation Per Year (no Pat
40 Pair)
20
0
-20 0 5 10 15
Years Since Publication
100](https://image.slidesharecdn.com/huang-120225055012-phpapp01/85/Huang-100-320.jpg)


![to the scientific literature, among others. It would also contain information on the matching
core publications such as ISSN, publication dates, titles and abstracts of publications, number
of forward citations, author names, number of authors, author affiliations and addresses etc.
The patent data set was developed through a two-step process: 1) gathering of the initial set of
U.S. granted patents; and 2) comparing if the sequences claimed match human nucleotide
sequences and the assignment of the sequence (i.e. the patent) to a specific gene. The first
stage of this procedure was described by Jensen and Murray (2005) below:204
“A set of 691,259 sequences was downloaded (all data were obtained on 5 April 2005)
from the U.S. National Center for Biotechnology Information nucleotide database using
the following Entrez Nucleotide search: "gbdiv pat" [Properties] AND srcdb_genbank
[PROP]. This search criterion extracts only those sequences from the GenBank database
that were entered by the GenBank patent division. These sequence data are sent weekly to
the GenBank patent division by the U.S. Patent and Trademark Office and contain
nucleotide sequences disclosed in issued U.S. patents. From the 691,259 sequences
obtained from our Entrez Nucleotide search criteria, we removed sequences from World
Intellectual Property Organization (WIPO) and European Patent Office (EPO) patents,
which were in the database for an unknown reason, giving an initial database size of
686,864 nucleotide sequences. These sequences were removed because our aim was to
develop the most extensive and comprehensive data on U.S. granted patents rather that
204
Jensen, Kyle and Fiona Murray (2005). Supporting Online Material for the Intellectual Property Landscape of
the Human Genome. Science, Vol. 310, 14 October, pp. 239-240
121](https://image.slidesharecdn.com/huang-120225055012-phpapp01/85/Huang-121-320.jpg)


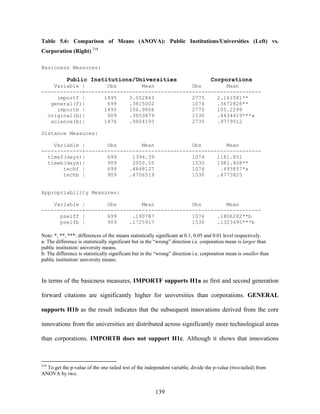


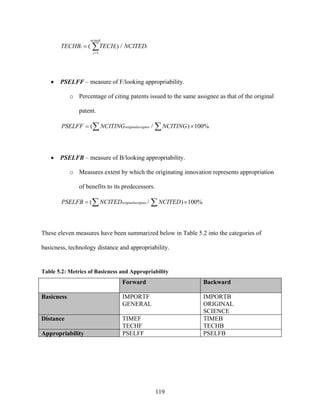
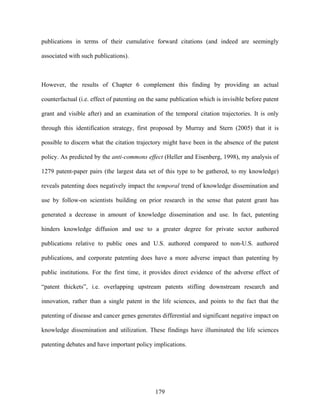
![Table 5.8: Regression of IMPORTF on B/Variables (Controlling for Characteristics of Research,
Technological Fields and Application Year)
Source | SS df MS Number of obs = 2439
-------------+------------------------------ F( 10, 2428) = 24.98
Model | 27551.2325 10 2755.12325 Prob > F = 0.0000
Residual | 267784.363 2428 110.2901 R-squared = 0.0933
-------------+------------------------------ Adj R-squared = 0.0896
Total | 295335.596 2438 121.138472 Root MSE = 10.502
------------------------------------------------------------------------------
importf | Coef. Std. Err. t P>|t| [95% Conf. Interval]
-------------+----------------------------------------------------------------
importb | .0008796 .0004543 1.94 0.053 -.0000112 .0017704
original | .5677436 .668723 0.85 0.396 -.743583 1.87907
timeb(days) | .0002549 .0001848 1.38 0.168 -.0001074 .0006172
techb | .2629846 .6529932 0.40 0.687 -1.017497 1.543466
science | -3.896916 1.553182 -2.51 0.012 -6.942614 -.8512175
chem | 3.117151 10.52355 0.30 0.767 -17.51892 23.75323
drugs_medi~l | 3.655549 10.52477 0.35 0.728 -16.9829 24.294
public_only | -.9698782 1.034217 -0.94 0.348 -2.997918 1.058162
private_only | -.2398892 1.003801 -0.24 0.811 -2.208283 1.728505
applicatn_yr | -1.362425 .0879082 -15.50 0.000 -1.534808 -1.190042
cons | 2723.757 175.7468 15.50 0.000 2379.128 3068.387
------------------------------------------------------------------------------
Table 5.9: Regression of GENERAL on B/Variables (Controlling for Characteristics of
Research, Technological Fields and Application Year)
Source | SS df MS Number of obs = 994
-------------+------------------------------ F( 10, 983) = 20.45
Model | 19.8657214 10 1.98657214 Prob > F = 0.0000
Residual | 95.4834655 983 .097134756 R-squared = 0.1722
-------------+------------------------------ Adj R-squared = 0.1638
Total | 115.349187 993 .116162323 Root MSE = .31166
------------------------------------------------------------------------------
general | Coef. Std. Err. t P>|t| [95% Conf. Interval]
-------------+----------------------------------------------------------------
importb | -8.90e-07 .0000257 -0.03 0.972 -.0000513 .0000496
original | .095374 .0314699 3.03 0.003 .033618 .1571299
timeb(days) | .0000154 8.81e-06 1.75 0.080 -1.84e-06 .0000327
techb | -.0127838 .0299453 -0.43 0.670 -.0715478 .0459802
science | -.1739112 .0754461 -2.31 0.021 -.3219652 -.0258573
chem | .0343818 .3132438 0.11 0.913 -.5803216 .6490852
drugs_medical| .0514584 .3130888 0.16 0.869 -.5629409 .6658577
public_only | -.0473436 .0450075 -1.05 0.293 -.1356654 .0409783
private_only | -.0279605 .044027 -0.64 0.526 -.1143583 .0584372
applicant_yr | -.0631731 .0047105 -13.41 0.000 -.0724168 -.0539294
cons | 126.5593 9.408999 13.45 0.000 108.0952 145.0233
------------------------------------------------------------------------------
144](https://image.slidesharecdn.com/huang-120225055012-phpapp01/85/Huang-144-320.jpg)


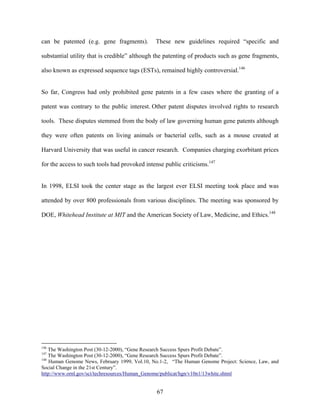
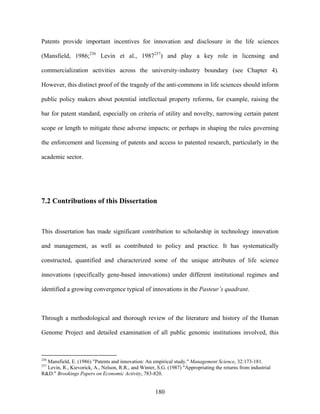
![229
Table 6.5: Impact of Post Patent Grant
[6.5-0] NBRM: DV = FC
OLS (I): Coefficients reported as incidence rate ratios, IRR
DV = ln(FC+1) [6.5-1] [6.5-2] [6.5-3]
[Non-exponentiated Baseline Marginal Full
coefficients reported Effects
in square brackets]
Independent Variables
Post Patent Grant Effects
Patent Grant Window [-.0197] (N) .925 (3) .930 (N) .986 (N)
(window) (.018) (.043) (.043) (.016)
Post Patent Grant [-.0946] .821 .827 .954 (2)
(pat_inforce) (.021) (.037) (.037) (.018)
Control Variables
Author Count 1.04 1.03
(.0026) (.0033)
US Author .938 (3)
(Location) (.033)
Public Author .939 (2)
(Institution Affiliation) (.029)
Center Count 1.03
(.0082)
Journal IF 2005 1.08 1.08
(Journal Quality) (.0012) (.0012)
Publication Year .913 .917
(.0040) (.0044)
Parametric Restrictions
Article FE # Restrict 1277 # Restrict 1277
F 68.38 χ2 103364
p-value 0.000 p-value 0.000
Citation Age FE # Restrict 18 # Restrict 17 # Restrict 17 # Restrict 18
F 253.92 χ2 1727 χ2 1543 χ2 3267
p-value 0.000 p-value 0.000 p-value 0.000 p-value 0.000
FC Year FE # Restrict 18 # Restrict 18 # Restrict 18 # Restrict 18
F 79.11 χ2 392 χ2 421 χ2 1850
p-value 0.000 p-value 0.000 p-value 0.000 p-value 0.000
Regression Statistics
Log-likelihood -41791 -41775 -32939
P-value of Wald χ2 0.000 0.000 0.000
R-Squared 0.834
# of Observations 12830 12830 12830 12830
All with p-value = 0.000 unless otherwise specified below:
(1) < 0.01; (2) < 0.05; (3) < 0.10; (N) > 0.10 (not stat. sig.)
Robust standard errors are shown in parentheses.
Lighter shade: statistically significant. Darker shade: not statistically significant
229
As before, I employed NBRM with dispersion as a function of the expected mean of the counts for the i-th
observation, which yields a higher likelihood ratio (better goodness-of-fit) than dispersion as a constant.
165](https://image.slidesharecdn.com/huang-120225055012-phpapp01/85/Huang-165-320.jpg)


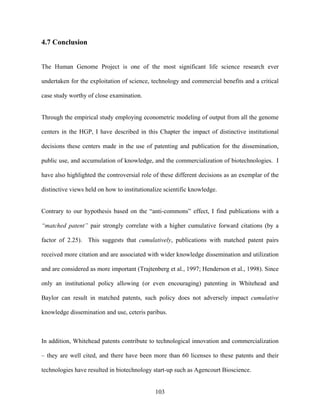
![Table 6.6: NBRM Results by Institutional or National Affiliations
NBRM: DV = FC
Coefficients reported as incidence rate ratios, IRR
[6.6-1] [6.6-2] [6.6-3] [6.6-4] [6.6-5]
No Public No Private Purely No US No Public
Author vs. Author vs. Private vs. Author vs. Sector Patent
Public Author Private Purely US Author Assignee vs.
Author Public Public Sector
Author Patent
Assignee
Independent Variables
Article or Patent Characteristics/ Interactions
Patent Grant Window .985 (N) .983 (N) 1.01 (N) .985 (N) .986 (N)
(window) (.016) (.016) (.015) (.016) (.016)
Post Patent Grant* .885 (1)
No Public Author (.031)
Post Patent Grant* .964 (3)
Public Author (.018)
Post Patent Grant* .986 (N)
No Private Author (.019)
Post Patent Grant* .885
Private Author (.023)
Post Patent Grant* .927 (2)
(No Public) Purely (.031)
Private Author
Post Patent Grant* 1.03 (3)
(No Private) (.019)
Purely Public Author
Post Patent Grant* .990 (N)
No US Author (.027)
Post Patent Grant* .944 (1)
US Author (.019)
Post Patent Grant* .920
No Public Assignee (.022)
Post Patent Grant* .975 (N)
Public Assignee (.020)
Control Variables
Article FE # Restrict 1277 #Restrict1277 #Restrict1277 #Restrict1277 # Restrict 1277
χ2 103195 χ2 101747 χ2 103644 χ2 103334 χ2 103039
p-value 0.000 p-value 0.000 p-value 0.000 p-value 0.000 p-value 0.000
Citation Age FE # Restrict 18 # Restrict 18 # Restrict 18 # Restrict 18 # Restrict 18
χ2 3276 χ2 3306 χ2 3272 χ2 3276 χ2 3259
p-value 0.000 p-value 0.000 p-value 0.000 p-value 0.000 p-value 0.000
FC Year FE # Restrict 18 # Restrict 18 # Restrict 18 # Restrict 18 # Restrict 18
χ2 1846 χ2 1842 χ2 1880 χ2 1853 χ2 1842
p-value 0.000 p-value 0.000 p-value 0.000 p-value 0.000 p-value 0.000
168](https://image.slidesharecdn.com/huang-120225055012-phpapp01/85/Huang-168-320.jpg)


![Table 6.7: NBRM Results by OMIM Disease Gene or Cancer Gene IPR
NBRM: DV = FC
Coefficients reported as incidence rate ratios, IRR
[6.7-1] [6.7-2] [6.7-3] [6.7-4] [6.7-5]
Patent Thicket: No OMIM No Cancer Not OMIM & OMIM &
Genes Claimed Disease Gene vs. Cancer Gene Cancer Gene
by Multiple Gene vs. Cancer Gene vs. OMIM & vs. OMIM not
Patents OMIM Cancer Gene Cancer Gene
Disease Gene (OMIM or (OMIM or
Cancer Only) Cancer Only)
Independent Variables
Patent Characteristics/ Interactions
Patent Grant Window .979 (N) .988 (N) .987 (N) 1.01 (N) .978 (N)
(window) (.016) (.016) (.016) (.029) (.026)
Post Patent Grant* .944 (1)
Gene Claimed/ (.018)
Patented 1-5 Times
Post Patent Grant* .901 (1)
Gene Claimed/ (.030)
Patented 6-10 Times
Post Patent Grant* .971 (N)
No OMIM Entry/Gene (.019)
Post Patent Grant* .916
OMIM Entry/Gene (.023)
Post Patent Grant* .961 (2)
No Cancer Gene (.018)
Post Patent Grant* .886 (1)
Cancer Gene (.033)
Post Patent Grant* 1.07 (2)
Not (OMIM & Cancer (.035)
Gene)
Post Patent Grant* .860 (1)
OMIM & Cancer (.043)
Gene
Post Patent Grant* .813
OMIM & Cancer (.040)
Gene
Post Patent Grant* .991 (N)
OMIM but not Cancer (.032)
Gene
Control Variables
Article FE # Restrict1277 #Restrict1277 #Restrict1277 # Restrict346 # Restrict346
χ2 101480 χ2 101833 χ2 100396 χ2 36207 χ2 36478
p-value 0.000 p-value 0.000 p-value 0.000 p-value 0.000 p-value 0.000
Citation Age FE # Restrict 18 # Restrict 18 # Restrict 18 # Restrict 18 # Restrict 18
χ2 3290 χ2 3678 χ2 3324 χ2 1260 χ2 1293
p-value 0.000 p-value 0.000 p-value 0.000 p-value 0.000 p-value 0.000
172](https://image.slidesharecdn.com/huang-120225055012-phpapp01/85/Huang-172-320.jpg)


![ADDITIONAL REFERENCES
[1] Allen, Thomas J. (1977), Managing the Flow of Technology, Cambridge, MA: MIT Press,
reprinted 1993, Chapters 5-7.
[2] Bresnahan, T. and M. Trajtenberg (1995), "General Purpose Technologies: Engines of
Growth?", Journal of Econometrics, Vol. 65, pp. 83-108.
[3] Henderson, Rebecca and Ian Cockburn (1994), "Measuring Competence? Exploring Firm
Effects in Pharmaceutical Research", Strategic Management Journal, Vol. 15 (Special Issue:
Competitive Organizational Behavior; winter), pp. 63-84.
[4] Nelson, R. (1959), "The Simple Economics of Basic Scientific Research", Journal of
Political Economy, Vol. 67, No. 3, pp. 297-306.
[5] Smelser, Neil J. (1994), Sociology, Cambridge, MA: Blackwell Publishers, Chapters 1, 2
and 3
[6] Smelser, Neil J. eds. (1988), “The Sociology of Science”, Handbook of Sociology,
London, UK: Sage Publications, second printing 1989, Chapter 16
[7] Teece, David J. (1987), "Profiting from Technological Innovation: Implications for
Integration, Collaboration, Licensing and Public Policy", The Competitive Challenge:
Strategies for Industrial Innovation and Renewal. ed. David J Teece, Cambridge (MA):
Ballinger, pp. 185-219 (chap. 9).
[8] Thursby, J. G. and M. C. Thursby (2002). “Who is selling the Ivory Tower? Sources of
growth in university licensing.” Management Science 48(1): 90-104.
[9] Utterback, James M. (1974), "The Innovation Process", Science, Vol 183 (Feb 15th),
pp.658-662, reprinted in Readings in the Management of Technological Innovation, eds.
Tushman and Moore (1988), New York: Harper Collins.
184](https://image.slidesharecdn.com/huang-120225055012-phpapp01/85/Huang-184-320.jpg)


