SlideShare a Scribd company logo
1 of 1
Download to read offline
QVP Performance vs S&P 500
                                         (unaudited and net of fees and trading costs)

          50.00%

                                                       43.04%                 43.04%


          40.00%


                                                                                                     The information contain herein is obtained from sources 
          30.00%                                                                                     believed to be reliable, but its accuracy or completeness in 
                                                                                                     not guaranteed.  This report is for informational purposes 
                                                                                                     only and is not a solicitation or a recommendation that 
                                                            23.45%                  23.45%           any particular investor should purchase or sell any 
                                                                                                     particular security.  All expressions of opinions are subject 
                                                                  19.59%                    19.59%   to change without notice.
Returns


          20.00%
                                                                                                     Past performance is no guarantee of future results.
R


                                     8.16%
          10.00%
                    5.60%                 5.49%                                                                                                        5.49%
                             3.83%                                                                                                       2.88%
                                              2.68%
                        1.78%

           0.00%
                                                                                                                     ‐0.27%
                    One Month        Three Months           YTD                   1‐Year                     3‐Years*                    Inception**
                                                                                                                                             ‐2.62%


                                                                                                              ‐7.70%
                                                                                                         ‐7.97%
          ‐10.00%
                                                                                                     *  3‐Year and Inceptions return numbers have been annualized.
                                                      QVP   S&P 500        Net Difference            ** Inception of portfolio was May, 2005 while at Bear Stearns.


                                                                                                                                                               1/15/2010

More Related Content

Similar to QVP Performance

Odds of investing in indian equity market
Odds of investing in indian equity marketOdds of investing in indian equity market
Odds of investing in indian equity marketgautambhupal
 
Avant Garde Wealth Mgmt - Quarterly letter - 1112
Avant Garde Wealth Mgmt - Quarterly letter - 1112Avant Garde Wealth Mgmt - Quarterly letter - 1112
Avant Garde Wealth Mgmt - Quarterly letter - 1112Gaurav Jalan
 
capital onePrinter Friendly Version of the Conference Call Presentation
capital onePrinter Friendly Version of the Conference Call Presentationcapital onePrinter Friendly Version of the Conference Call Presentation
capital onePrinter Friendly Version of the Conference Call Presentationfinance13
 
Edelman Trust Barometer 2011 China Findings
Edelman Trust Barometer 2011 China FindingsEdelman Trust Barometer 2011 China Findings
Edelman Trust Barometer 2011 China FindingsEdelman APACMEA
 
2011 Edelman Trust Barometer: South Korea Insights
2011 Edelman Trust Barometer: South Korea Insights2011 Edelman Trust Barometer: South Korea Insights
2011 Edelman Trust Barometer: South Korea InsightsEdelman Korea
 
2011 Trust Barometer India_Deck - Edelman India
2011 Trust Barometer India_Deck - Edelman India2011 Trust Barometer India_Deck - Edelman India
2011 Trust Barometer India_Deck - Edelman IndiaKarthik Srinivasan
 
2011 Edelman Trust Barometer
2011 Edelman Trust Barometer 2011 Edelman Trust Barometer
2011 Edelman Trust Barometer Edelman
 
Trust Barometer 2010 APAC Findings
Trust Barometer 2010 APAC FindingsTrust Barometer 2010 APAC Findings
Trust Barometer 2010 APAC FindingsEdelman APACMEA
 
Masc legislative action day 20120215
Masc legislative action day 20120215Masc legislative action day 20120215
Masc legislative action day 20120215SCRetirement
 
Avant garde wealth mgmt quarterly letter - 1212
Avant garde wealth mgmt   quarterly letter - 1212Avant garde wealth mgmt   quarterly letter - 1212
Avant garde wealth mgmt quarterly letter - 1212Gaurav Jalan
 
The Executive Centre Ppt
The Executive Centre   PptThe Executive Centre   Ppt
The Executive Centre Pptratanpriya
 

Similar to QVP Performance (20)

Telenor Pakistan Tcm28 35232
Telenor Pakistan Tcm28 35232Telenor Pakistan Tcm28 35232
Telenor Pakistan Tcm28 35232
 
Odds of investing in indian equity market
Odds of investing in indian equity marketOdds of investing in indian equity market
Odds of investing in indian equity market
 
Avant Garde Wealth Mgmt - Quarterly letter - 1112
Avant Garde Wealth Mgmt - Quarterly letter - 1112Avant Garde Wealth Mgmt - Quarterly letter - 1112
Avant Garde Wealth Mgmt - Quarterly letter - 1112
 
capital onePrinter Friendly Version of the Conference Call Presentation
capital onePrinter Friendly Version of the Conference Call Presentationcapital onePrinter Friendly Version of the Conference Call Presentation
capital onePrinter Friendly Version of the Conference Call Presentation
 
Edelman Trust Barometer 2011 China Findings
Edelman Trust Barometer 2011 China FindingsEdelman Trust Barometer 2011 China Findings
Edelman Trust Barometer 2011 China Findings
 
2011 Edelman Trust Barometer: South Korea Insights
2011 Edelman Trust Barometer: South Korea Insights2011 Edelman Trust Barometer: South Korea Insights
2011 Edelman Trust Barometer: South Korea Insights
 
BIG Call June 2012 Sneak Peek
BIG Call June 2012 Sneak PeekBIG Call June 2012 Sneak Peek
BIG Call June 2012 Sneak Peek
 
2011 Trust Barometer India_Deck - Edelman India
2011 Trust Barometer India_Deck - Edelman India2011 Trust Barometer India_Deck - Edelman India
2011 Trust Barometer India_Deck - Edelman India
 
2011 Edelman Trust Barometer
2011 Edelman Trust Barometer 2011 Edelman Trust Barometer
2011 Edelman Trust Barometer
 
Trust Barometer 2010 APAC Findings
Trust Barometer 2010 APAC FindingsTrust Barometer 2010 APAC Findings
Trust Barometer 2010 APAC Findings
 
Masc legislative action day 20120215
Masc legislative action day 20120215Masc legislative action day 20120215
Masc legislative action day 20120215
 
Edelman Trust Barometer 2010
Edelman Trust Barometer 2010Edelman Trust Barometer 2010
Edelman Trust Barometer 2010
 
Liability management at GM
Liability management at GMLiability management at GM
Liability management at GM
 
NARI Q3 Remodeling Business Pulse 2012
NARI Q3 Remodeling Business Pulse 2012NARI Q3 Remodeling Business Pulse 2012
NARI Q3 Remodeling Business Pulse 2012
 
What's Your Business Grade?
What's Your Business Grade?What's Your Business Grade?
What's Your Business Grade?
 
Big Call July 2012
Big Call July 2012Big Call July 2012
Big Call July 2012
 
1Q09 Presentation
1Q09 Presentation1Q09 Presentation
1Q09 Presentation
 
Avant garde wealth mgmt quarterly letter - 1212
Avant garde wealth mgmt   quarterly letter - 1212Avant garde wealth mgmt   quarterly letter - 1212
Avant garde wealth mgmt quarterly letter - 1212
 
2Q10 Presentation
2Q10 Presentation2Q10 Presentation
2Q10 Presentation
 
The Executive Centre Ppt
The Executive Centre   PptThe Executive Centre   Ppt
The Executive Centre Ppt
 

QVP Performance

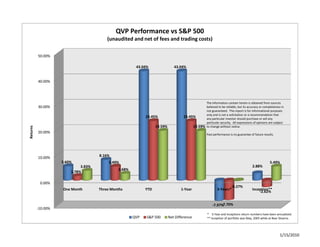
  • 1. QVP Performance vs S&P 500 (unaudited and net of fees and trading costs) 50.00% 43.04% 43.04% 40.00% The information contain herein is obtained from sources  30.00% believed to be reliable, but its accuracy or completeness in  not guaranteed.  This report is for informational purposes  only and is not a solicitation or a recommendation that  23.45% 23.45% any particular investor should purchase or sell any  particular security.  All expressions of opinions are subject  19.59% 19.59% to change without notice. Returns 20.00% Past performance is no guarantee of future results. R 8.16% 10.00% 5.60% 5.49% 5.49% 3.83% 2.88% 2.68% 1.78% 0.00% ‐0.27% One Month Three Months YTD 1‐Year 3‐Years* Inception** ‐2.62% ‐7.70% ‐7.97% ‐10.00% *  3‐Year and Inceptions return numbers have been annualized. QVP S&P 500 Net Difference ** Inception of portfolio was May, 2005 while at Bear Stearns. 1/15/2010