
Recommended
Recommended
More Related Content
What's hot
What's hot (12)
Similar to Global DronesMarket Forecast (2014-2024) DronesMarketIndustry
Similar to Global DronesMarket Forecast (2014-2024) DronesMarketIndustry (20)
More from stella thomson
More from stella thomson (16)
Recently uploaded
Recently uploaded (20)
Global DronesMarket Forecast (2014-2024) DronesMarketIndustry
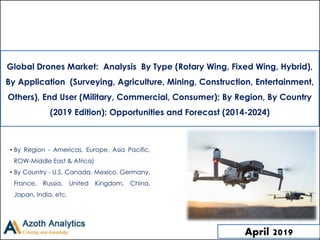
- 1. (c) AZOTH Analytics • By Region - Americas, Europe, Asia Pacific, ROW-Middle East & Africa) • By Country - U.S, Canada, Mexico, Germany, France, Russia, United Kingdom, China, Japan, India, etc. April 2019 Global Drones Market: Analysis By Type (Rotary Wing, Fixed Wing, Hybrid), By Application (Surveying, Agriculture, Mining, Construction, Entertainment, Others), End User (Military, Commercial, Consumer); By Region, By Country (2019 Edition): Opportunities and Forecast (2014-2024)
- 2. (c) AZOTH Analytics Scope of the Report – Drones Market 2014 2015 2016 2017 2018 2019 2020 2021 2022 2023 2024 Global Market (By Value) Billion USD By Product Type, By Value Rotoring Wing Drones Fixed Wing Drones Hybrid Drones By End User Type, By Value Military & Defence Commercial Consumer By Application, By Value Agriculture Construction Survey Mining Entertainment Others Historical Forecast 2
- 3. (c) AZOTH Analytics Scope of the Report – Drones Market 2014 2015 2016 2017 2018 2019 2020 2021 2022 2023 2024 Regional By Product Type, By Value Rotoring Wing Drones Fixed Wing Drones Hybrid Drones By End User Type, By Value Rotoring Wing Drones Military & Defence Commercial Consumer By Application, By Value Agriculture Construction Survey Mining Entertainment Others Historical Forecast 3
- 4. (c) AZOTH Analytics Scope of the Report – Drones Market er 2014 2015 2016 2017 2018 2019 2020 2021 2022 2023 2024 Country By Product Type, By Value Rotoring Wing Drones Fixed Wing Drones Hybrid Drones By End User Type, By Value Rotoring Wing Drones Military & Defence Commercial Consumer By Company Lockheed Martin, AeroVironment, Krossblade Aerospace System, SZ DJI Tech. Co. Ltd, Parrot SA, YUNEEC International, Northrop Grumman Corp., Autel Robotics, Insitu Inc., Aeryon Labs, & Delair. By Region Americas, Europe, APAC, and ROW. By Country US, Canada, UK, Russia, France,Australia, China, India. Historical Forecast 4
- 5. (c) AZOTH Analytics Table of Content S.No Particulars Page No. 1. Research Methodology 29 2. Executive Summary 30 3. Strategic Recommendation 31 3.1 Concentration on Product and Market development strategies. 32 3.2 Software synchronized control strategy 33 4. Product Overview 34 5. Global Drones Market : Growth and Forecast 39 5.1 Global Drones Market: Growth & Forecast, By Value 40 5.2 Global Drones Market - By Product Type 43 5.3 Global Drones Market, By Product Type Market Share 46 5.4 Global Drones Market - By End user: Overview 47 5.4.1 Global Drones Market, By End User, Military & Defence Drones, By Value, 2014-2024 48 5.4.2 Global Drones Market, By End User, Commercial Drones, By Value, 2014-2024 49 5.4.3 Global Drones Market, By End User, Consumer Drones, By Value, 2014-2024 50 5.4.4 Global Drones Market, By End User, Market Share 51 5
- 6. (c) AZOTH Analytics Table of Content S. No Particulars Page No. 5.5 Global Drones Market - By Application 52 5.5.1 Global Drones Market: By Application, By Value, 2014-2018 53 5.5.2 Global Drones Market: By Application, By Value, 2019-2024 55 5.6 Global Drones Market - By Regional Analysis 57 5.6.1 Global Drones Market Share, By Region, 2018 (%) 58 5.6.2 Global Drones Market Share, By Region, 2024 (%) 59 6. Americas Drones Market 60 6.1 Americas Drones Market Size, By Value, 2014-2024 61 6.2 Americas Drones Market: By Product type, By Value, 2014-2024 62 6.2.1 Market Attractiveness of Americas Drones Market- By Product type 64 6.2.2 Americas Drones Market, By Product Type Market Share 65 6.3 Americas Drones Market, By End User 66 6
- 7. (c) AZOTH Analytics Table of Content S. No Particulars Page No. 6.3.1 Americas Drones Market: By End User, Military & Defence, By Value, 2014-2024 67 6.3.2 Americas Drones Market: By End User, Commercial Drones, By Value, 2014-2024 67 6.3.3 Americas Drones Market, By End User, Consumer Drones, By Value, 2014-2024 68 6.3.4 Market Attractiveness of Americas Drones Market - By End User (Year- 2024) 69 6.3.5 Americas Drones Market, By End User, Market Share 70 6.4 Americas Drones Market, By Application 71 6.4.1 Americas Drones Market: By Application, By Value, 2014-2018 71 6.4.2 Market Attractiveness of Americas Drones Market- By Application 72 6.4.3 Americas Drones Market: By Application, By Value, 2019-2024 73 6.4.4 Americas Drones Market, By Application, Market Share 74 7. United States Drones Market : 75 7.1 United States Drones Market: By Value 76 7
- 8. (c) AZOTH Analytics Table of Content S. No Particulars Page No. 7.2 United States Drones Market Size, By Value, 2014-2024 77 7.3 United States Drones Market: By Product type, By Value, 2014-2024 78 7.4 Market Attractiveness of United States Drones Market- By Product type 79 7.5 United States Drones Market, By Product Type Market Share 80 7.6 United States Drones Market: By End User, By Value, 2014-2024 81 7.7 United States Drones Market, By End User, Market Share 82 7.8 United States Economic & Industrial Statistics 83 8. Canada Drones market 84 8.1 Canada Drones Market Size, By Value, 2014-2024 85 8.2 Canada Drones Market: By Product type, By Value, 2014-2024 86 8.3 Canada Drones Market, Regulations 87 8.4 Market Attractiveness of Canada Drones Market- By Product type 88 8.5 Canada Drones Market, By Product Type Market Share 89 8
- 9. (c) AZOTH Analytics Table of Content S. No Particulars Page No. 8.6 Canada Drones Market: By End User, By Value, 2014-2024 90 8.7 Canada Drones Market, By End User, Market Share 91 9. Rest of Americas Drones Market: By Value 92 9.1 Rest of America Drones Market Size, By Value, 2014-2024 93 9.2 Rest of Americas Drones Market: By Product type, By Value, 2014-2024 94 9.3 Rest of Americas Drones Market: By End User, By Value, 2014-2024 95 10. Europe Drones Market 96 10.1 Europe Drones Market Size, By Value, 2014-2024 97 10.2 Europe Drones Market: By Product type, 98 10.2.1 Europe Drones Market: By Product type, By Value, 2014-2024 98 10.2.2 Market Attractiveness of Europe Drones Market- By Product type 100 10.2.3 Europe Drones Market, By Product Type Market Share 101 9
- 10. (c) AZOTH Analytics Table of Content S. No Particulars Page No. 10.3 Europe Drones Market, End User 102 10.3.1 Europe Drones Market: By End User, Military & Defence Drones, By Value, 2014-2024 102 10.3.2 Europe Drones Market: By End User, Commercial Drones, By Value, 2014-2024 103 10.3.3 Europe Drones Market, By End User, Consumer Drones, By Value, 2014-2024 104 10.3.4 Market Attractiveness of Europe Drones Market - By End User (Year- 2024) 105 10.3.5 Europe Drones Market, By End User, Market Share 106 10.4 Europe Drones Market, By Application 107 10.4.1 Europe Drones Market: By Application, By Value, 2014-2018 107 10.4.2 Market Attractiveness of Europe Drones Market- By Application 108 10.4.3 Europe Drones Market: By Application, By Value, 2019-2024 109 10.4.4 Europe Drones Market, By Application, Market Share 110 10.4.5 Europe Economic & Industrial Statistics 111 10
- 11. (c) AZOTH Analytics Table of Content S. No Particulars Page No. 11. France Drones Market 113 11.1 France Drones Market Size, By Value, 2014-2024 114 11.2 France Drones Market: By Product type, By Value, 2014-2024 115 11.3 Market Attractiveness of France Drones Market- By Product type 116 11.4 France Drones Market, By Product Type Market Share 117 11.5 France Drones Market: By End User, By Value, 2014-2024 118 11.6 France Drones Market, By End User, Market Share 119 11.7 France Economic & Industrial Statistics 120 12. Russia Drones Market: 121 12.1 Russia Drones Market Size, By Value, 2014-2024 122 12.2 Russia Drones Market, Drones in Country 123 12.3 Russia Drones Market: By Product type, By Value, 2014-2024 124 11
- 12. (c) AZOTH Analytics Table of Content S. No Particulars Page No. 12.4 Market Attractiveness of Russia Drones Market- By Product type 125 12.5 Russia Drones Market, By Product Type Market Share 126 12.6 Russia Drones Market: By End User, By Value, 2014-2024 127 12.7 Russia Drones Market, By End User, Market Share 128 13. United Kingdom Drones Market 129 13.1 United Kingdom Drones Market Size, By Value, 2014-2024 130 13.2 United Kingdom Drones Market: By Product type, By Value, 2014-2024 131 13.3 United Kingdom Drones Market, Regulations 132 13.4 Market Attractiveness of United Kingdom Drones Market- By Product type 133 13.5 United Kingdom Drones Market, By Product Type Market Share 134 13.6 United Kingdom Drones Market: By End User, By Value, 2014-2024 135 13.7 United Kingdom Drones Market, By End User, Market Share 136 13.8 United Kingdom Economic & Industrial Statistics 137 12
- 13. (c) AZOTH Analytics Table of Content S. No Particulars Page No. 14. Rest of Europe Drones Market 138 14.1 Rest of Europe Drones Market Size, By Value, 2014-2024 139 14.2 Rest of Europe Drones Market: By Product type, By Value, 2014-2024 140 14.3 Rest of Europe Drones Market: By End User, By Value, 2014-2024 141 15. Asia Pacific Drones Market : 142 15.1 Asia Pacific Drones Market Size, By Value, 2014-2024 143 15.2 Asia Pacific Drones Market, By Product Type 144 15.2.1 Asia Pacific Drones Market: By Product type, By Value, 2014-2024 144 15.2.2 Market Attractiveness of Asia Pacific Drones Market- By Product type 146 15.2.3 Asia Pacific Drones Market, By Product Type Market Share 147 15.3 Asia Pacific Drones Market, By End User 149 15.3.1 Asia Pacific Drones Market: By End User, Military & Defence Drones By Value, 2014-2024 149 13
- 14. (c) AZOTH Analytics Table of Content S. No Particulars Page No. 15.3.2 Asia Pacific Drones Market, By End User, Commercial Drones 150 15.3.3 Asia Pacific Drones Market, By End User, Consumer Drones 151 15.3.4 Market Attractiveness of Asia Pacific Drones Market- By End User 152 15.3.5 Asia Pacific Drones Market, By End User, Market Share 153 15.4 Asia Pacific Drones Market, By Application 154 15.4.1 Asia Pacific Drones Market: By Application, By Value (USD Billion), 2014-2018 154 15.4.2 Market Attractiveness of Asia Pacific Drones Market- By Application 155 15.4.3 Asia Pacific Drones Market: By Application, By Value (USD Billion), 2019-2024 156 15.4.4 Asia Pacific Drones Market, By Application, Market Share 157 15.4.5 APAC Economic & Industrial Statistics 158 14
- 15. (c) AZOTH Analytics Table of Content S. No Particulars Page No. 16. China Drones Market 159 16.1 China Drones Market Size, By Value, 2014-2024 160 16.2 China Drones Market: By Product type, By Value, 2014-2024 161 16.3 Market Attractiveness of China Drones Market- By Product type 163 16.4 China Drones Market, By Product Type Market Share 164 16.5 China Drones Market: By End User, By Value, 2014-2024 165 16.6 China Drones Market, By End User, Market Share 166 16.7 China Economic & Industrial Statistics 167 17. Australia Drones Market 168 17.1 Australia Drones Market Size, By Value, 2014-2024 169 17.2 Australia Drones Market: By Product type, By Value, 2014-2024 170 17.3 Market Attractiveness of Australia Drones Market- By Product type 171 17.4 Australia Drones Market, By Product Type Market Share 172 17.5 Australia Drones Market: By End User, By Value, 2014-2024 173 17.6 Australia Drones Market, By End User, Market Share 174 15
- 16. (c) AZOTH Analytics Table of Content S. No Particulars Page No. 18. India Drones Market: 175 18.1 India Drones Market Size, By Value, 2014-2024 176 18.2 India Drones Market: By Product type, By Value, 2014-2024 177 18.3 Market Attractiveness of India Drones Market- By Product type 179 18.4 India Drones Market, By Product Type Market Share 180 18.5 India Drones Market: By End User, By Value, 2014-2024 181 18.6 India Drones Market, By End User, Market Share 182 18.7 India Economic & Industrial Statistics 183 19. Rest of Asia Pacific Market: 184 19.1 Rest of Asia Pacific Drones Market Size, By Value, 2014-2024 185 19.2 Rest of Asia Pacific Drones Market: By Product type, By Value, 2014-2024 186 19.3 Rest of Asia Pacific Drones Market: By End User, By Value, 2014-2024 187 16
- 17. (c) AZOTH Analytics Table of Content S. No Particulars Page No. 20. Rest of the World Drones Market 188 20.1 Rest of the World Drones Market Size, By Value, 2014-2024 189 20.2 Rest of the world Drones Market: By Product type, By Value, 2014-2024 190 20.3 Market Attractiveness of Rest of The World Drones Market- By Product type 191 20.4 Rest of The World Drones Market, By Product Type Market Share 192 20.5 Rest of the World Drones Market: By End User, By Value, 2014-2024 193 20.6 Rest of The World Drones Market, UAE Military Drones 196 20.7 Market Attractiveness of Rest of the World Drones Market- By End User 196 20.8 Rest of the World Drones Market, By End User, Market Share 197 20.9 Rest of the World Drones Market: By Application, By Value (USD Billion), 2014-2018 198 20.10 Market Attractiveness of Rest of the World Drones Market- By Application 199 20.11 Rest of the World Drones Market: By Application, By Value (USD Billion), 2019-2024 200 20.12 Rest of the World Drones Market, By Application, Market Share 201 17
- 18. (c) AZOTH Analytics Table of Content S. No Particulars Page No. 21. Market Dynamics 202 21.1 Market Drivers 203 21.2 Market Challenges 208 21.3 Market Trends 212 22. Competitive Landscape 216 22.2 Porter’s Five Force Analysis 217 22.3 SWOT Analysis 219 23. Company Profiling 221 23.1 AeroVironment 222 23.2 Krossblade Aerospace System 225 23.3 SZ DJI Technology Co. Ltd. 226 23.4 Lockheed Martin Corporation 227 23.5 Parrot SA 230 18
- 19. (c) AZOTH Analytics Table of Content S. No Particulars Page No. 23.6 YUNEEC International 231 23.7 Northrop Grumman Corporation 232 23.8 Autel Robotics 235 23.9 Insitu Inc. 236 23.10 Aeryon Labs. 237 23.11 Delair 238 24. About Us. 239 19
- 20. (c) AZOTH Analytics List of Figures Figure No. Figure Title Page No. Figure 1: Global Drones Market Size, By Value, 2014-2018 (USD Billion) 40 Figure 2: Global Drones Market Size, By Value, 2019-2024 (USD Billion) 41 Figure 3: Global Drones Market, Growth Rate, 2014-2024F ( In %) 42 Figure 4: Global Drones Market: By Product type, By Value, 2014-2024 (USD Billion) 44 Figure 5: Segmental Share according to Product Type, 2018 (%) 46 Figure 6: Segmental Share according to Product Type, 2024E (%) 46 Figure 7: Global Drones Market: By End User, By Value, 2014-2024 (USD Billion) 48 Figure 8: Global Drones Market: By End User, By Value, 2014-2024 (USD Billion) 49 Figure 9: Global Drones Market: By End User, By Value, 2014-2024 (USD Billion) 50 Figure 10: Market Share by End User, 2018 (%) 51 Figure 11: Market Share by End User, 2024 (%) 51 Figure 12: Global Drones Market: By Application, By Value (USD Billion), 2014-2018 53 Figure 13: Global Drones Market: By Application, By Value (USD Billion), 2019-2024 55 Figure 14: Market Share according to Sales Distribution, 2018 (%) 56 Figure 15: Market Share according to Sales Distribution, 2024E (%) 56 Figure 16: Global Drones Market Share, By Region, 2018 (%) 58 Figure 17: Global Drones Market Share, By Region, 2024 (%) 59 Figure 18: Americas Drones Market Size, By Value, 2014-2024 (USD Billion) 61 Figure 19: Americas Drones Market: By Product type, By Value, 2014-2024 (USD Billion) 62 Figure 20: Market Attractiveness Chart of Americas Drones Market - By Product Type (Year- 2024) 64 20
- 21. (c) AZOTH Analytics List of Figures Figure No. Figure Title Page No. Figure 21: Segmental Share according to Product Type, 2018 (%) 65 Figure 22: Segmental Share according to Product Type, 2024E (%) 65 Figure 23: Americas Drones Market: By End User, By Value, 2014-2024 (USD Billion) 66 Figure 24: Americas Drones Market: By End User, By Value, 2014-2024 (USD Billion) 67 Figure 25: Americas Drones Market: By End User, By Value, 2014-2024 (USD Billions) 68 Figure 26: Market Attractiveness Chart of Americas Drones Market - By End User (Year- 2024) 69 Figure 27: Market Share by End User, 2018 (%) 70 Figure 28: Market Share by End User, 2024 (%) 70 Figure 29: Americas Drones Market: By Application, By Value (USD Billion), 2014-2018 71 Figure 30: Market Attractiveness Chart of Americas Drones Market - By Application (Year- 2024) 72 Figure 31: Americas Drones Market: By Application, By Value (USD Billion), 2019-2024 73 Figure 32: Market Share according to Sales Distribution, 2018 (%) 74 Figure 33: Market Share according to Sales Distribution, 2024E (%) 74 Figure 34: United States Drones Market Size, By Value, 2014-2024 (USD Billion) 77 Figure 35: United States Drones Market: By Product type, By Value, 2014-2024 (USD Billion) 78 Figure 36: Market Attractiveness Chart of United States Drones Market - By Product Type (Year- 2024) 79 Figure 37: Segmental Share according to Product Type, 2018 (%) 80 Figure 38: Segmental Share according to Product Type, 2024E (%) 80 Figure 39: United States Drones Market: By End User, By Value, 2014-2024 (USD Billion) 81 Figure 40: Market Share by End User, 2018 (%) 82 21
- 22. (c) AZOTH Analytics List of Figures Figure No. Figure Title Page No. Figure 41: Market Share by End User, 2024 (%) 82 Figure 42: United States Average Industrial Index, 2013-2017 83 Figure 43: United States Gross Domestic Product Growth Rate (%) 83 Figure 44: Canada Drones Market Size, By Value, 2014-2024 (USD Billion) 85 Figure 45: Canada Drones Market: By Product type, By Value, 2014-2024 (USD Billion) 86 Figure 46: Market Attractiveness Chart of Canada Drones Market - By Product Type (Year- 2024) 88 Figure 47: Segmental Share according to Product Type, 2018 (%) 89 Figure 48: Segmental Share according to Product Type, 2024E (%) 89 Figure 49: Canada Drones Market: By End User, By Value, 2014-2024 (USD Billion) 90 Figure 50: Market Share by End User, 2018 (%) 91 Figure 51: Market Share by End User, 2024 (%) 91 Figure 52: Rest of America Drones Market Size, By Value, 2014-2024 (USD Billion) 93 Figure 53: Rest of Americas Drones Market: By Product type, By Value, 2014-2024 (USD Billion) 94 Figure 54: Rest of Americas Drones Market: By End User, By Value, 2014-2024 (USD Billion) 95 Figure 55: Europe Drones Market Size, By Value, 2014-2024 (USD Billion) 97 Figure 56: Europe Drones Market: By Product type, By Value, 2014-2024 (USD Billion) 98 Figure 57: Market Attractiveness Chart of Europe Drones Market - By Product Type (Year 2019-2024) 100 Figure 58: Segmental Share according to Product Type, 2018 (%) 101 Figure 59: Segmental Share according to Product Type, 2024E (%) 101 Figure 60: Europe Drones Market: By End User, By Value, 2014-2024 (USD Billion) 102 22
- 23. (c) AZOTH Analytics List of Figures Figure No. Figure Title Page No. Figure 61: Europe Drones Market: By End User, By Value, 2014-2024 (USD Billion) 103 Figure 62: Europe Drones Market: By End User, By Value, 2014-2024 (USD Billions) 104 Figure 63: Market Attractiveness Chart of Europe Drones Market - By End User (Year- 2024) 105 Figure 64: Market Share by End User, 2018 (%) 106 Figure 65: Market Share by End User, 2024 (%) 106 Figure 66: Europe Drones Market: By Application, By Value (USD Billion), 2014-2018 107 Figure 67: Market Attractiveness Chart of Europe Drones Market - By Application (Year- 2024) 108 Figure 68: Europe Drones Market: By Application, By Value (USD Billion), 2019-2024 109 Figure 69: Market Share according to Sales Distribution, 2018 (%) 110 Figure 70: Market Share according to Sales Distribution, 2024E (%) 110 Figure 71: Europe Gross Domestic Product Growth Rate (%), 2013-2017 111 Figure 72: France Drones Market Size, By Value, 2014-2024 (USD Billion) 114 Figure 73: France Drones Market: By Product type, By Value, 2014-2024 (USD Billion) 115 Figure 74: Market Attractiveness Chart of France Drones Market - By Product Type (Year- 2024) 116 Figure 75: Segmental Share according to Product Type, 2018 (%) 117 Figure 76: Segmental Share according to Product Type, 2024E (%) 117 Figure 77: France Drones Market: By End User, By Value, 2014-2024 (USD Billion) 118 Figure 78: Market Share by End User, 2018 (%) 119 Figure 79: Market Share by End User, 2024 (%) 119 Figure 80: France Gross Domestic Product Growth Rate (%) 120 23
- 24. (c) AZOTH Analytics List of Figures Figure No. Figure Title Page No. Figure 81: France Manufacturing sector growth data (In Percentage), 2013-2017 120 Figure 82: Russia Drones Market Size, By Value, 2014-2024 (USD Billion) 122 Figure 83: Russia Drones Market: By Product type, By Value, 2014-2024 (USD Billion) 124 Figure 84: Market Attractiveness Chart of Russia Drones Market - By Product Type (Year- 2024) 125 Figure 85: Segmental Share according to Product Type, 2018 (%) 126 Figure 86: Segmental Share according to Product Type, 2024E (%) 126 Figure 87: Russia Drones Market: By End User, By Value, 2014-2024 (USD Billion) 127 Figure 88: Market Share by End User, 2018 (%) 128 Figure 89: Market Share by End User, 2024 (%) 128 Figure 90: United Kingdom Drones Market Size, By Value, 2014-2024 (USD Billion) 130 Figure 91: United Kingdom Drones Market: By Product type, By Value, 2014-2024 (USD Billion) 131 Figure 92: Market Attractiveness Chart of United Kingdom Drones Market - By Product Type (Year- 2024) 133 Figure 93: Segmental Share according to Product Type, 2018 (%) 134 Figure 94: Segmental Share according to Product Type, 2024E (%) 134 Figure 95: United Kingdom Drones Market: By End User, By Value, 2014-2024 (USD Billion) 135 Figure 96: Market Share by End User, 2018 (%) 136 Figure 97: Market Share by End User, 2024 (%) 136 Figure 98: United Kingdom Manufacturing sector growth data (In %), 2013-2017 137 Figure 99: United Kingdom Gross Domestic Product Growth Rate (%) 137 Figure 100: Rest of Europe Drones Market Size, By Value, 2014-2024 (USD Billion) 139 24
- 25. (c) AZOTH Analytics List of Figures Figure No. Figure Title Page No. Figure 101: Rest of Europe Drones Market: By Product type, By Value, 2014-2024 (USD Billion) 140 Figure 102: Rest of Europe Drones Market: By End User, By Value, 2014-2024 (USD Billion) 141 Figure 103: Asia Pacific Drones Market Size, By Value, 2014-2024 (USD Billion) 143 Figure 104: Asia Pacific Drones Market: By Product type, By Value, 2014-2024 (USD Billion) 144 Figure 105: Market Attractiveness Chart of Asia Pacific Drones Market - By Product Type (Year- 2024) 146 Figure 106: Segmental Share according to Product Type, 2018 (%) 147 Figure 107: Segmental Share according to Product Type, 2024E (%) 147 Figure 108: Asia Pacific Drones Market: By End User, By Value, 2014-2024 (USD Billion) 149 Figure 109: Asia Pacific Drones Market: By End User, By Value, 2014-2024 (USD Billion) 150 Figure 110: Asia Pacific Drones Market: By End User, By Value, 2014-2024 (USD Billions) 151 Figure 111: Market Attractiveness Chart of Asia Pacific Drones Market - By End User (Year- 2024) 152 Figure 112: Market Share by End User, 2018 (%) 153 Figure 113: Market Share by End User, 2024 (%) 153 Figure 114: Asia Pacific Drones Market: By Application, By Value (USD Billion), 2014-2018 154 Figure 115: Market Attractiveness Chart of Asia Pacific Drones Market - By Application (Year- 2024) 155 Figure 116: Asia Pacific Drones Market: By Application, By Value (USD Billion), 2019-2024 156 Figure 117: Market Share according to Sales Distribution, 2018 (%) 157 Figure 118: Market Share according to Sales Distribution, 2024E (%) 157 Figure 119: APAC Gross Domestic Product Growth Rate (%), 2013-2017 158 Figure 120: China Drones Market Size, By Value, 2014-2024 (USD Billion) 160 25
- 26. (c) AZOTH Analytics List of Figures Figure No. Figure Title Page No. Figure 121: China Drones Market: By Product type, By Value, 2014-2024 (USD Billion) 161 Figure 122: Market Attractiveness Chart of China Drones Market - By Product Type (Year- 2024) 163 Figure 123: Segmental Share according to Product Type, 2018 (%) 164 Figure 124: Segmental Share according to Product Type, 2024E (%) 164 Figure 125: China Drones Market: By End User, By Value, 2014-2024 (USD Billion) 165 Figure 126: Market Share by End User, 2018 (%) 166 Figure 127: Market Share by End User, 2024 (%) 166 Figure 128: China’s Gross Domestic Product Growth Rate (%) 167 Figure 129: China Industrial Production growth data (In Percentage), 2013-2017 167 Figure 130: Australia Drones Market Size, By Value, 2014-2024 (USD Billion) 169 Figure 131: Australia Drones Market: By Product type, By Value, 2014-2024 (USD Billion) 170 Figure 132: Market Attractiveness Chart of Australia Drones Market - By Product Type (Year- 2024) 171 Figure 133: Segmental Share according to Product Type, 2018 (%) 172 Figure 134: Segmental Share according to Product Type, 2024E (%) 172 Figure 135: Australia Drones Market: By End User, By Value, 2014-2024 (USD Billion) 173 Figure 136: Market Share by End User, 2018 (%) 174 Figure 137: Market Share by End User, 2024 (%) 174 Figure 138: India Drones Market Size, By Value, 2014-2024 (USD Billion) 176 Figure 139: India Drones Market: By Product type, By Value, 2014-2024 (USD Billion) 177 Figure 140: Market Attractiveness Chart of India Drones Market - By Product Type (Year- 2024) 179 26
- 27. (c) AZOTH Analytics List of Figures Figure No. Figure Title Page No. Figure 141: Segmental Share according to Product Type, 2018 (%) 180 Figure 142: Segmental Share according to Product Type, 2024E (%) 180 Figure 143: India Drones Market: By End User, By Value, 2014-2024 (USD Billion) 181 Figure 144: Market Share by End User, 2018 (%) 182 Figure 145: Market Share by End User, 2024 (%) 182 Figure 146: India’s Gross Domestic Product Growth Rate (%) 183 Figure 147: India Industrial Production (In %), 2013-2017 183 Figure 148: Rest of Asia Pacific Drones Market Size, By Value, 2014-2024 (USD Billion) 185 Figure 149: Rest of Asia Pacific Drones Market: By Product type, By Value, 2014-2024 (USD Billion) 186 Figure 150: Rest of Asia Pacific Drones Market: By End User, By Value, 2014-2024 (USD Billion) 187 Figure 151: Rest of the World Drones Market Size, By Value, 2014-2024 (USD Billion) 189 Figure 152: Rest of the world Drones Market: By Product type, By Value, 2014-2024 (USD Billion) 190 Figure 153: Market Attractiveness Chart of Rest of The World Drones Market - By Product Type (Year- 191 Figure 154: Segmental Share according to Product Type, 2018 (%) 192 Figure 155: Segmental Share according to Product Type, 2024E (%) 192 Figure 156: Rest of the World Drones Market: By End User, By Value, 2014-2024 (USD Billion) 193 Figure 157: Market Attractiveness Chart of Rest of the World Drones Market - By End User (Year- 2024) 196 Figure 158: Market Share by End User, 2018 (%) 197 Figure 159: Market Share by End User, 2024 (%) 197 Figure 160: Rest of the World Drones Market: By Application, By Value (USD Billion), 2014-2018 198 27
- 28. (c) AZOTH Analytics List of Figures Figure No. Figure Title Page No. Figure 161: Market Attractiveness Chart of Americas Drones Market - By Application (Year- 2024) 199 Figure 162: Rest of the World Drones Market: By Application, By Value (USD Billion), 2019-2024 200 Figure 163: Market Share according to Sales Distribution, 2018 (%) 201 Figure 164: Market Share according to Sales Distribution, 2024E (%) 201 Figure 165: AeroVironment, Annual Sales Revenue, 2013-2018 (USD Million) 223 Figure 166: AeroVironment, Annual Net Income, 2013-2018 (USD Million) 223 Figure 167: AeroVironment, Sales Revenue, By Geographic Segment (%), FY2018 224 Figure 168: AeroVironment, Sales Revenue, By Geographic Segment (%), FY2013-2018 224 Figure 169: Lockheed Martin, Annual Sales Revenue, 2014-2018 (USD Million) 228 Figure 170: Lockheed Martin, Annual Net Profit, 2014-2018 (USD Million) 228 Figure 171: Lockheed Martin, Sales Revenue, By Customer Segment (%), 2018 229 Figure 172: Lockheed Martin, Sales Revenue, By Business Segment, (%), 2018 229 Figure 173: Northrop Grumman, Annual Sales Revenue,2014-2018 (USD Million) 233 Figure 174: Northrop Grumman, Annual Net Profit,2014-2018 (USD Million) 233 Figure 175: Northrop Grumman, Sales Revenue, By Customer Segment (%), 2018 234 Figure 176: Northrop Grumman, Sales Revenue, By Business Segment, (%), 2018 234 28
- 29. (c) AZOTH Analytics For our study on Global Drones Market, we have conducted comprehensive secondary research followed by an extensive primary research. In the process of secondary research, we have scrutinized industry documents, accessed from open sources, premium paid databases and our internal knowledge base. In the process of primary research, we have interviewed various industry experts across the value chain of the Drones industry. Market size of the actual period (2014-2018) has been evaluated on the basis of growth trends of the industry in the last five years, and confirming the findings through primary research. Annual reports of the companies are scanned to further validate the market size and to estimate the size of various other applications. Market sizing and growth in the forecast period (2019-2024) is estimated through revenue mapping, growth of new advance equipment and technology and historical growth pattern of the industry. All the relevant data points/ statistics in the forecast period are validated through relevant and reliable primary sources. Report Focus: Global Drones Market. -By Drones Type : (Rotary Wings Drones, Fixed Wings Drones & Hybrid Drones.); -By Application : (Surveying, Agriculture, Mining, Construction, Entertainment, Others) •-By End User: (Military, Commercial, & Consumer) •-By Region (Americas, Europe, Asia Pacific, ROW-Middle East & Africa) •-By Country - U.S, Canada, France, Russia, United Kingdom, China, Australia, India, etc. Companies Contacted: Northrop Grumman, Yuneec Corp. Research Methodology 29
- 30. (c) AZOTH Analytics Global Drones Market: Growth & Forecast, By Value Source: Azoth Analytics Estimates Xx Xx Xx Xx Xx Xx Xx Growth in the global Drones market is advanced due to rapid demand from all the industrial sector all over the globe for the services provided by the drones. Figure 1: Global Drones Market Size, By Value, 2014-2018 (USD Billion) CAGR 2014-2018 xx% 2014 2015 2016 2017 2018 30
- 31. (c) AZOTH Analytics Source: Azoth Analytics Estimates Xx Xx Xx Xx Xx Xx Launch of hybrid drones and increasing investment in research and development of technological advance drones is anticipate to back the growth during forecast period. Figure 2: Global Drones Market Size, By Value, 2019-2024 (USD Billion) CAGR 2019-2024 xx% Global Drones Market: Growth & Forecast, By Value 2019 2020 2021 2022 2023 2024 31
- 32. (c) AZOTH Analytics Source: Azoth Analytics Estimates Figure 4: Global Drones Market: By Product type, By Value, 2014-2024 (USD Billion) CAGR 2014-2018 Rotoring Wings Drones: xx% Fixed Wings Drones: xx% Hybrid Drones: xx% Global Drones Market, By Product Type 2014 2015 2016 2017 2018 2019 2020 2021 2022 2023 2024 Rotoring Wing xx xx xx xx xx xx xx xx xx xx xx Fixed Wings xx xx xx xx xx xx xx xx xx xx xx Hybrid xx xx xx xx xx xx xx xx xx xx xx 2014 2015 2016 2017 2018 2019 2020 2021 2022 2023 2024 Rotoring Wing Fixed Wings Hybrid CAGR 2019-2024 Rotoring Wings Drones: xx% Fixed Wings Drones: xx% Hybrid Drones: xx% 32
- 33. (c) AZOTH Analytics Source: Azoth Analytics Estimates Figure 7: Global Drones Market: By End User, By Value, 2014-2024 (USD Billion) Global Drones Market, By End User, Military & Defence Drones 2014 2015 2016 2017 2018 2019 2020 2021 2022 2023 2024 Military Drones xx xx xx xx xx xx xx xx xx xx xx Source: Azoth Analytics Estimates CAGR 2019-2024 Military Drones: xx% Xx Xx Xx Xx Xx 2014 2015 2016 2017 2018 2019 2020 2021 2022 2023 2024 CAGR 2014-2018 Military Drones: xx% 33
- 34. (c) AZOTH Analytics Source: Azoth Analytics Estimates Figure 12: Global Drones Market: By Application, By Value (USD Billion), 2014-2018 CAGR 2014-2018 Agriculture: xx% Construction: xx% Surveying: xx% Mining: xx% Entertainment: xx% Others: xx% Global Drones Market, By Application 2014 2015 2016 2017 2018 Agriculture xx xx xx xx xx Construction xx xx xx xx xx Surveying xx xx xx xx xx Mining xx xx xx xx xx Entertainment xx xx xx xx xx Others xx xx xx xx xx Source: Azoth Analytics Estimates 2014 2015 2016 2017 2018 Agriculture Construction Surveying Mining Entertainment Others 34
- 35. (c) AZOTH Analytics Source: Azoth Analytics Estimates Figure 13: Global Drones Market: By Application, By Value (USD Billion), 2019-2024 Global Drones Market, By Application Source: Azoth Analytics Estimates 2019 2020 2021 2022 2023 2024 Agriculture Construction Surveying Mining Entertainment Others 2019 2020 2021 2022 2023 2024 Agriculture xx xx xx xx xx xx Construction xx xx xx xx xx xx Surveying xx xx xx xx xx xx Mining xx xx xx xx xx xx Entertainment xx xx xx xx xx xx Others xx xx xx xx xx xx CAGR 2019-2024 Agriculture: xx% Construction: xx% Surveying: xx% Mining: xx% Entertainment: xx% Others: xx% 35
- 36. (c) AZOTH Analytics Figure 14: Market Share according to Sales Distribution, 2018 (%) Figure 15: Market Share according to Sales Distribution, 2024E (%) Global Drones Market, By Application, Market Share Agriculture Construction Surveying Mining Entertainment Others 36 Agriculture Construction Surveying Mining Entertainment Others
- 37. (c) AZOTH Analytics Americas Drones Market: By Value Source: Azoth Analytics Estimates CAGR 2014-2018 xx% Figure 18: Americas Drones Market Size, By Value, 2014-2024 (USD Billion) Americas is the largest market for the drones on the back of increasing commercial use of drones. 2014 2015 2016 2017 2018 2019 2020 2021 2022 2023 2024 CAGR 2019-2024 xx% Xx Xx Xx Xx Xx Xx 37
- 38. (c) AZOTH Analytics Source: Azoth Analytics Estimates Figure 19: Americas Drones Market: By Product type, By Value, 2014-2024 (USD Billion) Americas Drones Market, By Product Type 38 CAGR 2014-2018 Rotoring Wings Drones: xx% Fixed Wings Drones: xx% Hybrid Drones: xx% 2014 2015 2016 2017 2018 2019 2020 2021 2022 2023 2024 Rotoring Wing xx xx xx xx xx xx xx xx xx xx xx Fixed Wings xx xx xx xx xx xx xx xx xx xx xx Hybrid xx xx xx xx xx xx xx xx xx xx xx 2014 2015 2016 2017 2018 2019 2020 2021 2022 2023 2024 Rotoring Wing Fixed Wings Hybrid CAGR 2019-2024 Rotoring Wings Drones: xx% Fixed Wings Drones: xx% Hybrid Drones: xx%
- 39. (c) AZOTH Analytics Source: Azoth Analytics Estimates Figure 23: Americas Drones Market: By End User, By Value, 2014-2024 (USD Billion) Americas Drones Market, By End User, Military & Defence Drones Source: Azoth Analytics Estimates 39 2014 2015 2016 2017 2018 2019 2020 2021 2022 2023 2024 Military Drones xx xx xx xx xx xx xx xx xx xx xx CAGR 2019-2024 Military Drones: xx% Xx Xx Xx Xx Xx 2014 2015 2016 2017 2018 2019 2020 2021 2022 2023 2024 CAGR 2014-2018 Military Drones: xx%
- 40. (c) AZOTH Analytics Source: Azoth Analytics Estimates Figure 35: United States Drones Market: By Product type, By Value, 2014-2024 (USD Billion) United States Drones Market, By Product Type 40 CAGR 2014-2018 Rotoring Wings Drones: xx% Fixed Wings Drones: xx% Hybrid Drones: xx% 2014 2015 2016 2017 2018 2019 2020 2021 2022 2023 2024 Rotoring Wing xx xx xx xx xx xx xx xx xx xx xx Fixed Wings xx xx xx xx xx xx xx xx xx xx xx Hybrid xx xx xx xx xx xx xx xx xx xx xx 2014 2015 2016 2017 2018 2019 2020 2021 2022 2023 2024 Rotoring Wing Fixed Wings Hybrid CAGR 2019-2024 Rotoring Wings Drones: xx% Fixed Wings Drones: xx% Hybrid Drones: xx%
- 41. (c) AZOTH Analytics Market Attractiveness of United States Drones Market- By Product type 15.00% 15.50% 16.00% 16.50% 17.00% 17.50% 18.00% 0.00 5.00 10.00 15.00 20.00 CAGR(2019-2024) Market Size (USD Billion) in Year 2024 Rotoring Wings Drones Fixed Wings Drones Hybrid Drones Figure 36: Market Attractiveness Chart of United States Drones Market - By Product Type (Year- 2024) Xx Xx Xx Xx 41
- 42. (c) AZOTH Analytics Figure 37: Segmental Share according to Product Type, 2018 (%) Figure 38: Segmental Share according to Product Type, 2024E (%) United States Drones Market, By Product Type Market Share Rotoring Wings Drones Fixed Wing Drone Hybrid Drones 42 Rotoring Wings Drones Fixed Wing Drone Hybrid Drones
- 43. (c) AZOTH Analytics Source: Azoth Analytics Estimates Figure 39: United States Drones Market: By End User, By Value, 2014-2024 (USD Billion) CAGR 2014-2018 Military & Defence Drones: xx% Commercial Drones: xx% Consumer Drones : xx% United States Drones Market, By End User 2014 2015 2016 2017 2018 2019 2020 2021 2022 2023 2024 Military & Defence xx xx xx xx xx xx xx xx xx xx xx Commercial xx xx xx xx xx xx xx xx xx xx xx Consumer xx xx xx xx xx xx xx xx xx xx xx 2014 2015 2016 2017 2018 2019 2020 2021 2022 2023 2024 Military & Defence Commercial Consumer CAGR 2019-2024 Military & Defence Drones: xx% Commercial Drones: xx% Consumer Drones : xx% 43
- 44. (c) AZOTH Analytics Figure 40: Market Share by End User, 2018 (%) United States Drones Market, By End User, Market Share Figure 41: Market Share by End User, 2024 (%) Military & Defence Drones Commercial Drones Consumer Drones 44
- 45. (c) AZOTH Analytics About Azoth Analytics Pvt Ltd. Azoth Analytics (ISO 9001:2015) is a business research and analytics company that creates in-depth research reports and provides customized research solutions and consulting services. An ISO 9001:2015 certified company, Azoth Analytics adheres to international quality management standard and has strong commitment to a culture of continuous improvement. The business research and market analysis of Azoth Analytics helps organizations across different industry verticals solve their business problems. Strategic market sizing and data dredging techniques include secondary research, and primary research (interviews with management personnel and industry experts). Azoth Analytics provide syndicated and customized market research reports on different verticals including pharmaceutical and healthcare, oil and gas and power, chemicals, automotive, technology, FMCG, food & beverages and media sectors. 45