SlideShare a Scribd company logo
1 of 6
Download to read offline
PAGE 1
AN EARLY ASSESSMENT OF VACCINE UTILIZATION RATES
Executive Summary
On December 13, 2020 Pfizer began shipping its covid-19 vaccine. On December 20, the Moderna
vaccine began to be shipped. Initial product flows have been directed to individual states and other US
jurisdictions in proportion to each jurisdiction’s population and consistent with each jurisdiction’s
explicit plans. In the first three weeks of sustained flow, roughly twenty-million doses of vaccine were
distributed. Since January 6, an average of more than one million doses per day are being shipped.
As of Friday, January 8, California had vaccinated over 586,000 people and utilized roughly a quarter of
its available vaccine inventory. New York had consumed almost 39 percent of its inventory vaccinating
430,000. After three weeks of vaccine shipments, nationwide about thirty percent of available vaccines
have been consumed. That outcome has prompted some alarm that sluggish vaccination speed will
result in more disease and death and further delay economic recovery. The recent confirmation of a
more contagious variant of coronavirus contributes a further sense of urgency.
Do early variations in vaccination speed across jurisdictions tell us anything substantive about how to
increase vaccination speed? What, if anything, are higher speed jurisdictions doing that could be helpful
in other venues? Or have we mostly experienced the shake-out of processes typically associated with
large-scale start-ups, further complicated by the holiday season?
While limited in scope, this analytic snapshot finds no evidence that, to date, supply limitations have
constrained planned and targeted vaccinations. Differences in vaccination throughputs are mostly a
function of open and flexible vaccination demand criteria. In other words: the more arms you are
willing to jab, the more arms are likely to be jabbed. Variation in vaccination velocity (speed in a specific
direction) does reflect explicit choices and behaviors by individual jurisdictions and “consumer-facing”
vaccination providers. This early and provisional assessment also finds potential tension between
vaccination velocity versus vaccination speed. But this assessment does not conclude that current
priority allocations should be discontinued. Rather, a focused and flexible vaccination strategy is
recommended as the most effective path to faster vaccinations.
United States: Rolling seven-day average of vaccine doses administered daily
Collated and displayed by Our World in Data
PAGE 2
Patterns of Demand and Supply through January 6
Based on CDC data between December 13 and January 6 more than 17,250,000 doses of vaccine (Pfizer
and Moderna) had been delivered to US jurisdictions. Since these vaccines have been distributed, about
5.3 million individuals were reported to have received an initial vaccination by January 6. This generated
a national Vaccine Utilization Rate (VUR) of roughly 30 percent for this intensive start-up period.
During this same period jurisdictions have demonstrated considerable differences in VUR. This
analytical snapshot gives particular attention to:
• Tennessee: Vaccine Doses Delivered: 328,500, Vaccinations Completed: 166,389,
January 6 VUR: about 50 percent.
• Illinois: Vaccine Doses Delivered: 542,200, Vaccinations Completed: 189,660,
January 6 VUR: about 35 percent
• Texas: Vaccine Doses Delivered: 1,375,800, Vaccinations Completed: 489,003,
January 6 VUR: about 35 percent
Among states receiving more than 300,000 doses, Tennessee, Illinois, and Texas each have a
comparatively high VUR. States receiving more than 300,000 doses have had particular difficulty
exceeding a 25 percent Vaccine Utilization Rate. As is often the case, the more volume flowing, the more
friction in the channel(s).
From a supply chain perspective, vaccination is consumption. Consumption can be complicated by a
wide range of factors, but three classic impediments are:
1. Lack of sufficient supply capacity (or disruption of capacity)
2. Lack of sufficient distribution capacity (or disruption of distribution)
3. Lack of sufficient demand (or disruption of demand)
Current supplies of vaccine are limited. These are entirely new vaccines. Production capacity is still
being scaled to meet projected demand. In anticipation of limited supplies, allocation phases have been
established. The allocation priorities reflect ethical and epidemiological judgments intended to mitigate
morbidity and mortality and to facilitate ongoing healthcare and essential commercial activity. On
December 3, 2020, the Advisory Committee on Immunization Practices (ACIP) established two covid-19
vaccination targets for Phase 1a: 1) health care personnel and 2) residents of long-term care (LTC)
facilities. Each state, however, has independent authority to finalize and operationalize any such targets.
While most states have confirmed the priority ACIP gave health care personnel and LTC residents, some
state-specific twist or two or three is common. LTC facility staff has become a common addition.
Within the limits of available flow (averaging close to one million doses per day over the first three
weeks) each State and related jurisdictions received a number of doses proportional to its population.
The initial volume of vaccine deliveries was less than some states were expecting, but by the last week
in December volume and velocity expectations were largely calibrated to actual flow. Transportation of
supplies from Pfizer (Kalamazoo, Michigan) and Moderna (via Olive Branch, Mississippi) have achieved
schedules and volumes consistent with projections.
PAGE 3
As a result, while vaccine supply has been limited, it is equally limited for each receiving State. There is
no evidence that divergence in the timing or volume of vaccine supply has had any influence on the
divergence in Vaccine Utilization Rates between States. As of January 6, every state had at least 30
percent “excess inventory” on hand. Most states had at least 60 percent of inventories on hand.
Tennessee, Illinois, and Texas have pursued different distribution strategies that could have capacity
implications. Both Illinois and Tennessee are organized around a hub-and-spoke structure. Illinois
depends on ten hubs. Tennessee depends on 28 hubs (maybe just cross-docks). Texas has distributed its
allocated vaccinations directly to 1036 local vaccination venues. These are, obviously, three distinct
geographies and, perhaps, three very different sources of demand. During the first full week in January
there were reports in each state of smaller population counties and vaccination venues running out of
inventory (Tennessee example), even while significant inventories remain available to each state. Still,
official and media reports have not -- yet -- exposed significant variation in local ("last mile")
availability of vaccines among these three States. At least in these three cases, their different network
structures and distribution strategies appear to have a neutral impact on vaccination throughputs. The
inability to resupply smaller vaccination venues from available stocks does signal potential problems
with inventory management, demand signaling and/or transportation resources. But these do not seem
to have emerged from differences in distribution strategy or structure.
If supply and distribution are not significant sources of VUR variation, that leaves demand. Since mid-
December, vaccine consumption has been limited mostly to sub-populations that meet each State’s
allocation criteria. As of January 6, Tennessee, Illinois, and Texas – and most other jurisdictions – had
only been engaged in so-called Phase 1a vaccinations. The Illinois definition of 1a populations includes
both ACIP groups and LTC facility staff. Tennessee and Texas include these same groups and then add
other targets. Tennessee has added first responders and "adults who cannot live independently". Texas
has added, all "Texans over age 65 and people with medical conditions that put them at higher risk of
disease or death from covid-19." These are very different sources and sizes of demand. The broader the
allocation criteria, the easier to attract throughput for currently available doses.
Many epidemiologists have suggested over 250 million residents of the United States should be
vaccinated to suppress the pandemic. Surveys suggest that 170 to 200 million residents of the United
States are currently willing to be vaccinated. Three weeks after vaccines had begun shipping, 5.3 million
Americans had been vaccinated, even though roughly 20 million doses had been shipped. Consumption
is pulling slower than supply is pushing. Demand – while variable – is far from being fulfilled.
Tennessee, Illinois, and Texas have demonstrated higher than average Vaccine Utilization Rates. A major
element differentiating Vaccine Utilization Rates in these three States from jurisdictions with lower
VURs appears to be the size of the allocation pool being served and the demand-orientation of
vaccination planning and execution.
Three States Compared with other Jurisdictions
In mid-November the Kaiser Family Foundation assessed the vaccination plans of forty-seven states.
According to this analysis:
Every state plan highlights the following broad categories as being priority populations for Phase 1
efforts: health care workers, essential workers, and those at high risk (older people and those with
pre-disposing health risk factors). Most plans recognize (and CDC indicated in its guidance) that there
PAGE 4
will likely not be enough vaccines at first for all individuals identified in these Phase 1 priority groups.
Even so, plans show that some states are much further along in defining prioritization categories and
enumerating the number of people that fall into those categories. For example:
• Less than half (19 of 47, or 40%) of state plans reviewed include a numerical estimate of the
number of individuals in different priority populations; the majority of states report they are still
developing their data sources and methodology to calculate the number in their priority groups.
• Some states report already developing specific estimates of the numbers of health care workers
likely among the first individuals targeted for vaccination, while other states do not include these
estimates, or mention that they are working on developing methods to identify the numbers to be
targeted in this group.
State vaccination plans submitted to the Centers for Disease Control by Tennessee, Illinois, and Texas all
demonstrate significant prior awareness of potential demand for each phase of vaccination.
The amended Vaccination Plan developed by the Tennessee Department of Health does not specify the
size of Phase 1a target populations, but both the plan and easily available online resources demonstrate
that Tennessee has carefully sized each priority population consistent with Tennessee targets.
The updated Vaccination Plan developed by the Illinois Department of Public Health specifies numerical
estimates for each phase. The plan also references state investment in a sophisticated population-
focused, demand-oriented data tool for managing the rollout of vaccinations in Illinois.
The original draft Vaccination Plan for the Texas Department of State Health Services details specific
numbers for each Phase 1a (and subsequent) target populations per each state public health region,
please see the chart below. The Texas plan also outlines data sources and analytical methods that are
being used to more fully characterize the size and location of target populations.
Texas Department of State Health Services
PAGE 5
Principal Observations, Analysis, and Starting toward Strategic Synthesis
Lower volume jurisdictions should be able to move and consume lower volumes of supply more quickly.
This has not always happened, but through January 6 this has been reflected in those jurisdictions
showing the highest rates of vaccine consumption. Failure to effectively move and consume lower
volumes (e.g., less than 150,00 doses between December 13 and January 6) is cause for rigorous
strategic and operational examination and potential intervention.
Through January 6, supply capacity has not been a constraint on planned and targeted vaccine
consumption. All states had significant vaccine stocks on hand. Only three states had administered
more doses than they continued to have in inventory. Most states had in inventory almost double the
number of doses they had administered through January 6.
In three higher volume states with above-average consumption of doses—Tennessee, Illinois, and
Texas—it is noted that each of these states share a comparatively sophisticated attention to population
demand factors. Two of the three states have also significantly expanded their demand pools for initial
vaccinations.
Priority allocation is intended to maximize the life-saving potential of limited supplies. Hospital
healthcare workers are especially vulnerable and essential to saving the lives of those most seriously
affected by covid-19 and other health emergencies. The allocation priorities set out are appropriate to a
supply constrained context. There are both ethical and epidemiological benefits where allocation
targets can be confidently achieved in a timely way. But a variety of factors—including high demand for
acute health care—have limited the speed of consumption by health care providers. Some level of
vaccine hesitancy also exists. Prioritizing – and thereby limiting – vaccination to any narrow population
erects an impediment to increasing speed and total vaccination throughputs.
In any demand and supply network there can be tension between speed and velocity. Velocity is speed
in a specific direction. Speed downhill will be slower than the same distance uphill. Texas and
Tennessee have shown higher VURs at least in part because they have expanded their demand pools
by including much larger target populations in their initial allocation priorities. They have chosen
pathways that flexibly favor general speed over specific velocities.
Illinois has retained the narrow population pool originally recommended by ACIP, but Illinois has also
given priority to serving these target populations in locations (usually hospitals) where case counts are
most rapidly growing and hospitalizations most endanger ICU capacity. According to one Illinois official
interviewed for this report, “Demand [for vaccine] tends to reflect perceived risk. Perceived risk is
highest where disease is most obvious. So far we are focusing supply where perceived risk is pushing
demand.” This is also a population-oriented, demand-sensitive vaccination strategy.
It is also true that while Tennessee, Illinois, and Texas have achieved higher than average Vaccine
Utilization Rates, none have achieved a rate that will support their own public health objectives.
Strategic Assessment
The United States is currently shipping more than one million vaccine doses per day. According to CDC
reports, on January 7 the United States vaccinated 768,813 individuals. There is no evidence to suggest
lack of supply or ineffective distribution is substantially slowing planned and targeted vaccination
(consumption). There is evidence that full-speed vaccinations are being complicated and delayed by
efforts to restrict vaccinations to allocation priorities.
PAGE 6
Achieving the current allocation priorities will result in a more resilient health care system, preserve
essential commerce, and advance the wellness of the whole population. Priority can and should
continue to be given to those population groups most at risk and most essential. But in the current risk
context – especially given the highly contagious variant now spreading – these priorities should also be
calibrated to ensure a full-speed flow of available vaccines. As demonstrated by Tennessee and Texas,
opening vaccinations to demand beyond the tightest allocation priorities need not impede fulfilling
demand among the priority populations. Both can be advanced.
One way to conceive of accommodating allocation priorities with full-speed vaccinations is to “time-out”
consumption of doses. For short periods of time a set of doses can be reserved for designated priority
populations and delivered as conveniently as possible to that population. At the end of this short
period, the doses can be made available – preferably on a reservation-basis – to general population
vaccination venues. For example, in some jurisdictions where grocery workers have current allocation
priority, when a store has completed vaccinating all available workers and still has doses left, an
announcement has been made allowing customers to be vaccinated. Where there is excess demand for
these “pop-up doses”, vaccination staff have attempted to sequence recipients consistent with ACIP
and/or State priorities. Focused and flexible is the path to fast effective vaccinations.
In the current context, effective vaccinations involve fulfilling current demand in a manner that will
reinforce consumption of second doses, increase overall demand (reduce vaccine hesitancy), reduce
overall US morbidity and mortality, and maintain flows of essential resources. While increasing
vaccination speed is necessary, short-term spikes that do not meet these minimally effective
characteristics would be strategically counterproductive. There is also a need to reinforce public
understanding that given realistic vaccine volumes and effective vaccination practices, a phased
approach focused on priority populations while proactively facilitating others is the best way to reduce
shared vulnerabilities and ensure economic continuity.
Strategic Recommendation:
• Maintain current risk-based allocation priorities while explicitly and systematically articulating
policies to promote “consumer-facing” flexibility to increase the speed of consumption for
available vaccines.
• Offer methods and training to achieve consumer-facing flexibility to increase speed of
consumption.
• Establish explicit time-windows for consumption of vaccine inventories to achieve population
health and risk reduction objectives. Train, promote, monitor, measure, and manage as
necessary to ensure consumption time-windows are achieved.
• Develop methods, train, monitor, measure, and manage to facilitate intra-state movement of
vaccine inventories as a last-ditch effort to ensure consumption time-windows are achieved.
• Give positive national attention to “consumer friendly” vaccination procedures and, especially,
scheduling for friction-free, time-minimized vaccinations. (Super-charged scheduling software
may need to be the next big investment in this process).
This analytic snapshot was quickly developed by Philip J. Palin in response to a special
request. It was completed on Sunday, January 10, 2020. Readers are welcome to share with
others. To state the obvious: decisions, actions, and outcomes are changing rapidly.

More Related Content

Similar to Early data shows expanding vaccine eligibility increases utilization rates

Vaccine delivery with speed, scale and equity
Vaccine delivery with speed, scale and equityVaccine delivery with speed, scale and equity
Vaccine delivery with speed, scale and equityKelley Hodge
 
Not Enough Shots’_ U.S. Faces ‘Vaccine Cliff’ On Monkeypox.pdf
Not Enough Shots’_ U.S. Faces ‘Vaccine Cliff’ On Monkeypox.pdfNot Enough Shots’_ U.S. Faces ‘Vaccine Cliff’ On Monkeypox.pdf
Not Enough Shots’_ U.S. Faces ‘Vaccine Cliff’ On Monkeypox.pdfUmar Khan
 
Increases in covid‑19 are unrelated to levels of vaccination across....
Increases in covid‑19 are unrelated to levels of vaccination across....Increases in covid‑19 are unrelated to levels of vaccination across....
Increases in covid‑19 are unrelated to levels of vaccination across....Laurent Sailly
 
exploring-covid-vaccine-psychology.pdf
exploring-covid-vaccine-psychology.pdfexploring-covid-vaccine-psychology.pdf
exploring-covid-vaccine-psychology.pdfNewristics USA
 
exploring-covid-vaccine-psychology.pdf
exploring-covid-vaccine-psychology.pdfexploring-covid-vaccine-psychology.pdf
exploring-covid-vaccine-psychology.pdfNewristics USA
 
Should individual rights (e.g., parents’ right to decide whether to .docx
Should individual rights (e.g., parents’ right to decide whether to .docxShould individual rights (e.g., parents’ right to decide whether to .docx
Should individual rights (e.g., parents’ right to decide whether to .docxmanningchassidy
 
Course Project How U.S. C
Course Project How U.S. CCourse Project How U.S. C
Course Project How U.S. CCruzIbarra161
 
the graying of america challenges and controversies spring 20.docx
the graying of america challenges and controversies spring 20.docxthe graying of america challenges and controversies spring 20.docx
the graying of america challenges and controversies spring 20.docxoreo10
 
The Review of Economics and StatisticsVOL- XCIII MAY 2011 NUMBER 2INSI.docx
The Review of Economics and StatisticsVOL- XCIII MAY 2011 NUMBER 2INSI.docxThe Review of Economics and StatisticsVOL- XCIII MAY 2011 NUMBER 2INSI.docx
The Review of Economics and StatisticsVOL- XCIII MAY 2011 NUMBER 2INSI.docxharrym15
 
A national-plan-to-enable-comprehensive-covid-19-case-finding-and-contact-tra...
A national-plan-to-enable-comprehensive-covid-19-case-finding-and-contact-tra...A national-plan-to-enable-comprehensive-covid-19-case-finding-and-contact-tra...
A national-plan-to-enable-comprehensive-covid-19-case-finding-and-contact-tra...Mumbaikar Le
 
Addressing Vaccine Hesitancy
Addressing Vaccine Hesitancy Addressing Vaccine Hesitancy
Addressing Vaccine Hesitancy CHC Connecticut
 
POD Paper Immunity fo rthe Community
POD Paper Immunity fo rthe CommunityPOD Paper Immunity fo rthe Community
POD Paper Immunity fo rthe CommunityCheyenne Boyd
 
PODImmunityfortheCommunity
PODImmunityfortheCommunityPODImmunityfortheCommunity
PODImmunityfortheCommunityHannah Burress
 
History of vaccine preventable disease in us
History of vaccine preventable disease in usHistory of vaccine preventable disease in us
History of vaccine preventable disease in usJeffrey Stone
 
The National HIV Prevention Inventory Final
The National HIV Prevention Inventory FinalThe National HIV Prevention Inventory Final
The National HIV Prevention Inventory FinalNASTAD
 
CHAPTER IV- DATA AND ANALYSISIntroductionBased on the collec
CHAPTER IV- DATA AND ANALYSISIntroductionBased on the collecCHAPTER IV- DATA AND ANALYSISIntroductionBased on the collec
CHAPTER IV- DATA AND ANALYSISIntroductionBased on the collecJinElias52
 
Universal Health Insurance Coverage in the United States
Universal Health Insurance Coverage in the United StatesUniversal Health Insurance Coverage in the United States
Universal Health Insurance Coverage in the United StatesBrian Wells, MD, MS, MPH
 

Similar to Early data shows expanding vaccine eligibility increases utilization rates (20)

Vaccine delivery with speed, scale and equity
Vaccine delivery with speed, scale and equityVaccine delivery with speed, scale and equity
Vaccine delivery with speed, scale and equity
 
Not Enough Shots’_ U.S. Faces ‘Vaccine Cliff’ On Monkeypox.pdf
Not Enough Shots’_ U.S. Faces ‘Vaccine Cliff’ On Monkeypox.pdfNot Enough Shots’_ U.S. Faces ‘Vaccine Cliff’ On Monkeypox.pdf
Not Enough Shots’_ U.S. Faces ‘Vaccine Cliff’ On Monkeypox.pdf
 
Increases in covid‑19 are unrelated to levels of vaccination across....
Increases in covid‑19 are unrelated to levels of vaccination across....Increases in covid‑19 are unrelated to levels of vaccination across....
Increases in covid‑19 are unrelated to levels of vaccination across....
 
exploring-covid-vaccine-psychology.pdf
exploring-covid-vaccine-psychology.pdfexploring-covid-vaccine-psychology.pdf
exploring-covid-vaccine-psychology.pdf
 
exploring-covid-vaccine-psychology.pdf
exploring-covid-vaccine-psychology.pdfexploring-covid-vaccine-psychology.pdf
exploring-covid-vaccine-psychology.pdf
 
Lin Final Version - Final
Lin Final Version - FinalLin Final Version - Final
Lin Final Version - Final
 
Should individual rights (e.g., parents’ right to decide whether to .docx
Should individual rights (e.g., parents’ right to decide whether to .docxShould individual rights (e.g., parents’ right to decide whether to .docx
Should individual rights (e.g., parents’ right to decide whether to .docx
 
Course Project How U.S. C
Course Project How U.S. CCourse Project How U.S. C
Course Project How U.S. C
 
the graying of america challenges and controversies spring 20.docx
the graying of america challenges and controversies spring 20.docxthe graying of america challenges and controversies spring 20.docx
the graying of america challenges and controversies spring 20.docx
 
The Review of Economics and StatisticsVOL- XCIII MAY 2011 NUMBER 2INSI.docx
The Review of Economics and StatisticsVOL- XCIII MAY 2011 NUMBER 2INSI.docxThe Review of Economics and StatisticsVOL- XCIII MAY 2011 NUMBER 2INSI.docx
The Review of Economics and StatisticsVOL- XCIII MAY 2011 NUMBER 2INSI.docx
 
A national-plan-to-enable-comprehensive-covid-19-case-finding-and-contact-tra...
A national-plan-to-enable-comprehensive-covid-19-case-finding-and-contact-tra...A national-plan-to-enable-comprehensive-covid-19-case-finding-and-contact-tra...
A national-plan-to-enable-comprehensive-covid-19-case-finding-and-contact-tra...
 
2015 HCM PACA Reform
2015 HCM PACA Reform2015 HCM PACA Reform
2015 HCM PACA Reform
 
Addressing Vaccine Hesitancy
Addressing Vaccine Hesitancy Addressing Vaccine Hesitancy
Addressing Vaccine Hesitancy
 
POD Paper Immunity fo rthe Community
POD Paper Immunity fo rthe CommunityPOD Paper Immunity fo rthe Community
POD Paper Immunity fo rthe Community
 
PODImmunityfortheCommunity
PODImmunityfortheCommunityPODImmunityfortheCommunity
PODImmunityfortheCommunity
 
History of vaccine preventable disease in us
History of vaccine preventable disease in usHistory of vaccine preventable disease in us
History of vaccine preventable disease in us
 
The National HIV Prevention Inventory Final
The National HIV Prevention Inventory FinalThe National HIV Prevention Inventory Final
The National HIV Prevention Inventory Final
 
CHAPTER IV- DATA AND ANALYSISIntroductionBased on the collec
CHAPTER IV- DATA AND ANALYSISIntroductionBased on the collecCHAPTER IV- DATA AND ANALYSISIntroductionBased on the collec
CHAPTER IV- DATA AND ANALYSISIntroductionBased on the collec
 
Universal Health Insurance Coverage in the United States
Universal Health Insurance Coverage in the United StatesUniversal Health Insurance Coverage in the United States
Universal Health Insurance Coverage in the United States
 
Essays About Health Care
Essays About Health CareEssays About Health Care
Essays About Health Care
 

Recently uploaded

Kesar Bagh Call Girl Price 9548273370 , Lucknow Call Girls Service
Kesar Bagh Call Girl Price 9548273370 , Lucknow Call Girls ServiceKesar Bagh Call Girl Price 9548273370 , Lucknow Call Girls Service
Kesar Bagh Call Girl Price 9548273370 , Lucknow Call Girls Servicemakika9823
 
Russian Call Girls in Pune Riya 9907093804 Short 1500 Night 6000 Best call gi...
Russian Call Girls in Pune Riya 9907093804 Short 1500 Night 6000 Best call gi...Russian Call Girls in Pune Riya 9907093804 Short 1500 Night 6000 Best call gi...
Russian Call Girls in Pune Riya 9907093804 Short 1500 Night 6000 Best call gi...Miss joya
 
Call Girls Colaba Mumbai ❤️ 9920874524 👈 Cash on Delivery
Call Girls Colaba Mumbai ❤️ 9920874524 👈 Cash on DeliveryCall Girls Colaba Mumbai ❤️ 9920874524 👈 Cash on Delivery
Call Girls Colaba Mumbai ❤️ 9920874524 👈 Cash on Deliverynehamumbai
 
Low Rate Call Girls Pune Esha 9907093804 Short 1500 Night 6000 Best call girl...
Low Rate Call Girls Pune Esha 9907093804 Short 1500 Night 6000 Best call girl...Low Rate Call Girls Pune Esha 9907093804 Short 1500 Night 6000 Best call girl...
Low Rate Call Girls Pune Esha 9907093804 Short 1500 Night 6000 Best call girl...Miss joya
 
VIP Call Girls Tirunelveli Aaradhya 8250192130 Independent Escort Service Tir...
VIP Call Girls Tirunelveli Aaradhya 8250192130 Independent Escort Service Tir...VIP Call Girls Tirunelveli Aaradhya 8250192130 Independent Escort Service Tir...
VIP Call Girls Tirunelveli Aaradhya 8250192130 Independent Escort Service Tir...narwatsonia7
 
VIP Mumbai Call Girls Hiranandani Gardens Just Call 9920874524 with A/C Room ...
VIP Mumbai Call Girls Hiranandani Gardens Just Call 9920874524 with A/C Room ...VIP Mumbai Call Girls Hiranandani Gardens Just Call 9920874524 with A/C Room ...
VIP Mumbai Call Girls Hiranandani Gardens Just Call 9920874524 with A/C Room ...Garima Khatri
 
Call Girl Number in Panvel Mumbai📲 9833363713 💞 Full Night Enjoy
Call Girl Number in Panvel Mumbai📲 9833363713 💞 Full Night EnjoyCall Girl Number in Panvel Mumbai📲 9833363713 💞 Full Night Enjoy
Call Girl Number in Panvel Mumbai📲 9833363713 💞 Full Night Enjoybabeytanya
 
(👑VVIP ISHAAN ) Russian Call Girls Service Navi Mumbai🖕9920874524🖕Independent...
(👑VVIP ISHAAN ) Russian Call Girls Service Navi Mumbai🖕9920874524🖕Independent...(👑VVIP ISHAAN ) Russian Call Girls Service Navi Mumbai🖕9920874524🖕Independent...
(👑VVIP ISHAAN ) Russian Call Girls Service Navi Mumbai🖕9920874524🖕Independent...Taniya Sharma
 
Call Girl Bangalore Nandini 7001305949 Independent Escort Service Bangalore
Call Girl Bangalore Nandini 7001305949 Independent Escort Service BangaloreCall Girl Bangalore Nandini 7001305949 Independent Escort Service Bangalore
Call Girl Bangalore Nandini 7001305949 Independent Escort Service Bangalorenarwatsonia7
 
Artifacts in Nuclear Medicine with Identifying and resolving artifacts.
Artifacts in Nuclear Medicine with Identifying and resolving artifacts.Artifacts in Nuclear Medicine with Identifying and resolving artifacts.
Artifacts in Nuclear Medicine with Identifying and resolving artifacts.MiadAlsulami
 
Call Girl Coimbatore Prisha☎️ 8250192130 Independent Escort Service Coimbatore
Call Girl Coimbatore Prisha☎️  8250192130 Independent Escort Service CoimbatoreCall Girl Coimbatore Prisha☎️  8250192130 Independent Escort Service Coimbatore
Call Girl Coimbatore Prisha☎️ 8250192130 Independent Escort Service Coimbatorenarwatsonia7
 
Russian Escorts Girls Nehru Place ZINATHI 🔝9711199012 ☪ 24/7 Call Girls Delhi
Russian Escorts Girls  Nehru Place ZINATHI 🔝9711199012 ☪ 24/7 Call Girls DelhiRussian Escorts Girls  Nehru Place ZINATHI 🔝9711199012 ☪ 24/7 Call Girls Delhi
Russian Escorts Girls Nehru Place ZINATHI 🔝9711199012 ☪ 24/7 Call Girls DelhiAlinaDevecerski
 
VIP Call Girls Indore Kirti 💚😋 9256729539 🚀 Indore Escorts
VIP Call Girls Indore Kirti 💚😋  9256729539 🚀 Indore EscortsVIP Call Girls Indore Kirti 💚😋  9256729539 🚀 Indore Escorts
VIP Call Girls Indore Kirti 💚😋 9256729539 🚀 Indore Escortsaditipandeya
 
Premium Call Girls Cottonpet Whatsapp 7001035870 Independent Escort Service
Premium Call Girls Cottonpet Whatsapp 7001035870 Independent Escort ServicePremium Call Girls Cottonpet Whatsapp 7001035870 Independent Escort Service
Premium Call Girls Cottonpet Whatsapp 7001035870 Independent Escort Servicevidya singh
 
Call Girls Service In Shyam Nagar Whatsapp 8445551418 Independent Escort Service
Call Girls Service In Shyam Nagar Whatsapp 8445551418 Independent Escort ServiceCall Girls Service In Shyam Nagar Whatsapp 8445551418 Independent Escort Service
Call Girls Service In Shyam Nagar Whatsapp 8445551418 Independent Escort Serviceparulsinha
 
Bangalore Call Girls Hebbal Kempapura Number 7001035870 Meetin With Bangalor...
Bangalore Call Girls Hebbal Kempapura Number 7001035870  Meetin With Bangalor...Bangalore Call Girls Hebbal Kempapura Number 7001035870  Meetin With Bangalor...
Bangalore Call Girls Hebbal Kempapura Number 7001035870 Meetin With Bangalor...narwatsonia7
 
Call Girls Service Chennai Jiya 7001305949 Independent Escort Service Chennai
Call Girls Service Chennai Jiya 7001305949 Independent Escort Service ChennaiCall Girls Service Chennai Jiya 7001305949 Independent Escort Service Chennai
Call Girls Service Chennai Jiya 7001305949 Independent Escort Service ChennaiNehru place Escorts
 
Russian Call Girls in Bangalore Manisha 7001305949 Independent Escort Service...
Russian Call Girls in Bangalore Manisha 7001305949 Independent Escort Service...Russian Call Girls in Bangalore Manisha 7001305949 Independent Escort Service...
Russian Call Girls in Bangalore Manisha 7001305949 Independent Escort Service...narwatsonia7
 
(Rocky) Jaipur Call Girl - 9001626015 Escorts Service 50% Off with Cash ON De...
(Rocky) Jaipur Call Girl - 9001626015 Escorts Service 50% Off with Cash ON De...(Rocky) Jaipur Call Girl - 9001626015 Escorts Service 50% Off with Cash ON De...
(Rocky) Jaipur Call Girl - 9001626015 Escorts Service 50% Off with Cash ON De...indiancallgirl4rent
 
High Profile Call Girls Coimbatore Saanvi☎️ 8250192130 Independent Escort Se...
High Profile Call Girls Coimbatore Saanvi☎️  8250192130 Independent Escort Se...High Profile Call Girls Coimbatore Saanvi☎️  8250192130 Independent Escort Se...
High Profile Call Girls Coimbatore Saanvi☎️ 8250192130 Independent Escort Se...narwatsonia7
 

Recently uploaded (20)

Kesar Bagh Call Girl Price 9548273370 , Lucknow Call Girls Service
Kesar Bagh Call Girl Price 9548273370 , Lucknow Call Girls ServiceKesar Bagh Call Girl Price 9548273370 , Lucknow Call Girls Service
Kesar Bagh Call Girl Price 9548273370 , Lucknow Call Girls Service
 
Russian Call Girls in Pune Riya 9907093804 Short 1500 Night 6000 Best call gi...
Russian Call Girls in Pune Riya 9907093804 Short 1500 Night 6000 Best call gi...Russian Call Girls in Pune Riya 9907093804 Short 1500 Night 6000 Best call gi...
Russian Call Girls in Pune Riya 9907093804 Short 1500 Night 6000 Best call gi...
 
Call Girls Colaba Mumbai ❤️ 9920874524 👈 Cash on Delivery
Call Girls Colaba Mumbai ❤️ 9920874524 👈 Cash on DeliveryCall Girls Colaba Mumbai ❤️ 9920874524 👈 Cash on Delivery
Call Girls Colaba Mumbai ❤️ 9920874524 👈 Cash on Delivery
 
Low Rate Call Girls Pune Esha 9907093804 Short 1500 Night 6000 Best call girl...
Low Rate Call Girls Pune Esha 9907093804 Short 1500 Night 6000 Best call girl...Low Rate Call Girls Pune Esha 9907093804 Short 1500 Night 6000 Best call girl...
Low Rate Call Girls Pune Esha 9907093804 Short 1500 Night 6000 Best call girl...
 
VIP Call Girls Tirunelveli Aaradhya 8250192130 Independent Escort Service Tir...
VIP Call Girls Tirunelveli Aaradhya 8250192130 Independent Escort Service Tir...VIP Call Girls Tirunelveli Aaradhya 8250192130 Independent Escort Service Tir...
VIP Call Girls Tirunelveli Aaradhya 8250192130 Independent Escort Service Tir...
 
VIP Mumbai Call Girls Hiranandani Gardens Just Call 9920874524 with A/C Room ...
VIP Mumbai Call Girls Hiranandani Gardens Just Call 9920874524 with A/C Room ...VIP Mumbai Call Girls Hiranandani Gardens Just Call 9920874524 with A/C Room ...
VIP Mumbai Call Girls Hiranandani Gardens Just Call 9920874524 with A/C Room ...
 
Call Girl Number in Panvel Mumbai📲 9833363713 💞 Full Night Enjoy
Call Girl Number in Panvel Mumbai📲 9833363713 💞 Full Night EnjoyCall Girl Number in Panvel Mumbai📲 9833363713 💞 Full Night Enjoy
Call Girl Number in Panvel Mumbai📲 9833363713 💞 Full Night Enjoy
 
(👑VVIP ISHAAN ) Russian Call Girls Service Navi Mumbai🖕9920874524🖕Independent...
(👑VVIP ISHAAN ) Russian Call Girls Service Navi Mumbai🖕9920874524🖕Independent...(👑VVIP ISHAAN ) Russian Call Girls Service Navi Mumbai🖕9920874524🖕Independent...
(👑VVIP ISHAAN ) Russian Call Girls Service Navi Mumbai🖕9920874524🖕Independent...
 
Call Girl Bangalore Nandini 7001305949 Independent Escort Service Bangalore
Call Girl Bangalore Nandini 7001305949 Independent Escort Service BangaloreCall Girl Bangalore Nandini 7001305949 Independent Escort Service Bangalore
Call Girl Bangalore Nandini 7001305949 Independent Escort Service Bangalore
 
Artifacts in Nuclear Medicine with Identifying and resolving artifacts.
Artifacts in Nuclear Medicine with Identifying and resolving artifacts.Artifacts in Nuclear Medicine with Identifying and resolving artifacts.
Artifacts in Nuclear Medicine with Identifying and resolving artifacts.
 
Call Girl Coimbatore Prisha☎️ 8250192130 Independent Escort Service Coimbatore
Call Girl Coimbatore Prisha☎️  8250192130 Independent Escort Service CoimbatoreCall Girl Coimbatore Prisha☎️  8250192130 Independent Escort Service Coimbatore
Call Girl Coimbatore Prisha☎️ 8250192130 Independent Escort Service Coimbatore
 
Russian Escorts Girls Nehru Place ZINATHI 🔝9711199012 ☪ 24/7 Call Girls Delhi
Russian Escorts Girls  Nehru Place ZINATHI 🔝9711199012 ☪ 24/7 Call Girls DelhiRussian Escorts Girls  Nehru Place ZINATHI 🔝9711199012 ☪ 24/7 Call Girls Delhi
Russian Escorts Girls Nehru Place ZINATHI 🔝9711199012 ☪ 24/7 Call Girls Delhi
 
VIP Call Girls Indore Kirti 💚😋 9256729539 🚀 Indore Escorts
VIP Call Girls Indore Kirti 💚😋  9256729539 🚀 Indore EscortsVIP Call Girls Indore Kirti 💚😋  9256729539 🚀 Indore Escorts
VIP Call Girls Indore Kirti 💚😋 9256729539 🚀 Indore Escorts
 
Premium Call Girls Cottonpet Whatsapp 7001035870 Independent Escort Service
Premium Call Girls Cottonpet Whatsapp 7001035870 Independent Escort ServicePremium Call Girls Cottonpet Whatsapp 7001035870 Independent Escort Service
Premium Call Girls Cottonpet Whatsapp 7001035870 Independent Escort Service
 
Call Girls Service In Shyam Nagar Whatsapp 8445551418 Independent Escort Service
Call Girls Service In Shyam Nagar Whatsapp 8445551418 Independent Escort ServiceCall Girls Service In Shyam Nagar Whatsapp 8445551418 Independent Escort Service
Call Girls Service In Shyam Nagar Whatsapp 8445551418 Independent Escort Service
 
Bangalore Call Girls Hebbal Kempapura Number 7001035870 Meetin With Bangalor...
Bangalore Call Girls Hebbal Kempapura Number 7001035870  Meetin With Bangalor...Bangalore Call Girls Hebbal Kempapura Number 7001035870  Meetin With Bangalor...
Bangalore Call Girls Hebbal Kempapura Number 7001035870 Meetin With Bangalor...
 
Call Girls Service Chennai Jiya 7001305949 Independent Escort Service Chennai
Call Girls Service Chennai Jiya 7001305949 Independent Escort Service ChennaiCall Girls Service Chennai Jiya 7001305949 Independent Escort Service Chennai
Call Girls Service Chennai Jiya 7001305949 Independent Escort Service Chennai
 
Russian Call Girls in Bangalore Manisha 7001305949 Independent Escort Service...
Russian Call Girls in Bangalore Manisha 7001305949 Independent Escort Service...Russian Call Girls in Bangalore Manisha 7001305949 Independent Escort Service...
Russian Call Girls in Bangalore Manisha 7001305949 Independent Escort Service...
 
(Rocky) Jaipur Call Girl - 9001626015 Escorts Service 50% Off with Cash ON De...
(Rocky) Jaipur Call Girl - 9001626015 Escorts Service 50% Off with Cash ON De...(Rocky) Jaipur Call Girl - 9001626015 Escorts Service 50% Off with Cash ON De...
(Rocky) Jaipur Call Girl - 9001626015 Escorts Service 50% Off with Cash ON De...
 
High Profile Call Girls Coimbatore Saanvi☎️ 8250192130 Independent Escort Se...
High Profile Call Girls Coimbatore Saanvi☎️  8250192130 Independent Escort Se...High Profile Call Girls Coimbatore Saanvi☎️  8250192130 Independent Escort Se...
High Profile Call Girls Coimbatore Saanvi☎️ 8250192130 Independent Escort Se...
 

Early data shows expanding vaccine eligibility increases utilization rates

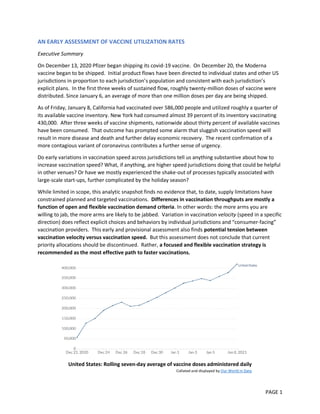
  • 1. PAGE 1 AN EARLY ASSESSMENT OF VACCINE UTILIZATION RATES Executive Summary On December 13, 2020 Pfizer began shipping its covid-19 vaccine. On December 20, the Moderna vaccine began to be shipped. Initial product flows have been directed to individual states and other US jurisdictions in proportion to each jurisdiction’s population and consistent with each jurisdiction’s explicit plans. In the first three weeks of sustained flow, roughly twenty-million doses of vaccine were distributed. Since January 6, an average of more than one million doses per day are being shipped. As of Friday, January 8, California had vaccinated over 586,000 people and utilized roughly a quarter of its available vaccine inventory. New York had consumed almost 39 percent of its inventory vaccinating 430,000. After three weeks of vaccine shipments, nationwide about thirty percent of available vaccines have been consumed. That outcome has prompted some alarm that sluggish vaccination speed will result in more disease and death and further delay economic recovery. The recent confirmation of a more contagious variant of coronavirus contributes a further sense of urgency. Do early variations in vaccination speed across jurisdictions tell us anything substantive about how to increase vaccination speed? What, if anything, are higher speed jurisdictions doing that could be helpful in other venues? Or have we mostly experienced the shake-out of processes typically associated with large-scale start-ups, further complicated by the holiday season? While limited in scope, this analytic snapshot finds no evidence that, to date, supply limitations have constrained planned and targeted vaccinations. Differences in vaccination throughputs are mostly a function of open and flexible vaccination demand criteria. In other words: the more arms you are willing to jab, the more arms are likely to be jabbed. Variation in vaccination velocity (speed in a specific direction) does reflect explicit choices and behaviors by individual jurisdictions and “consumer-facing” vaccination providers. This early and provisional assessment also finds potential tension between vaccination velocity versus vaccination speed. But this assessment does not conclude that current priority allocations should be discontinued. Rather, a focused and flexible vaccination strategy is recommended as the most effective path to faster vaccinations. United States: Rolling seven-day average of vaccine doses administered daily Collated and displayed by Our World in Data
  • 2. PAGE 2 Patterns of Demand and Supply through January 6 Based on CDC data between December 13 and January 6 more than 17,250,000 doses of vaccine (Pfizer and Moderna) had been delivered to US jurisdictions. Since these vaccines have been distributed, about 5.3 million individuals were reported to have received an initial vaccination by January 6. This generated a national Vaccine Utilization Rate (VUR) of roughly 30 percent for this intensive start-up period. During this same period jurisdictions have demonstrated considerable differences in VUR. This analytical snapshot gives particular attention to: • Tennessee: Vaccine Doses Delivered: 328,500, Vaccinations Completed: 166,389, January 6 VUR: about 50 percent. • Illinois: Vaccine Doses Delivered: 542,200, Vaccinations Completed: 189,660, January 6 VUR: about 35 percent • Texas: Vaccine Doses Delivered: 1,375,800, Vaccinations Completed: 489,003, January 6 VUR: about 35 percent Among states receiving more than 300,000 doses, Tennessee, Illinois, and Texas each have a comparatively high VUR. States receiving more than 300,000 doses have had particular difficulty exceeding a 25 percent Vaccine Utilization Rate. As is often the case, the more volume flowing, the more friction in the channel(s). From a supply chain perspective, vaccination is consumption. Consumption can be complicated by a wide range of factors, but three classic impediments are: 1. Lack of sufficient supply capacity (or disruption of capacity) 2. Lack of sufficient distribution capacity (or disruption of distribution) 3. Lack of sufficient demand (or disruption of demand) Current supplies of vaccine are limited. These are entirely new vaccines. Production capacity is still being scaled to meet projected demand. In anticipation of limited supplies, allocation phases have been established. The allocation priorities reflect ethical and epidemiological judgments intended to mitigate morbidity and mortality and to facilitate ongoing healthcare and essential commercial activity. On December 3, 2020, the Advisory Committee on Immunization Practices (ACIP) established two covid-19 vaccination targets for Phase 1a: 1) health care personnel and 2) residents of long-term care (LTC) facilities. Each state, however, has independent authority to finalize and operationalize any such targets. While most states have confirmed the priority ACIP gave health care personnel and LTC residents, some state-specific twist or two or three is common. LTC facility staff has become a common addition. Within the limits of available flow (averaging close to one million doses per day over the first three weeks) each State and related jurisdictions received a number of doses proportional to its population. The initial volume of vaccine deliveries was less than some states were expecting, but by the last week in December volume and velocity expectations were largely calibrated to actual flow. Transportation of supplies from Pfizer (Kalamazoo, Michigan) and Moderna (via Olive Branch, Mississippi) have achieved schedules and volumes consistent with projections.
  • 3. PAGE 3 As a result, while vaccine supply has been limited, it is equally limited for each receiving State. There is no evidence that divergence in the timing or volume of vaccine supply has had any influence on the divergence in Vaccine Utilization Rates between States. As of January 6, every state had at least 30 percent “excess inventory” on hand. Most states had at least 60 percent of inventories on hand. Tennessee, Illinois, and Texas have pursued different distribution strategies that could have capacity implications. Both Illinois and Tennessee are organized around a hub-and-spoke structure. Illinois depends on ten hubs. Tennessee depends on 28 hubs (maybe just cross-docks). Texas has distributed its allocated vaccinations directly to 1036 local vaccination venues. These are, obviously, three distinct geographies and, perhaps, three very different sources of demand. During the first full week in January there were reports in each state of smaller population counties and vaccination venues running out of inventory (Tennessee example), even while significant inventories remain available to each state. Still, official and media reports have not -- yet -- exposed significant variation in local ("last mile") availability of vaccines among these three States. At least in these three cases, their different network structures and distribution strategies appear to have a neutral impact on vaccination throughputs. The inability to resupply smaller vaccination venues from available stocks does signal potential problems with inventory management, demand signaling and/or transportation resources. But these do not seem to have emerged from differences in distribution strategy or structure. If supply and distribution are not significant sources of VUR variation, that leaves demand. Since mid- December, vaccine consumption has been limited mostly to sub-populations that meet each State’s allocation criteria. As of January 6, Tennessee, Illinois, and Texas – and most other jurisdictions – had only been engaged in so-called Phase 1a vaccinations. The Illinois definition of 1a populations includes both ACIP groups and LTC facility staff. Tennessee and Texas include these same groups and then add other targets. Tennessee has added first responders and "adults who cannot live independently". Texas has added, all "Texans over age 65 and people with medical conditions that put them at higher risk of disease or death from covid-19." These are very different sources and sizes of demand. The broader the allocation criteria, the easier to attract throughput for currently available doses. Many epidemiologists have suggested over 250 million residents of the United States should be vaccinated to suppress the pandemic. Surveys suggest that 170 to 200 million residents of the United States are currently willing to be vaccinated. Three weeks after vaccines had begun shipping, 5.3 million Americans had been vaccinated, even though roughly 20 million doses had been shipped. Consumption is pulling slower than supply is pushing. Demand – while variable – is far from being fulfilled. Tennessee, Illinois, and Texas have demonstrated higher than average Vaccine Utilization Rates. A major element differentiating Vaccine Utilization Rates in these three States from jurisdictions with lower VURs appears to be the size of the allocation pool being served and the demand-orientation of vaccination planning and execution. Three States Compared with other Jurisdictions In mid-November the Kaiser Family Foundation assessed the vaccination plans of forty-seven states. According to this analysis: Every state plan highlights the following broad categories as being priority populations for Phase 1 efforts: health care workers, essential workers, and those at high risk (older people and those with pre-disposing health risk factors). Most plans recognize (and CDC indicated in its guidance) that there
  • 4. PAGE 4 will likely not be enough vaccines at first for all individuals identified in these Phase 1 priority groups. Even so, plans show that some states are much further along in defining prioritization categories and enumerating the number of people that fall into those categories. For example: • Less than half (19 of 47, or 40%) of state plans reviewed include a numerical estimate of the number of individuals in different priority populations; the majority of states report they are still developing their data sources and methodology to calculate the number in their priority groups. • Some states report already developing specific estimates of the numbers of health care workers likely among the first individuals targeted for vaccination, while other states do not include these estimates, or mention that they are working on developing methods to identify the numbers to be targeted in this group. State vaccination plans submitted to the Centers for Disease Control by Tennessee, Illinois, and Texas all demonstrate significant prior awareness of potential demand for each phase of vaccination. The amended Vaccination Plan developed by the Tennessee Department of Health does not specify the size of Phase 1a target populations, but both the plan and easily available online resources demonstrate that Tennessee has carefully sized each priority population consistent with Tennessee targets. The updated Vaccination Plan developed by the Illinois Department of Public Health specifies numerical estimates for each phase. The plan also references state investment in a sophisticated population- focused, demand-oriented data tool for managing the rollout of vaccinations in Illinois. The original draft Vaccination Plan for the Texas Department of State Health Services details specific numbers for each Phase 1a (and subsequent) target populations per each state public health region, please see the chart below. The Texas plan also outlines data sources and analytical methods that are being used to more fully characterize the size and location of target populations. Texas Department of State Health Services
  • 5. PAGE 5 Principal Observations, Analysis, and Starting toward Strategic Synthesis Lower volume jurisdictions should be able to move and consume lower volumes of supply more quickly. This has not always happened, but through January 6 this has been reflected in those jurisdictions showing the highest rates of vaccine consumption. Failure to effectively move and consume lower volumes (e.g., less than 150,00 doses between December 13 and January 6) is cause for rigorous strategic and operational examination and potential intervention. Through January 6, supply capacity has not been a constraint on planned and targeted vaccine consumption. All states had significant vaccine stocks on hand. Only three states had administered more doses than they continued to have in inventory. Most states had in inventory almost double the number of doses they had administered through January 6. In three higher volume states with above-average consumption of doses—Tennessee, Illinois, and Texas—it is noted that each of these states share a comparatively sophisticated attention to population demand factors. Two of the three states have also significantly expanded their demand pools for initial vaccinations. Priority allocation is intended to maximize the life-saving potential of limited supplies. Hospital healthcare workers are especially vulnerable and essential to saving the lives of those most seriously affected by covid-19 and other health emergencies. The allocation priorities set out are appropriate to a supply constrained context. There are both ethical and epidemiological benefits where allocation targets can be confidently achieved in a timely way. But a variety of factors—including high demand for acute health care—have limited the speed of consumption by health care providers. Some level of vaccine hesitancy also exists. Prioritizing – and thereby limiting – vaccination to any narrow population erects an impediment to increasing speed and total vaccination throughputs. In any demand and supply network there can be tension between speed and velocity. Velocity is speed in a specific direction. Speed downhill will be slower than the same distance uphill. Texas and Tennessee have shown higher VURs at least in part because they have expanded their demand pools by including much larger target populations in their initial allocation priorities. They have chosen pathways that flexibly favor general speed over specific velocities. Illinois has retained the narrow population pool originally recommended by ACIP, but Illinois has also given priority to serving these target populations in locations (usually hospitals) where case counts are most rapidly growing and hospitalizations most endanger ICU capacity. According to one Illinois official interviewed for this report, “Demand [for vaccine] tends to reflect perceived risk. Perceived risk is highest where disease is most obvious. So far we are focusing supply where perceived risk is pushing demand.” This is also a population-oriented, demand-sensitive vaccination strategy. It is also true that while Tennessee, Illinois, and Texas have achieved higher than average Vaccine Utilization Rates, none have achieved a rate that will support their own public health objectives. Strategic Assessment The United States is currently shipping more than one million vaccine doses per day. According to CDC reports, on January 7 the United States vaccinated 768,813 individuals. There is no evidence to suggest lack of supply or ineffective distribution is substantially slowing planned and targeted vaccination (consumption). There is evidence that full-speed vaccinations are being complicated and delayed by efforts to restrict vaccinations to allocation priorities.
  • 6. PAGE 6 Achieving the current allocation priorities will result in a more resilient health care system, preserve essential commerce, and advance the wellness of the whole population. Priority can and should continue to be given to those population groups most at risk and most essential. But in the current risk context – especially given the highly contagious variant now spreading – these priorities should also be calibrated to ensure a full-speed flow of available vaccines. As demonstrated by Tennessee and Texas, opening vaccinations to demand beyond the tightest allocation priorities need not impede fulfilling demand among the priority populations. Both can be advanced. One way to conceive of accommodating allocation priorities with full-speed vaccinations is to “time-out” consumption of doses. For short periods of time a set of doses can be reserved for designated priority populations and delivered as conveniently as possible to that population. At the end of this short period, the doses can be made available – preferably on a reservation-basis – to general population vaccination venues. For example, in some jurisdictions where grocery workers have current allocation priority, when a store has completed vaccinating all available workers and still has doses left, an announcement has been made allowing customers to be vaccinated. Where there is excess demand for these “pop-up doses”, vaccination staff have attempted to sequence recipients consistent with ACIP and/or State priorities. Focused and flexible is the path to fast effective vaccinations. In the current context, effective vaccinations involve fulfilling current demand in a manner that will reinforce consumption of second doses, increase overall demand (reduce vaccine hesitancy), reduce overall US morbidity and mortality, and maintain flows of essential resources. While increasing vaccination speed is necessary, short-term spikes that do not meet these minimally effective characteristics would be strategically counterproductive. There is also a need to reinforce public understanding that given realistic vaccine volumes and effective vaccination practices, a phased approach focused on priority populations while proactively facilitating others is the best way to reduce shared vulnerabilities and ensure economic continuity. Strategic Recommendation: • Maintain current risk-based allocation priorities while explicitly and systematically articulating policies to promote “consumer-facing” flexibility to increase the speed of consumption for available vaccines. • Offer methods and training to achieve consumer-facing flexibility to increase speed of consumption. • Establish explicit time-windows for consumption of vaccine inventories to achieve population health and risk reduction objectives. Train, promote, monitor, measure, and manage as necessary to ensure consumption time-windows are achieved. • Develop methods, train, monitor, measure, and manage to facilitate intra-state movement of vaccine inventories as a last-ditch effort to ensure consumption time-windows are achieved. • Give positive national attention to “consumer friendly” vaccination procedures and, especially, scheduling for friction-free, time-minimized vaccinations. (Super-charged scheduling software may need to be the next big investment in this process). This analytic snapshot was quickly developed by Philip J. Palin in response to a special request. It was completed on Sunday, January 10, 2020. Readers are welcome to share with others. To state the obvious: decisions, actions, and outcomes are changing rapidly.