1. Financing Putin’s war on Europe:
Fossil fuel imports from Russia in
the first two months of the
invasion
Fossil fuel exports are a key enabler of Russia’s military buildup and brutal aggression
against Ukraine. To shed light on who purchases Russia’s oil, gas and coal, and how the
volume and value of imports have changed since the start of the invasion, the Centre for
Research on Energy and Clean Air has compiled a detailed dataset of pipeline and
seaborne trade in Russian fossil fuels.
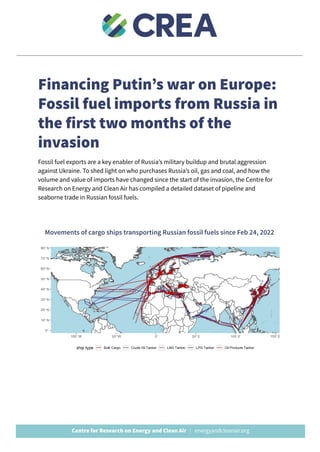
Movements of cargo ships transporting Russian fossil fuels since Feb 24, 2022
2. Key findings
● 63 billion EUR worth of fossil fuels were exported via shipments and pipelines from
Russia since the beginning of the invasion. The EU imported 71% of this, worth
approximately 44 billion EUR.
● The largest importers in order were Germany (EUR 9.1bln), Italy (EUR 6.9bln), China
(EUR 6.7bln), Netherlands (EUR 5.6bln), Turkey (EUR 4.1bln) and France (EUR
3.8bln).
● Even in the absence of import bans, avoidance of Russian supplies is reducing
seaborne imports. Oil deliveries from Russia to foreign ports fell by 20% in the first
three weeks of April, compared with the January-February period before the
invasion. Coal increased by 20%, while LNG deliveries increased by 50%. The fall in
crude oil accelerated after mid-March.
● Deliveries of oil to the EU fell by 20% and coal by 40%, while deliveries of LNG
increased by 20%. EU gas purchases through pipelines increased by 10%. Oil
deliveries to non-EU destinations increased by 20%, and with major changes in
destinations. Deliveries of coal and LNG outside the EU increased by 30% and 80%,
respectively.
● Russia is struggling to divert cargoes not taken up by European buyers: there has
been a sharp increase in vessels leaving Russian ports without a definite
destination.
● A quarter of Russia’s fossil fuel shipments arrived in just six EU ports: Rotterdam
(Netherlands), Maasvlakte (Netherlands), Trieste (Italy), Gdansk (Poland) and
Zeebrugge (Belgium).
● Major oil firms, power utilities and industries continued to buy Russian fossil fuels:
we detected deliveries to facilities or with ships linked to oil companies Exxon
Mobil, Shell, Total, Repsol, BP, Lukoil, Neste and Orlen and Trafigura; power utilities
RWE, KEPCO, Taipower, Tohoku Electric Power, Chubu Electric Power, TEPCO,
Kyushu Electric Power; and industrial companies Nippon Steel, POSCO, Formosa
Petrochemical Corporation, Mitsubishi, Hyundai Steel, Sumitomo and JFE Steel.
● There is a clear pick-up in oil shipments to India, Egypt and other “unusual”
destinations for Russian exports. However, the shipments to these new
destinations are nowhere near enough to make up for the fall in exports to Europe.
3. Introduction
Two months have passed since the beginning of Russia’s unprovoked and unjustified
assault of Ukraine. Over that period of time, the deliberate attrocities committed by the
Russian military include indiscriminate bombing of civilians and civilian infrastructure,
mass killing of civilians, shelling of humanitarian corridors, widespread torture, rape and
abductions, as well as environmental war crimes.
Economic sanctions that undermine the ability, if not the willingness, of the Kremlin to
wage war on Ukraine are an essential part of the response to the invasion. These sanctions
have however been undermined by continued fossil fuel imports from Russia, particularly
to the EU. Europe’s desire to keep the door open to fossil fuel shipments and payments for
them has prevented more comprehensive sanctions on Russian banks, financial
institutions and trade. The inflow of cash worth hundreds of millions of euros per day has
supported the ruble exchange rate and weakened the effect of the sanctions.
The European Union and many Member States have responded to the crisis by announcing
new clean energy and energy efficiency targets, policies and measures. These steps will
provide a replacement for Russian fossil fuels over the next few years, but they have
essentially no effect on Russia’s fossil fuel export revenue in the short term.
Import volumes already have fallen due to self-sanctioning, corporate and national
decisions to stop purchases.
In the short term, Russia has no replacement for Europe as the source of demand. The
majority of the country’s fossil fuel exports are transported to Europe via pipelines, as well
as ports on the Baltic Sea and Black Sea. The LNG terminals or alternative pipeline
connections to divert pipeline gas exports elsewhere simply do not exist. The varieties of
crude oil and coal exported to Europe struggle to find other buyers as there are few
refineries and power plants designed to use them.
In recognition of these factors, the IEA forecasts an almost 15% fall in oil production by the
end of April and 25% in May. However, without much stronger steps, the increase in fossil
fuel prices more than offsets the reduction in volumes.
4. Russia exported 63 billion EUR worth of fossil
fuels; EU is by far the largest buyer
● 63 billion EUR worth of fossil fuels were exported from Russia since the beginning of
the invasion. The EU imported 71% of this, worth approximately 44 billion EUR. The
share of the EU was approximately 30% for coal, 50% for crude oil, 80% for LNG,
70% for oil products and 90% for pipeline gas.
● The largest importers in order were Germany (EUR 9.1bln), Italy (EUR 6.9bln), China
(EUR 6.7bln), Netherlands (EUR 5.6bln), Turkey (EUR 4.1bln) and France
(EUR3.8bln).
5. Sanctions work: Russia’s export volumes are
falling
● Even in the absence of import bans, avoidance of Russian supplies is reducing
seaborne imports. Oil deliveries from Russia to foreign ports fell by 20% in the first
three weeks of April, compared with the January-February period before the
invasion. Coal increased by 20%, while LNG deliveries increased by 50%. The fall in
crude oil accelerated after mid-March.
● Deliveries of oil to the EU fell by 20% and coal by 40%, while deliveries of LNG
increased by 20%. EU gas purchases through pipelines increased by 10%. Oil
deliveries to non-EU destinations increased by 20%, and with major changes in
destinations. Deliveries of coal and LNG outside the EU increased by 30% and 80%,
respectively.
● Seaborne shipments made up approximately half of Russia’s exports by value in the
two-month period, so the contraction is significant.
● Shipping data shows that Russia is struggling to divert cargoes not taken up by
European buyers: there has been a sharp increase in vessels leaving Russian ports
without a definite destination (either “for orders” or reporting an intermediate
destination such as the Bosphorus or Gibraltar).
● Oil shipments to India, Egypt and other “unusual” destinations for Russian exports
have attracted a lot of attention, and our data shows a clear pick-up from a base of
almost zero. However, the shipments to these new destinations are by far not
sufficient to make up for even the modest fall in exports to Europe.
6.
7.
8. Largest importing ports: 6 EU ports were
responsible for a quarter of seaborne imports
● A quarter of Russia’s fossil fuel shipments arrived in just six EU ports. The largest
ports receiving fossil fuels from Russia are Rotterdam (estimated value of
shipments EUR 1,500 mln) and Maasvlakte (EUR 1,200 mln) in the Netherlands,
followed by Trieste (EUR 1,000 mln) in Italy, Gdansk in Poland, and Zeebrugge and
Antwerpen in Belgium. Stopping shipments to these ports alone would have
eliminated 23% of seaborne demand.
Ten largest ports by value of Russian fossil fuel shipments in the first two months of the
invasion (values in mln EUR)
port country coal crude oil LNG oil
products
total
Rotterdam Netherlands 4 1011 0 535 1549
Maasvlakte Netherlands 87 837 237 80 1241
Trieste Italy 21 769 0 205 996
Yeosu South Korea 12 876 0 106 994
Gdansk Poland 1 580 0 169 751
Zeebrugge Belgium 0 0 717 0 717
Antwerpen Belgium 2 152 0 447 600
Körfez Turkey 0 357 0 206 563
Nemrut Bay Turkey 0 483 0 6 488
Port Said Egypt 0 482 0 0 482
9. Major oil firms, power utilities and industrials
continue to buy Russian fossil fuels
● While most of the shipments go into nondescript handling and storage terminals,
we detected deliveries to facilities linked to oil companies Exxon Mobil, Shell, Total,
Repsol, BP, Lukoil, Neste and Orlen. Out of major fossil fuel producers and traders,
ships chartered by Shell, Exxon, Total and Trafigura have continued to carry Russian
fossil fuels in April. Power utilities and industrial companies importing Russian
fossil fuels include RWE, KEPCO, Taipower, Chubu Electric Power, TEPCO, Kyushu
Electric Power, Nippon Steel, Tohoku Electric Power, POSCO, Formosa
Petrochemical Corporation, Mitsubishi, Hyundai Steel, Sumitomo and JFE Steel.
Largest identified oil importers
owner ports countries latest
delivery
estimated
total value,
MEUR
tonnage, kt number of
shipments
Seastock S.r.l. Trieste Italy 2022-04-16 950 1374 12
Vopak Rotterdam,
Waalhaven
Netherlands 2022-04-06 760 1109 11
PERN Gdansk Poland 2022-04-09 750 1128 14
Maasvlakte Oil Terminal (Vopak,
Aramco Overseas, BP,
ExxonMobil, Shell, Total, Lukoil)
Maasvlakte,
Rotterdam
Netherlands 2022-04-05 530 782 7
Lukoil Burgas Bulgaria 2022-04-08 450 691 6
Oil Terminal S.A. Constanta Romania 2022-04-10 420 594 14
JANAF Oil & Natural Gas Co, Omisalj Croatia 2022-04-10 360 546 4
SOCAR state oil company of
Azerbaijan
Nemrut Bay Turkey 2022-04-13 340 497 4
Sea Invest Group Antwerpen Belgium 2022-04-14 320 444 9
ESSR B.V. Rotterdam Netherlands 2022-04-13 310 451 4
10. Largest identified coal importers
owner ports countries latest
delivery
estimated
total value,
MEUR
tonnage, kt number of
shipments
Hamburg Port
Authority
Hamburg Germany 2022-04-06 100 515 6
EMO Maasvlakte Netherlands 2022-04-10 87 388 4
KEPCO Dangjin, Incheon South Korea 2022-04-03 70 332 4
Taiwan International
Ports Corporation
Kaohsiung, Taichung Taiwan 2022-04-09 60 266 7
North Sea Port Everingen, Gent
(ghent), Terneuzen,
Vlissingen
Netherlands
, Belgium
2022-04-07 45 193 9
RWE Eemshaven Netherlands 2022-03-26 42 177 4
JFE Steel Fukuyama,
Hiroshima, Kawasaki,
Chiba
Japan 2022-04-14 41 177 6
Chubu Electric Power,
TEPCO
Hitachinaka,
Amsterdam
Japan,
Netherlands
2022-03-30 40 172 2
Hyundai Steel Pyeongtaek South Korea 2022-04-14 40 221 3
Formosa Petrochemical
Corporation
Mai-liao Taiwan 2022-03-20 40 170 1
Largest identified LNG importers
owner ports countries latest
delivery
estimated
total value,
MEUR
tonnage, kt number of
shipments
Fluxys Zeebrugge, Dunkirk Belgium,
France
2022-04-14 930 842 14
Elengy Montoir-de-bretagne France 2022-04-17 400 388 4
Bahia Bizkaia Gas Bilbao Spain 2022-03-29 320 291 3
Chubu Electric Power,
TEPCO, Tokyo Gas
Anegasaki, Yokohama Japan 2022-03-08 160 148 2
Kogas S(state owned) Anjeong South Korea 2022-03-13 94 85 1
Chubu Electric Power,
TEPCO
Yokkaichi Japan 2022-03-11 88 80 1
Chubu Electric Power Nagoya, Aichi Japan 2022-03-18 82 74 1
11. Policy recommendations
CREA encourages all governments and corporate buyers of Russian fossil fuels to
● end all purchases, in order to strengthen the effect of the sanctions and help end
the war and the crimes against humanity committed by the Russian military.
● end transshipments of Russian fossil fuels to third parties.
● during any wind-down or transition period, or if a full ban isn't plausible, institute
tariffs on imports from Russia. Sufficiently high tariffs would encourage buyers not
to purchase from Russia whenever possible, and curb the price paid to Russian
suppliers on spot markets.
● create a plan to replace Russian fossil fuels with clean (non-fossil) energy, energy
efficiency and energy savings measures as soon as possible. This will be far more
impactful than just re-arranging the global trade flows of fossil fuels, and will have
far greater economic, health and national security benefits.
Methodology
Seaborne shipments
We track ship voyages between Russian ports and ports in other countries using data from
MarineTraffic.com and Datalastic, derived from ship location (AIS) data.
A voyage consists of a ship taking on cargo and departing from a Russian port, arriving in a
non-Russian port and discharging cargo. More complex trips such as loading cargo from
both a Russian and a non-Russian port are excluded.
For crude oil tankers and LNG tankers, the type of cargo is known. We assume that oil
products tankers and oil/chemical tankers carry oil products. Coal is transported by bulk
carriers and general cargo ships which also carry many other types of cargo. We identified
25 “coal export terminals” within Russian ports that export coal. These are specific port
locations that are associated with loading coal. When a vessel takes on cargo at one of
these locations, we assume that the shipment is a coal shipment.
The amount of fuel transported in a shipment is estimated based on the cargo capacity
(deadweight tonnage) of the ships, adjusted by the average ratio of ship capacity to
12. reported customs volume. We validated this approach by aggregating the cargo capacity of
shipments in the latest month with complete trade data (December 2021), and comparing
these values to reported export volumes.
Trade volumes and pricing of fossil fuels (i.e. oil, coal, and gas) are often not available on
hourly or daily basis, and neither are the terms for long-term contracts. To develop this
counter, we therefore relied on some assumptions, as detailed below.
Other physical flows
For Europe, including Turkey, two main sources are being used for the following flows:
Crude oil Oil products Fossil gas Coal
Pipeline Eurostat Eurostat ENTSO-G Eurostat
Seaborne AIS data AIS data AIS data AIS data
ENTSO-G data is available on a daily and near real-time basis.
Eurostat data, however, is only available on a monthly basis till the end of 2021. To derive
2022 trade flows, we scale 2021 trade flows using y-o-y ratios in November-December
2021. Oil pipeline flows to the EU and China and gas pipeline flows to China are assumed
to continue at 2021 levels. China’s pipeline import flows are based on latest figures given in
news reports for winter 2021–22.
13. Pricing
Fossil fuels are sold on a variety of contracts including fixed-price, indexed to average oil
prices and indexed to other spot prices. This means that the revenue to the exporter is not
directly proportional to the current spot price.
To estimate prices of fossil fuel trades in 2022, we first derive historical monthly average
prices for imports from Russia to the EU from Eurostat, and to the rest of the world from
UN COMTRADE, since the trade values are indicated both in physical and monetary terms.
We then fit models between these historical prices and average monthly spot prices for the
current month and with lags (Brent crude oil, TTF gas, Newcastle steam coal, Asian LNG,
ARA coal). Models are built for main trading partners individually, and for the rest of the
world as a whole.
After the start of the invasion, the reluctance of many traders to take cargoes from Russia
has driven discounted pricing of Russian oil. We apply the discount between Brent and
Urals crude prices to crude oil exports to Europe and the discount between Brent and
ESPO to exports to Asia.
Oil-indexed gas contracts have become less common over time, so we include a time
interaction term in the model for pipeline gas prices. These models are then applied to
current spot prices to estimate contract prices.
References
● Eurostat: https://ec.europa.eu/eurostat/databrowser/
● ENTSO-G transparency platform: https://transparency.entsog.eu/
● UN COMTRADE https://comtrade.un.org/Data/
14. About CREA
Centre for Research on Energy and Clean Air (CREA) is an independent research
organisation focused on revealing the trends, causes, and health impacts, as well as the
solutions to air pollution. CREA uses scientific data, research and evidence to support the
efforts of governments, companies and campaigning organizations worldwide in their
efforts to move towards clean energy and clean air, believing that effective research and
communication are the key to successful policies, investment decisions and advocacy
efforts. CREA was founded in December 2019 in Helsinki and has staff in several Asian and
European countries.
In our statement of support for Ukraine, CREA absolutely condemns the Russian military’s
unprovoked and unjustified attack against another sovereign nation, Ukraine. The assault
goes against the fundamental values of human wellbeing, safety, and dignity that our
organisation seeks to advance. We urgently call for an end to the assault and stand in
solidarity with the Ukrainian and Russian people calling for peace.