Rehearsal Script Page 1 Introduction Lets get down t.docx
Stock repair strategy
1. YuanshuGong 829894269
3/13/2015
FIN655
Stock repair strategy
Introduction
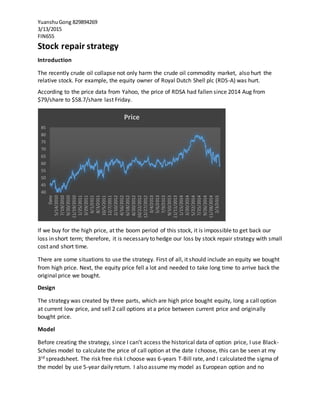
The recently crude oil collapse not only harm the crude oil commodity market, also hurt the
relative stock. For example, the equity owner of Royal Dutch Shell plc (RDS-A) was hurt.
According to the price data from Yahoo, the price of RDSA had fallen since 2014 Aug from
$79/share to $58.7/share last Friday.
If we buy for the high price, at the boom period of this stock, it is impossible to get back our
loss in short term; therefore, it is necessary to hedge our loss by stock repair strategy with small
cost and short time.
There are some situations to use the strategy. First of all, it should include an equity we bought
from high price. Next, the equity price fell a lot and needed to take long time to arrive back the
original price we bought.
Design
The strategy was created by three parts, which are high price bought equity, long a call option
at current low price, and sell 2 call options at a price between current price and originally
bought price.
Model
Before creating the strategy, since I can’t access the historical data of option price, I use Black-
Scholes model to calculate the price of call option at the date I choose, this can be seen at my
3rd spreadsheet. The risk free risk I choose was 6-years T-Bill rate, and I calculated the sigma of
the model by use 5-year daily return. I also assume my model as European option and no
40
45
50
55
60
65
70
75
80
85
Date
5/14/2010
7/19/2010
9/20/2010
11/19/2010
1/25/2011
3/29/2011
6/1/2011
8/3/2011
10/5/2011
12/7/2011
2/10/2012
4/16/2012
6/18/2012
8/20/2012
10/22/2012
12/27/2012
3/4/2013
5/6/2013
7/9/2013
9/10/2013
11/11/2013
1/15/2014
3/20/2014
5/22/2014
7/25/2014
9/26/2014
11/28/2014
2/3/2015
Price
2. YuanshuGong 829894269
3/13/2015
FIN655
dividend. I wrote a macro of the Black-Scholes model and I have attached the codes in the
spreadsheet as well. Every detail can be find the in the spreadsheet-BS option Pricing. The daily
price data was downloaded from Yahoo.
In my strategy which I use RDSA stock, I used the original price $77/share which is peak of
period. This information was highlight by yellow bar in spreadsheet – strategy2. The strike price
can be changed to see the expect option price by using black-scholes model. For the option part
of my strategy, I choose to hedge my stock price at $60/share bought one call option at price
$5.66 which strike price is $60 as same as the price of the stock when I create the strategy
which information was highlight by green bar in spreadsheet – strategy2. Moreover, I sell two
call contracts at price $2.2 which strike price is $70. The exercise time of the options are 1 years
later.
How to use attached spreadsheet
Strategy1: this spreadsheet used to draw graphs for the return of my strategy.
Strategy2: this spreadsheet was created to check option price which stimulated by
blacks-scholes models and the detail of option which create the strategy.
BS Option Pricing: this spreadsheet is created to calculate the every parameter which
should be used to price the options.
Does it work?
In my spreadsheet-strategy1, I compare the gain/loss of the strategy with the gain/loss of non-
hedged stock. It is obvious that the strategy can get more amount of return when the stock go
back to $62price
-16
-14
-12
-10
-8
-6
-4
-2
0
2
4
62 63 64 65 66 67 68 69 70 71 72 73 74 75 76 77
Comparision of two method
Strategy Non-hedge
3. YuanshuGong 829894269
3/13/2015
FIN655
Also, it can be seen from the above graph the gain of slope of strategy is sharper than the stock
which means that strategy can compensate loss of the RDSA more quickly than holding the
stock and waiting for it recovery.
Summary
This kind of strategy is special because it is always used to get money back with less cost and
time when we face huge loss. As the spreadsheet- strategy2 shows, if we create the strategy
on 12/15/2014, we have 85% opportunity to get better return than non-strategy stock.