Recommended

Recommended
More Related Content
Recently uploaded
Recently uploaded (20)
Featured
Featured (20)
Residential real estate market review
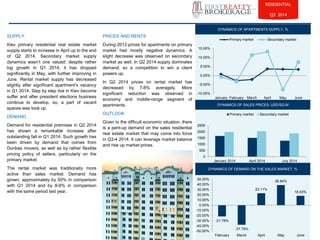
- 1. SUPPLY Kiev primary residential real estate market supply starts to increase in April up to the end of Q2 2014. Secondary market supply dynamics wasn’t one valued: despite rather big growth in Q1 2014, it has dropped significantly in May, with further improving in June. Rental market supply has decreased slightly after significant apartment’s vacancy in Q1 2014. Step by step live in Kiev become suffer and after president elections business continue to develop, so, a part of vacant spaces was took up. DEMAND Demand for residential premises in Q2 2014 has shown a remarkable increase after outstanding fall in Q1 2014. Such growth has been driven by demand that comes from Donbas movers, as well as by rather flexible pricing policy of sellers, particularly on the primary market. The rental market was traditionally more active than sales market. Demand has grown, approximately by 50% in comparison with Q1 2014 and by 8-9% in comparison with the same period last year. PRICES AND RENTS During 2013 prices for apartments on primary market had mostly negative dynamics. A slight decrease was observed on secondary market as well. In Q2 2014 supply dominates demand, so a competition to win a client powers up. In Q2 2014 prices on rental market has decreased by 7-8% averagely. More significant reduction was observed in economy and middle-range segment of apartments. OUTLOOK Given to the difficult economic situation, there is a pent-up demand on the sales residential real estate market that may come into force in Q3-4 2014. It can leverage market balance and rise up market prices. RESIDENTIAL Q2 2014 -10.00% -5.00% 0.00% 5.00% 10.00% 15.00% January February March April May June Primary market Secondary market DYNAMICS OF APARTMENTS SUPPLY, % 0 500 1000 1500 2000 2500 January 2014 April 2014 July 2014 Primary market Secondary market DYNAMICS OF SALES PRICES, USD/SQ M -21.78% -37.79% 23.11% 38.84% 18.03% -50.00% -40.00% -30.00% -20.00% -10.00% 0.00% 10.00% 20.00% 30.00% 40.00% 50.00% February March April May June DYNAMICS OF DEMAND ON THE SALES MARKET, %