Business plan for startups by Mohit Dubey #TiEinstitute April 27 2013
Blog
1. Blog
Title:
App Store Top Chart Series - Chart Freshness
Content:
Are the Top Charts an Exclusive Club?
How many new apps get in everyday?
Which market should I choose to launch my Game app?
Which category chart is the most improbable to break into?
Let’s get started
We defined an app as new if it hasn’t been ranked in the past two months in the
same category and country.
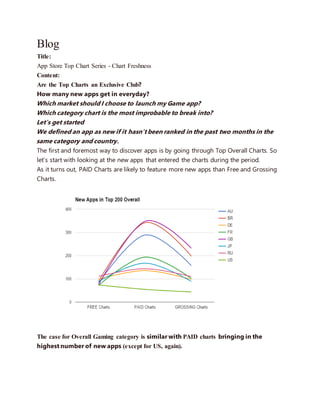
The first and foremost way to discover apps is by going through Top Overall Charts. So
let’s start with looking at the new apps that entered the charts during the period.
As it turns out, PAID Charts are likely to feature more new apps than Free and Grossing
Charts.
The case for Overall Gaming category is similar with PAID charts bringing in the
highest number of new apps (except for US, again).
2. US market is a clear outlier here indicating it’s almost equally tough to break into overall
charts and Overall Games in all three categories (FREE, PAID and GROSSING).
Why? We’ll get to know soon
Individual Category Analysis
After taking a look at the aggregated categories, let’s take a dive into individual categories. Since
individual categories have lesser competition than the aggregated categories, we decided to look
at both Top 50 and Top 200 Charts.
Top 50 Charts Analysis
While all categories averaged around 1 new Free App per day, the number was substantially
higher in PAID charts averaging 5 new apps daily.
3. Top 200 Charts Analysis
Our second analysis focus on a larger pool of apps, ranks going up to 200. This gives us a clear
idea of how fresh the pool of apps is.
We can notice that in most of the categories, FREE Charts bring in more new apps than PAID
Charts. (Opposite of what we saw in Top 50 Charts just above)
4. What about Games?
Gaming Categories showed a similar pattern with PAID charts bringing in more new players
everyday than their Free Counterparts.
We did however noticed differences across countries in bringing new games to the charts.
Australian Game charts were most active, bringing in as many as 58 new games daily.
Ok let's talk about US Charts
5. As for the outlier nature of US markets in Graph 1 and 2, we took a deeper look at the number of
new apps in individual categories in countries.
It’s fair to say that US app charts pull a lot of PAID apps from each individual category which
makes the competition tougher in aggregated categories, TOP Apps and TOP Games.
Conclusions
Top 50 FREE Charts in every country are stale, averaging just over 1 new app every
day.
Top 50 PAID Charts bring in 3X new apps than Top 50 Free Charts.
US is the most favorable market for PAID Apps while being the least favorable for Free
Apps; bringing in almost 2X more paid apps in charts than new apps.
Australia proves to be the best market to launch a game app, bringing in 58 new games
every day across all charts, followed by UK with 51.
Next up in the Top Chart Series: Chart Longevity. After making it into the charts, how long
can you expect to stay in?