SMU ASSIGNMENTS, SMU MBA ASSIGNMENTS, SMU MBA SUMMER SOLVED ASSIGNMENTS, SMU MBA FALL SOLVED ASSIGNMENT, SMU MBA SUMMER ASSIGNMENTS SEM 1, SMU MBA SEM 1 ASSIGNMENTS, SMU MBA SEM 1 SOLVED ASSIGNMENTS, SMU MBA SEM 2 SOLVED ASSIGNMENTS, SMU MBA SEM 3 SOLVED ASSIGNMENTS, SMU MBA SEM 4 SOLVED ASSIGNMENTS, SMU MBA SEM 2 ASSIGNMENTS, SMU MBA SEM 3 ASSIGNMENTS, SMU MBA SEM 4 ASSIGNMENTS, SMU MBA MODEL PAPERS
1. ASSIGNMENT
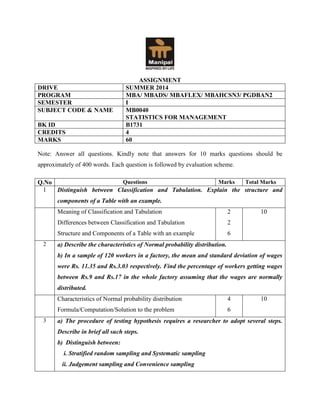
DRIVE SUMMER 2014
PROGRAM MBA/ MBADS/ MBAFLEX/ MBAHCSN3/ PGDBAN2
SEMESTER I
SUBJECT CODE & NAME MB0040
STATISTICS FOR MANAGEMENT
BK ID B1731
CREDITS 4
MARKS 60
Note: Answer all questions. Kindly note that answers for 10 marks questions should be
approximately of 400 words. Each question is followed by evaluation scheme.
Q.No Questions Marks Total Marks
1 Distinguish between Classification and Tabulation. Explain the structure and
components of a Table with an example.
Meaning of Classification and Tabulation
Differences between Classification and Tabulation
Structure and Components of a Table with an example
2
2
6
10
2 a) Describe the characteristics of Normal probability distribution.
b) In a sample of 120 workers in a factory, the mean and standard deviation of wages
were Rs. 11.35 and Rs.3.03 respectively. Find the percentage of workers getting wages
between Rs.9 and Rs.17 in the whole factory assuming that the wages are normally
distributed.
Characteristics of Normal probability distribution
Formula/Computation/Solution to the problem
4
6
10
3 a) The procedure of testing hypothesis requires a researcher to adopt several steps.
Describe in brief all such steps.
b) Distinguish between:
i. Stratified random sampling and Systematic sampling
ii. Judgement sampling and Convenience sampling
FOR SOLVED ASSIGNMENTS AT NOMINAL COST VISIT
WWW.SMUSOLVEDASSIGNMENTS.COM
Or Mail us at
solvemyassignments@gmail.com
2. Hypothesis testing procedure
Differences
4
6
(3 each)
10
4 a) What is regression analysis? How does it differ from correlation analysis?
b) Calculate Karl Pearson’s coefficient of correlation between X series and Y series.
X 110 120 130 120 140 135 155 160 165 155
Y 12 18 20 15 25 30 35 20 25 10
Meaning of Regression and Correlation
Differences
Formula/ Computation/ Solution to the problem
2
3
5
10
5 Briefly explain the methods and theories of Business forecasting.
Meaning of Business forecasting
Methods of Business forecasting
Theories of Business forecasting
2
4
4
10
6
Construct Fisher’s Ideal Index for the given information and check whether Fisher’s
formula satisfies Time Reversal and Factor Reversal Tests.
Items P0 Q0 P1 Q1
A 16 5 20 6
B 12 10 18 12
C 14 8 16 10
D 20 6 22 10
E 80 3 90 5
F 40 2 50 5
Formula of Fishers Ideal Index
Computation of Fisher’s Ideal Index
Fisher’s formula satisfies Time Reversal Test
Fisher’s formula satisfies Factor Reversal Test
1
3
3
3
10