Crafts and SMEsprofiting from EU / EMU
First ideas
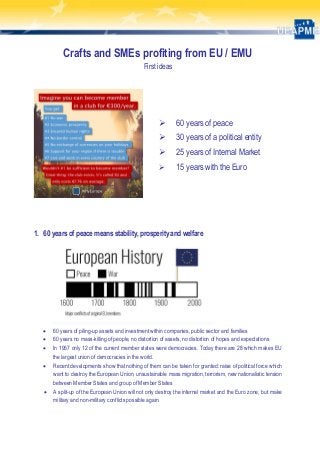
60 years of peace
30 years of a political entity
25 years of Internal Market
15 years with the Euro
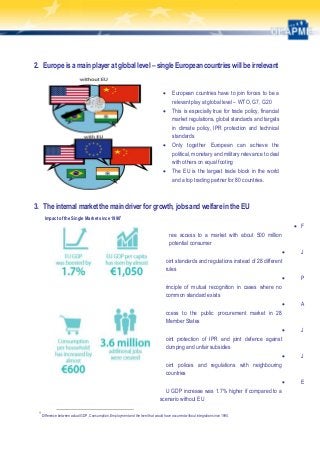
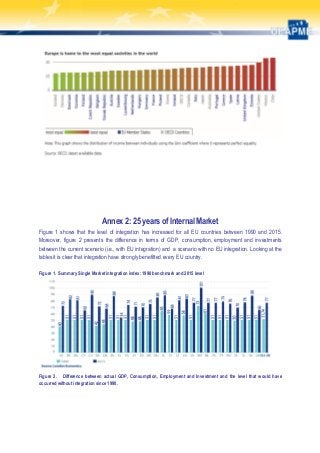
1. 60 years of peace means stability, prosperity and welfare
60 years of piling-up assets and investment within companies, public sector and families
60 years no mass-killing of people, no distortion of assets, no distortion of hopes and expectations
In 1957 only 12 of the current member states were democracies. Today there are 28 which makes EU
the largest union of democracies in the world.
Recent developments show that nothing of them can be taken for granted: raise of political force which
want to destroy the European Union, unsustainable mass migration, terrorism, new nationalistic tension
between Member States and group of Member States
A split-up of the European Union will not only destroy the internal market and the Euro zone, but make
military and non-military conflicts possible again.
2.
2. Europe isa main player at global level – single European countries will be irrelevant
European countries have to join forces to be a
relevant play at global level – WTO, G7, G20
This is especially true for trade policy, financial
market regulations, global standards and targets
in climate policy, IPR protection and technical
standards
Only together European can achieve the
political, monetary and military relevance to deal
with others on equal footing
The EU is the largest trade block in the world
and a top trading partner for 80 countries.
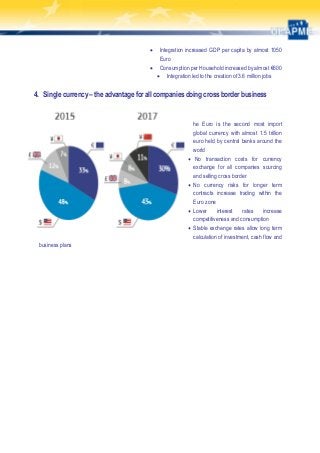
3. The internal market the main driver for growth, jobs and welfare in the EU
Impact of the Single Market since 19901
F
ree access to a market with about 500 million
potential consumer
J
oint standards and regulations instead of 28 different
rules
P
rinciple of mutual recognition in cases where no
common standard exists
A
ccess to the public procurement market in 28
Member States
J
oint protection of IPR and joint defence against
dumping and unfair subsidies
J
oint polices and regulations with neighbouring
countries
E
U GDP increase was 1.7% higher if compared to a
scenario without EU
1
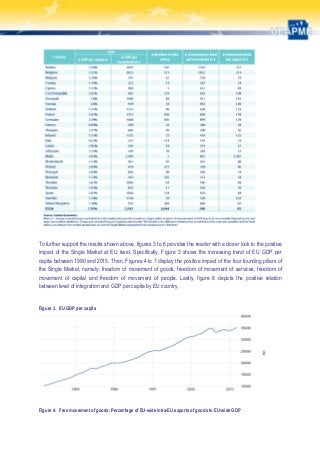
Difference between actual GDP, Consumption,Employmentand the level that would have occurred without integration since 1990.
3.
Integration increasedGDP per capita by almost 1050
Euro
Consumption per Household increased by almost €600
Integration led to the creation of 3.6 million jobs
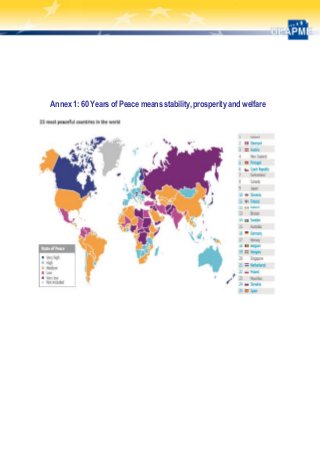
4. Single currency – the advantage for all companies doing cross border business
he Euro is the second most import
global currency with almost 1.5 trillion
euro held by central banks around the
world
No transaction costs for currency
exchange for all companies sourcing
and selling cross border
No currency risks for longer term
contracts increase trading within the
Euro zone
Lower interest rates increase
competitiveness and consumption
Stable exchange rates allow long term
calculation of investment, cash flow and
business plans
4.
Annex 1: 60Years of Peace means stability, prosperity and welfare
5.
Annex 2: 25years of Internal Market
Figure 1 shows that the level of integration has increased for all EU countries between 1990 and 2015.
Moreover, figure 2 presents the difference in terms of GDP, consumption, employment and investments
between the current scenario (i.e., with EU integration) and a scenario with no EU integration. Looking at the
tables it is clear that integration have strongly benefitted every EU country.
Figure 1. Summary Single Market integration index: 1990 benchmark and 2015 level
Figure 2. Difference between actual GDP, Consumption, Employment and Investment and the level that would have
occurred without integration since 1990.
6.
To further supportthe results shown above, figures 3 to 8 provides the reader with a closer look to the positive
impact of the Single Market at EU level. Specifically, Figure 3 shows the increasing trend of EU GDP per
capita between 1990 and 2015. Then, Figures 4 to 7 display the positive impact of the four founding pillars of
the Single Market, namely: freedom of movement of goods, freedom of movement of services, freedom of
movement of capital and freedom of movement of people. Lastly, figure 8 depicts the positive relation
between level of integration and GDP per capita by EU country.
Figure 3. EU GDP per capita
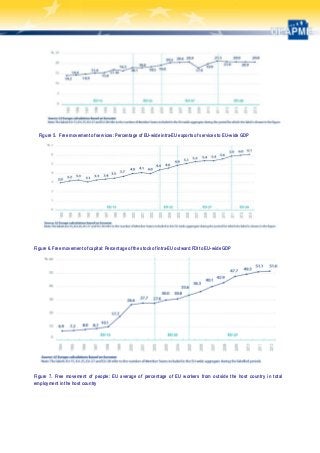
Figure 4. Free movement of goods: Percentage of EU-wide intra-EU exports of goods to EU-wide GDP
7.
Figure 5. Freemovement of services: Percentage of EU-wide intra-EU exports of services to EU-wide GDP
Figure 6. Free movement of capital: Percentage of the stock of intra-EU outward FDI to EU-wide GDP
Figure 7. Free movement of people: EU average of percentage of EU workers from outside the host country in total
employment in the host country
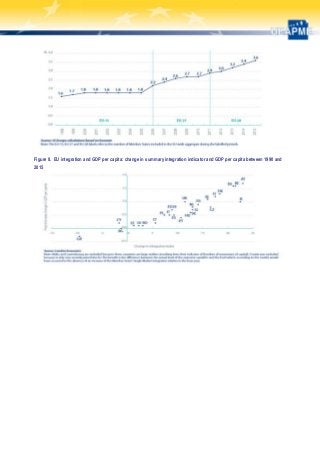
8.
Figure 8. EUintegration and GDP per capita: change in summary integration indicator and GDP per capita between 1990 and
2015