Recommended

Recommended
More Related Content
What's hot
What's hot (20)
Viewers also liked
Viewers also liked (18)
Similar to Modeling Uninsurance Estimates at the County Level
Similar to Modeling Uninsurance Estimates at the County Level (20)
More from soder145
More from soder145 (20)
Recently uploaded
Recently uploaded (20)
Modeling Uninsurance Estimates at the County Level
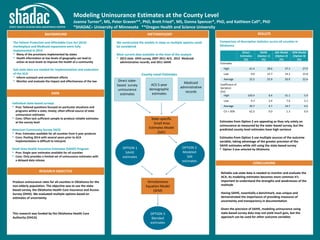
- 1. Modeling Uninsurance Estimates at the County Level Joanna Turner*, MS, Peter Graven**, PhD, Brett Fried*, MS, Donna Spencer*, PhD, and Kathleen Call*, PhD *SHADAC– University of Minnesota **Oregon Health and Science University BACKGROUND RESEARCH OBJECTIVE METHODOLOGY RESULTS CONCLUSIONS Direct Estimates (%) SAHIE (Option 1) (%) SAE Model (Option 2) (%) SEM Model (Option 3) (%) Estimates High 61.4 28.6 37.3 27.9 Low 0.0 15.7 14.3 15.8 Average 22.5 22.9 20.9 22.6 Coefficient of Variation (CV) High 103.4 6.4 31.1 5.9 Low 9.3 2.4 7.6 2.1 Average 39.7 4.7 14.7 4.5 CV > 30% 62.5 0.0 1.3 0.0 Reliable sub-state data is needed to monitor and evaluate the ACA. As modeling estimates becomes more common it’s important to understand the strengths and weaknesses of the methods Having SAHIE, essentially a benchmark, was unique and demonstrated the importance of providing measures of uncertainty and transparency in documentation Given the precision of SAHIE, modeling uninsurance using state-based survey data may not yield much gain, but the approach can be used for other outcome variables Direct state- based survey uninsurance estimates ACS 5-year demographic estimates Medicaid administrative records State-specific Small Area Estimates Model (SAE) OPTION 2 Modeled SAE estimates OPTION 1 SAHIE estimates Simultaneous Equation Model (SEM) OPTION 3 Blended estimates The Patient Protection and Affordable Care Act (ACA) marketplace and Medicaid expansions were fully implemented in 2014 • Many of the provisions implemented by states • Health information at low levels of geography can lead to action at local levels to improve the health of a community Sub-state data are needed for implementation and evaluation of the ACA • Inform outreach and enrollment efforts • Monitor and evaluate the impact and effectiveness of the law Produce uninsurance rates for all counties in Oklahoma for the non-elderly population. The objective was to use the state- based survey, the Oklahoma Health Care Insurance and Access Survey (OHIS). We evaluated multiple options based on estimates of uncertainty. This research was funded by the Oklahoma Health Care Authority (OHCA) let Comparison of descriptive statistics across all counties in Oklahoma Estimates from Option 2 are appealing as they rely solely on uninsurance as measured by the state–based survey, but the predicted county level estimates have high variance Estimates from Option 3 use multiple sources of the outcome variable, taking advantage of the greater precision of the SAHIE estimates while still using the state-based survey • Option 3 was selected by Oklahoma DATA Individual state-based surveys • Pros: Tailored questions focused on particular situations and programs within a state; timely; often official source of state uninsurance estimates • Cons: Often lack sufficient sample to produce reliable estimates at the county level American Community Survey (ACS) • Pros: Estimates available for all counties from 5-year products • Cons: Pooling 2014 with several years prior to ACA implementation is difficult to interpret Small Area Health Insurance Estimates (SAHIE) Program • Pros: Single year estimates available for all counties • Cons: Only provides a limited set of uninsurance estimates with a delayed data release We constructed the models in steps so multiple options could be considered Most current data available at the time of the analysis • 2013 state OHIS survey, 2007-2011 ACS, 2012 Medicaid administrative records, and 2011 SAHIE County-Level Estimates