Using An Integrated Tuberculosis Case Management Model In Maricopa County, Arizona
1. Using An IntegratedTuberculosis Case Management Model In Maricopa County,Arizona
Siru Prasai, MD, MPH; Matthew Parker, MPH;Yoseph Sorri, MD, MPH;Angelito Bravo, MD; Bob England, MD, MPH; Renuka Khurana, MD, MPH
Tuberculosis Control Program, Maricopa County Department of Public Health, Phoenix,Arizona, U.S.
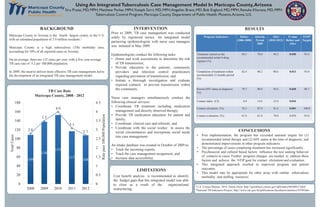
TB Case Rate
Maricopa County, 2008 - 2012
Program Indicators Before
(2006-2008)
Interim
Period
2009
After
(2010-2012)
P value
Before and
After
NTIP2
Targets
Treatment started on the
recommended initial 4-drug
regimen (%)
84.5 78.0 94.2 0.040 93.4
Completion of treatment within
recommended 12 months period
(%)
82.4 90.2 90.6 0.013 93.0
Known HIV status at diagnosis
(%)
78.7 80.0 92.6 0.030 88.7
Contact index (CI) 8.0 14.6 22.0 0.044 -
Contact elicitation (%) 78.3 87.0 91.6 0.001 100.0
Contact evaluation (%) 61.0 61.0 70.0 0.070 93.0
Post implementation, the program has exceeded national targets for (1)
recommended initial therapy and (2) HIV status at the time of diagnosis; and
demonstrated improvements in other program indicators.
The percentage of cases completing treatment has increased significantly.
Psychosocial and cultural based factors influence the test seeking behavior
of contacts to cases. Further program changes are needed to address these
factors and achieve the NTIP goal for contact elicitation and evaluation.
This integrated approach resulted in improved program and patient
outcomes.
This model may be appropriate for other areas with similar tuberculosis
morbidity and staffing resources.Cost benefit analysis is recommended to identify
the budget gaps that this integrated model was able
to close as a result of the organizational
restructuring.
Maricopa County in Arizona is the fourth largest county in the U.S.
with an estimated population of 3.9 million residents.1
Maricopa County is a high tuberculosis (TB) morbidity area,
accounting for 50% of all reported cases in Arizona.
On an average, there are 125 cases per year, with a five year average
TB case rate of 3.2 per 100,000 population.
In 2009, the need to deliver more effective TB case management led to
the development of an integrated TB case management model.
Prior to 2009, TB case management was conducted
solely by registered nurses. An integrated model
partnering epidemiologists with nurse case managers
was initiated in May 2009.
Epidemiologists conduct the following tasks:
Home and work assessments to determine the risk
of TB transmission;
Provide education to the patients, community
providers and infection control practitioners
regarding prevention of transmission; and
Initiate a thorough investigation and evaluate
exposed contacts to prevent transmission within
the community.
Nurse case managers simultaneously conduct the
following clinical services:
Coordinate TB treatment including medication
management and directly observed therapy;
Provide TB medication education for patient and
family;
Coordinate clinical care and referrals; and
Coordinate with the social worker to assess the
social circumstances and incorporate social needs
into case management.
An intake database was created in October of 2009 to:
Track the incoming reports;
Track the case management assignment; and
Increase data accessibility.
LIMITATIONS
CONCLUSIONS
RESULTSINTERVENTIONBACKGROUND
109
138
153
117
108
2.8
3.5
4.0
3.1
2.7
0
0.5
1
1.5
2
2.5
3
3.5
4
4.5
0
20
40
60
80
100
120
140
160
180
2008 2009 2010 2011 2012
Ratepaer100,000Population
TotalCases
1U.S. Census Bureau. 2014. Quick Facts: http://quickfacts.census.gov/qfd/states/04/04013.html
2National TB Indicators Project; http://www.cdc.gov/tb/publications/factsheets/statistics/NTIP.htm