Presented on Thursday 7 September at the NCVO Campaigning Conference 2017.
Chris Walker, senior external relations officer, NCVO
Max Rutherford, criminal justice programme manager, Barrow Cadbury Trust
If you would like to find out more about our training and events, visit our website at https://www.ncvo.org.uk/training-and-events.
HeadStart Wolverhampton Stakeholders Consultation and Information Morningheadstartfm
Slides from the HeadStart Wolverhampton session at The Molineux on 13th September 2016. The event introduced delegates to the next phase of HeadStart Wolverhampton following the wonderful news that we have been awarded £8.8 million by The Big Lottery Fund to support the mental health and well-being of young people in the city.
FAMILY AND COMMUNITY INTEGRATION FOR STREET CHILDREN IN MOROGORO URBAN: A CRI...Elisha Magolanga
This study investigated the families and community integration with street children in Morogoro Urban. Specifically, this study sought to determine the awareness, magnitude of the problems facing street children, families and community involvement in their plight. This study included issues such as security, education, health, upbringing and accommodation issues affecting the street children in Morogoro Urban, the study design tried to reach hidden or hard to reach populations like street children, therefore case study research design was used in this study. Guided by Erik Erikson’s Psychosocial theory of socialization as an interactive and endless process. Purposive and Simple random sampling was used to obtain 50 respondents whereby 10 were street children, 20 were parents and 20 were other stakeholders. Data were collected by using focus group discussion, observation and structured interview schedule. The findings revealed that most of the respondents were aware of the presence and the magnitude of street children. The respondents also mentioned the places where street children were living and some of the problems facing them. However, most of the respondents said the community was not very serious with the street children’s problems, adding that the government was doing nothing to solve the problem and citing absence of places or special building for street children It is also learnt that community involvement is minimal, the community and families are not actively involved in the street children’s welfare, there are also no committee/organ dealing with street.
If you are not getting your favorite job? Then visit our website and have a look of our job section. Here you can get a myriad of best jobs. The job seekers are taking advantages of our services.
Connecting the Dots: Empowering Young Adults in Cedar RiversideJulia Eagles
This final capstone project was part of the Cedar-Humphrey Action for Neighborhood Collaborative Engagement (CHANCE) community-based research class, looking at educational and workforce development opportunities for young adults (ages 18-24) in the Cedar Riverside neighborhood. Research included a literature review, semi-structured interviews & focus groups with community members, and demographic & geospatial analysis. This paper includes key findings and recommendations for our clients.
Laadli, A campaign to help save the girl child and prevent gender selection a...Population First - Laadli
Laadli, A girl child campaign is Population First's campaign against sex selection and falling sex ratio.Join us by making your pledge against female feticide
http://laadli.org/
School Focussed Youth Service
Glen Eira, Port Phillip & Stonnington
Needs Analysis 2011
Current and emerging trends in wellbeing issues for
Young people in Glen Eira, Stonnington and Port Phillip
Asset Based Community Development and Youthworkbongsir
ABCD – 社工的角色
ABCD與青年工作
- ABCD, ABCD and youth work
- Changing the Paradigms about how we involve young people
- Unique contribution by young women and men
- 10 Commandments for involving young people in community
- 50 things adults can do with young men and women
- Be a Facilitators in ABCD
Evaluation of the People and Places Programme: 2010 report summaryWavehill
This presentation summarises the key finding from the third year of the People and Places programme evaluation.The full report is available on the Research and Learning section of the Big Lottery Fund (BIG) website, www.biglotteryfund.org.uk
Ealing Active Citizenship And Community Cohesion 27 03 09
YNS Report
1. Rusholme and Fallowfield Community Forum
in collaboration with
Trinity House Community Resource Centre
Youth Needs Survey
Report 2009
This report is prepared by
Jonny Wineberg
Consultant for Not-for-profit Organisations on behalf of the
South Manchester Regeneration Team, Manchester City Council
Dr Sandi Mann CPsychol
at the University of Central Lancashire.
The report consists of analysis using SPSS of questionnaire data
collected by the Rusholme and Fallowfield Community Forum. The
data was collected by the Forum using a questionnaire based on (but
adapted from) an original designed by Mann, Shaw and Wineberg
(1999) of The Jewish Youth Project.
3. 3
CONTENTS
Page
FOREWORD.................................................................................. 4
ACKNOWLEDGEMENTS.............................................................. 5
SECTION 1: RECOMMENDATIONS.............................................. 6
SECTION 2: METHODOLOGY ......................................................10
SECTION 3: FINDINGS
3.1 DEMOGRAPHICS ......................................................13
3.2 EDUCATION AND TRAINING.....................................16
3.3 WHAT ACTIVITIES DO THEY ATTEND?....................18
3.4 LIBRARY USAGE.......................................................26
SECTION 4: FINDINGS
4.1 WHERE DO THEY HANG OUT?................................30
4.2 TELECOMMUNICATIONS USAGE ............................35
4.3 WHAT ACTIVITY DO THEY WANT?...........................37
4.4 INVOLVEMENT IN YOUTH PROVISION....................40
4.5 WHAT DO THEY READ?............................................43
4.6 WHAT CONCERNS THEM?.......................................44
4.7 SUBSTANCE USE......................................................48
4.8 FOOD RELATED ISSUES..........................................50
4.9 SEXUAL ISSUES .......................................................52
4.10 GENERAL ISSUES ....................................................54
APPENDIX A: YOUTH NEEDS SURVEY QUESTIONNAIRE ........55
4. 4
Foreword to the South Central Manchester
2009 Youth Needs Survey Report
This Youth Need Survey Report is based on the responses of young people between 11
and 19 years of age to a questionnaire produced and distributed by the Project Team
made up of the Rusholme and Fallowfield Community Forum, Trinity House Community
Resource Centre and the Trinity House Youth Forum. The Project Team consulted with
Paul Mattis Trinity House, Jonny Wineberg Consultant South Manchester Regeneration
and Dr Sandi Mann CPsychol, at the University of Central Lancashire.
RUSHOLME AND FALLOWFIELD COMMUNITY FORUM
The Rusholme and Fallowfield Community Forum was established in March 2000 as a
result of an NHS Manchester Central Primary Care Trust initiative. Later the Forum
became an independent organisation, still retaining its emphasis on the promotion of the
good health and wellbeing of the people of Rusholme and Fallowfield. The Forum
became a Registered Charity in 2006.
The Forum’s primary role is to connect with the very diverse local communities to provide
information and promote good health and other related issues. This includes becoming
involved and supporting the activities of both local voluntary and public sector
organizations. In addition we provide a means for communication and networking
between these organisations.
WORKING WITH YOUNG PEOPLE
In the course of our work the Forum became increasingly aware of the need to expand
the provision for young people. In June 2007 we organised a meeting to “Develop
Partnership Working to Expand Youth Provision in South Central Manchester”. The
Speaker was Sue Brookes Chair of the East Manchester Youth Strategy Group. This
Group has been successful in expanding youth provision in their area. Some twenty six
people attended, representing seventeen organisations. The meeting highlighted the
need to increase the involvement of young people and the necessity of establishing a
Youth Forum. We then began to work in partnership with Trinity House Community
Resource Centre which resulted in the establishment of the Trinity House Youth Forum.
YOUTH NEEDS SURVEY FOR 11 TO 19 YEAR OLDS
As a result of the discussions with the young people in the Trinity House Youth Forum it
was agreed to conduct a Youth Needs Survey to identify the activities, needs, aspirations
and worries of young people. The Project Team produced a Youth Needs Questionnaire
consisting of over 100 questions with multi-choice answers; (See Appendix ‘A’); this was
based on an original designed by Mann, Shaw and Wineberg (1999) of The Jewish Youth
Project.
The project was funded by a “Cash Grant” from Manchester City Council’s Rusholme and
Fallowfield Wards.
CONTACTING YOUNG PEOPLE
The Project Team then set to work distributing and assisting young people to complete
the questionnaire. The plan of action was to target: youth groups; youth activities and the
Secondary Schools that service the South Central Manchester area. In this way we
hoped to not only get the views of young people who were involved in youth activities but
to also get the views of as wide a cross section of young people as possible.
This Youth Needs Survey Report is the product of this work
5. 5
Acknowledgements
We wish to thank the Councillors and Ward Support Teams of both Rusholme and Fallowfield for the
Cash Grant without which this Survey could not have been produced
We wish to thank:
Jonny Wineberg, Consultant for Not-for-profit Organisations on behalf of the South Manchester
R e g e n e r a t i o n T e a m , M a n c h e s t e r C i t y C o u n c i l ;
Dr Sandi Mann, CPsychol at the University of Central Lancashire and
Paul Mattis, Trinity House Community Resource Centre for all their hard work in the preparation of this
report.
We wish to express our thanks for their cooperation to the pupils and staff of:
Chorlton High School
Levenshulme High School for Girls
Loreto High School
Manchester Academy
St Peter’s RC High School
Trinity C of E High School
Whalley Range High School for Girls
Xaverian Sixth Form College
We also wish to thank the youth workers and young people of:
Hideaway Youth Project
Longsight Youth Centre
Manchester Youth Service
Moss Side Millennium Powerhouse Library
The Water Adventure Centre
Trinity House Community Resource Centre
Trinity House Youth Forum
Young Black Perspectives (BHA)
John Byrne
Chair, Rusholme and Fallowfield Community Forum
on behalf of the Youth Needs Survey Project Team
6. 6
Section 1: Recommendations
These recommendations are drawn from the research findings with appropriate extrapolations to make
them practical within the context of the area. Whilst drafted by the report’s authors, they have also been
endorsed by the Forum.
1.1. CULTURAL NEEDS
1.1.1 The diversity of ethnicity in the area means that all services delivered to young
people should ensure they are designed to meet the diverse cultural needs that
they bring. In practice this means including a review of cultural requirements into
all planning; monitoring uptake of services and the perception of their success by
ethnic groups and, for best practice, including young people from across the ethnic
spectrum in the design, delivery and evaluation of all services as well as policy.
1.2 EDUCATIONAL ASPIRATIONS
1.2.1 Whilst it is positive that over 50% of young people aspire to attend university, work
must be done with young men to raise their aspirations to the same level as young
women. Schools should review the messages they are giving to young men,
particularly to white young men who have lower aspirations, and invite in positive
role models from all ethnicities to engage with young people of their own ethnic
groups.
1.2.2 The use of longer term mentoring for all school pupils with lower aspirations should
be explored. This could include using University students but also sessions with
Community Youth Workers who are able to look holistically at young people’s
issues and identify positive actions with them.
1.3 ISSUES AFFECTING YOUNG PEOPLE
1.3.1 The high level of worries across a range of issues leads to a recommendation that
counselling provision be made more easily available to young people in
Manchester. This counselling should be provided by a qualified Youth Worker/
Counsellor or Psychologist with experience of working with this age group and
understanding of and experience of issues facing this client group. Specifically the
worker should be able to address issues around self-esteem, family relationships;
bullying, sexual health, eating disorders, mental health issues and careers (see
next section). Whilst it is not expected that the worker be able to deal with some of
the more serious problems themselves, they should be capable of making a
professional assessment of the problem and referring the individual, in an
appropriate manner, to the appropriate agency.
1.3.2 There is a strong need for careers guidance and counselling to supplement what is
available in schools. Providers of youth services should also have career guidance
material, university prospectuses, etc. for the use of young people. Connexions, or
other guidance professionals, should be easily accessible for young people, with
evening and weekend sessions and careers guidance workshops, and support for
Youth Workers to run them.
1.3.3 The higher level of worries across all issues from women shows the need for
gender specific support – to address the many issues that young women are
concerned about and to support young men in opening up and dealing with issues
that affect them.
1.3.4 The disparity in expectations of having sex before age 16 shows a further need for
work with young men on issues of sex and ensure that they develop respect for
themselves and young women. This is reinforced by the fact that young men
access less sources of information on sexual issues that young women do.
7. 7
1.3.5 Whilst the low level of reported use of illegal substances is encouraging, the
relatively high level of cocaine use is something to be addressed by police and
drugs services. Cocaine supply should be investigated and reduced however
possible and lowering demand should be the aim of drugs education programmes.
1.3.6 With self defence being rated the most important activity for girls and the second
most for boys, along with the high level of worry regarding guns and safety, priority
should be given to creating new programmes of self defence activity. This will
probably include both an element of physical defence as well as information/
discussion workshops on how best to keep safe.
1.3.7 With friends being the next highest source of support for serious problems after
parents, training in support and advice should be made available to young people
with development of peer mentoring and support being a priority.
1.4 PARENTS
1.4.1 There is a role for parents in running youth provision but it needs planning carefully
so as not to alienate those indicating that they did not wish parents to be involved.
1.4.2 A more significant role for parents is in supporting their children, as over 80%
indicated that they would go to parents as their first or second choice to talk to
about a serious problem. Parenting training, support and advice should be made
readily available in the area.
1.5 YOUTH WORK
1.5.1 Youth workers, both statutory and voluntary, should be encouraged to engage
young people in their homes – with their and their parents’ permission – both to
support them with issues and to have meetings with their peers. These could be
meetings to discuss needs, plan activity or even deliver youth work sessions.
1.5.2 Outreach in shopping centres, particularly to young women, should be explored by
youth providers. Both opportunities to engage with activity provided there, and the
promotion of other activity in youth clubs, and other settings, should be provided.
1.5.3 Outreach to young people in parks and on streets should be part of the youth offer
with both opportunities to engage with activity delivered there, and the promotion
of other activity in youth clubs, and other settings, provided.
1.5.4 Both Youth Clubs and Leisure Centres need to explore providing creative activities
for young women to give them an equal opportunity to participate as young men.
1.5.5 Youth Clubs in particular, but also Leisure Centres, need to use creative
programme planning to create diverse activities for young people. Use of the
NAOMIE (Needs, Aims, Objectives, Method, Implementation, Evaluation) planning
framework is recommended.
1.5.6 The priority for those delivering youth services should be to ensure diversity of
provision to meet the diverse preferences of young people across a whole range of
activities. The high importance given to all possible activities is both a challenge,
and an opportunity, for providers.
1.6 YOUTH PROVISION
1.6.1 Youth clubs should look to employ Peer Youth Workers (young people aged 14 to
19) to engage peers, promote what is on offer, bring them to youth provision and
involve them when they attend. Particular messages about youth provision being
planned, delivered and evaluated by young people should be used. The person
specification for Peer Youth Workers should include both maturity to undertake
the role and having existing networks that can be positively exploited.
8. 8
1.6.2 Rusholme and Fallowfield Forum, along with Manchester Youth Service, should
map provision to ensure that opportunities to participate in diverse provision are
as easily available as possible to all young people resident or studying in the area.
Actions should then be taken to fill such gaps through drawing in appropriate
partners.
1.6.3 Development of improved methods of publicity and communication of available
provision should be explored by Rusholme and Fallowfield Forum along with
Manchester Youth Service. The voluntary sector must be a true partner for young
people to gain a true sense of what is on offer and how to access it.
1.7 LEISURE PROVISION
1.7.1 Leisure centres should review both their offer to young people and the cost that it
is provided at. A special rate for teenagers would both make provision more
attractive and create a feeling that they are being positively targeted.
1.7.2 Leisure centres should review their offer to young women and undertake further
research with those not attending to identify both what activities and what
marketing would make them more attractive.
1.8 ISSUES FOR OTHER AGENCIES
1.8.1 Schools should review their after-school offer to young women and how better to
meet their needs. Schools could also explore greater partnership arrangements
with the voluntary youth sector to deliver more diverse opportunities.
1.8.2 The lower level of positive reasons for attending activities in places of worship,
and the high level attending because their parents want them to, suggests that
they have to both promote their activities more appropriately as well as design
them to better meet the needs of young people.
1.8.3 The overwhelming majority of young people that never attend Uniformed Groups
(Scouts etc.) suggests that these organisations need to look at how they market
their activities and core offer to young people to change perceptions, possibly with
regard to class and ethnicity. The possibility of increasing capacity by opening
satellite groups in community or youth centres should be explored.
1.8.4 Affordability of provision and investment in improved, and more diverse, provision
are key issues for young people. Manchester City Council should increase its
investment in provision for young people and, where possible, give discounts for
teenagers to access activities.
1.8.5 Rusholme and Fallowfield Forum, along with Manchester Youth Service, should
identify ways to improve fundraising support for voluntary and community
organisations.
1.8.6 Libraries should look to increase their appeal to young people and explore
creative ways to improve their offer. Internet and other competitions along with
informal sessions could be used to engage young people. Promotion of positive
and dynamic images of books should be undertaken. Libraries could engage
groups of young people to design publicity and sessions.
1.9 SPORT AND ARTS
1.9.1 With 88% of boys indicating that sport was very or quite important for them, it is
clearly a key engagement tool that should be used. However, this should not be at
the expense of the significant minority who have other priorities.
1.9.2 Whilst significantly fewer girls than boys rated sport as very or quite important for
them, over 70% still indicated it was important. A review of girl’s sports should be
9. 9
undertaken to verify whether there are sufficient opportunities for them to engage
in sporting activity and, if not, action should be taken to create such opportunities.
1.9.3 Arts provision (music, dance, media) are rated as important, particularly for girls.
Further investigation as to whether this should be delivered in single, or mixed,
gender groups should be undertaken with action taken to ensure appropriate
opportunities are created.
1.9.4 The significant number of people attending drama and enjoying it shows that it is
something that could engage more young people if there were more opportunities
to do so. Schools and youth groups should consider combining their resources to
expand this offer to young people.
1.9.5 With both dance and music significantly more important for those of dual heritage
than their peers, music and dance programmes that include positive images from
diverse cultures should be delivered with an emphasis on valuing diverse
backgrounds. Understanding where the art forms come from should be seen as
equally important to performance to have a positive impact on identity. Young
Roots Heritage Lottery funding should be sought to support this.
1.10 ENGAGEMENT AND INVOLVEMENT
1.10.1 Involving young people in the design, delivery and evaluation of services that
affect them should be seen as essential for all providers. This is a particular
challenge for those providers who have not, traditionally, worked in this way.
Leisure, libraries, places of worship and others should look to the publication
‘Hear by Right’ to see the standards to which they should aspire.
1.10.2 Over 140 individuals responding to this research indicated that they definitely
wanted to be involved in planning and delivering youth activities and youth
provision. Statistically, this means at least double would be interested. However,
even with that raw number, a huge opportunity exists for new youth leadership
which should be grasped. This should be done in partnership by all organisations
working with young people through Rusholme and Fallowfield Forum.
1.10.3 A Youth Forum General Meeting should be held at least annually with an open
invite to all young people as well as specifically to School Councils. Young people
should look to constitute this body, with a structure designed and agreed by them,
to embed participative practice in the area.
1.10.4 Training in peer education, peer mentoring and peer leadership should be
undertaken, with a collaborative approach involving all youth provision, to ensure
young people have the skills to lead the Youth Forum and engage proactively with
their peers and organisations providing services and activities for young people.
1.11 MARKETING
1.11.1 All providers should look to use phone texting, internet messaging, email to
communicate more effectively. The possibility of developing such a database in
partnership, possibly through the Rusholme and Fallowfield Forum, should be
explored and resources identified.
1.11.2 With almost three quarters of respondents looking at some part of the local
newspaper, almost double that of newsletters, discussions with the South
Manchester Reporter to include a regular Youth Page, including listings of
upcoming activities, should be initiated.
1
Hear by Right Local Government Association/National Youth Agency
10. 10
Section 2: Methodology
2.1 SURVEY DESIGN
2.1.1 The Project Team based the development of the survey on an original designed by Mann, Shaw
and Wineberg (1999) of The North Manchester Jewish Youth Project.
2.1.2 The questionnaire was designed with four domains of interest, information from each of which
would be expected to be valuable in the planning of future youth provision. These were:
Education & Training
Activities/Groups Attended
Social Life
Social Issues
2.1.3 Several items were specified within each domain. An item referred to a piece of information that it
was felt necessary or useful to find out, with respect to the domain. Each domain may thus have
several items associated with it.
2.1.4 The questions were written to give balance between practicality, acceptability and the need to be
scientific. The disadvantages of closed questions (i.e. that the frame of reference is externally
defined) were counteracted by open questions to provide opportunities for self-expression. Closed
questions in the questionnaire have the advantage of ease of analysis, as well as performing the
role of ‘lie-detectors’ to ensure that the answers participants put to the open questions are
correlated with their subsequent responses on later items. This also helped with weeding out any
participants who failed to give adequate thought to responding or who deliberately attempted to
mislead.
2.1.5 It should be noted that great care was taken to avoid questions that might prove embarrassing or
offensive to the young people, their parents or the community. However, this care was balanced
with the need to obtain the required information. Consequently, whilst some items were excluded
from the final survey (for instance, items asking about sexual abuse were felt to provide important
information, but might cause psychological disturbance in some victims which we would be unable
to respond to because of their confidential response), others were included (such as items on illegal
substance usage).
2.1.6 Each question was designed to correspond to items within each domain. The format adopted for
closed questions was standardised with a five point scale used as the standard measure. Open
questions were worded in plain English in order to elicit maximum response.
2.1.7 The survey was produced as a four side Youth Needs Questionnaire consisting of 35 questions
which, when broken down, gave information on over 100 items (See Appendix ‘A’).
2.2 DATA COLLECTION
2.2.1 The respondents were obtained via youth groups; youth activities over the summer and the
Secondary Schools that service the South Central Manchester area. The intent was to not only get
the views of young people involved in youth activities but also get the views of as wide a cross
section of young people as possible.
2.2.2 It was accepted that there would be no attempt to get a random sample of respondents but, rather,
to elicit responses from as large a number of the population as possible. Thus validity comes from
the breadth of the population responding.
2.2.3 772 young people completed the questionnaire with 735 sets of data being used, over 95%. 37
questionnaires were found to be not completed sufficiently or attempted to mislead.
2.2.4 A list of schools taking part is in the Acknowledgements. It should be stressed that many schools
were extremely supportive of The Forum’s work, with teachers and Heads going out of their way to
accommodate us. We were extremely encouraged by the co-operation and support from these
schools.
2.2.5 Care was taken to ensure that the young people understood the confidential nature of the survey
and that no names were asked for or wanted. It was stressed that no attempt would be made to
identify any respondent, even if they disclosed something illegal, immoral or dangerous.* It was felt
that most respondents did accept that their replies would be confidential and, judging by the
disclosures that many people made, it would seem that the findings reflect reasonable trust in our
assertion that confidentiality would be upheld.
11. 11
2.2.6 The young people were usually given at least twenty minutes to complete the survey and were
strongly encouraged to complete them on their own, before placing them in a large envelope with
all the others (to ensure confidentiality). Participation was voluntary and a small number did not
complete questionnaires.
2.2.7 A list of youth clubs/movements taking part is included in the Acknowledgements. Workers met with
leaders of various youth organisations in the area and administered the surveys in a similar manner
as with the schools. Once again, confidentiality was stressed.
2.2.8 It should be noted that most of the data was collected at schools since the questionnaires were
easier to administer in the more formal environment offered by schools, and young people were
more accessible via schools than by youth groups. Numbers attending youth groups varied so that
several visits would be needed to reach every attender. Usually, only one visit is required to a
school as only a small percentage of pupils are absent on any one day.
* The downside of confidentiality merits a mention here. It meant that workers were unable to
respond to any of the individual needs that were apparent from respondents.
2.3 DATA ANALYSIS
2.3.1 A number of statistical tests are performed on the data using Statistical Processing for Social
Sciences (SPSS) computer package. The qualitative data was collated manually. This section will
explain briefly what tests are used in this Report and what they mean.
2.3.2 Means
Means are averages taken across a range of scores. So, for example, if possible responses for a
question are in the range of 1 (unimportant) to 5 (very important), then a mean score for that
question would be the average score given by all the participants for that question.
2.3.3 Independent t-tests
This is a procedure that allows the scores of two groups to be compared. For example, if we want
to know whether there is a difference between how often males and females attend leisure centres,
we can just look at the spread of scores across that question. If, however, we want to know whether
that difference is statistically significant (and could not have occurred just as a result of chance
factors), then a t-test will calculate the probability of the difference happening to chance factors. If
the probability calculated is less than 0.5, it is generally accepted that the difference is unlikely to
have happened by chance – i.e. we can safely conclude that any differences between our two
g r o u p s i s i n d e e d , s i g n i f i c a n t .
T-tests yield three ‘results’; a t score, degrees of freedom (df) and a probability value. These are
generally placed within a ‘statistical data’ box within this report and can usually be ignored by all but
the most statistically-minded reader.
2.3.4 Analysis of Variance
Analysis of variance, or ANOVA, is used to find differences between groups just like t-tests – but is
used when we have more than two groups to compare. So, if we want to compare males and
females, we can use t-tests, but if we want to see if ethnic groups differ on some score, then,
because there are 5 ethnic groups, an ANOVA is performed.
The same probability of 0.5 is used as the cut-off to inform us as to whether a difference between
the groups is statistically significant – or, to put it another way, whether there is a significant effect
of ethnicity on the score in question.
If a significant difference is revealed (i.e. the p value comes out as less than 0.5), we then need to
know where the difference lies i.e. which groups differ significantly from which other groups. Often,
looking at the spread of scores makes this obvious, but another statistical test, referred to as a
‘post-hoc’ test, will give us this information in more scientific terms (two groups may appear
different but in actuality, they may not be significantly different – a post hoc test will tell us this.)
2.3.5 Correlations
Correlations allow relationships between two variables (items or questions) to be calculated. For
example, we might wish to know if scores on one question (or variable) correlate (are related to)
those on another question (or variable). A correlation statistical test yields a correlation ‘coefficient’
which will be between -1 and +1. a coefficient of 0.00 means that there is no relationship between
the two items whereas a correlation of 1.00 indicates a perfect relationship.
A correlation coefficient of, say 0.6, might sound quite high, but we also need to know if that
correlation could have occurred by chance, or if it is statistically significant. To this end, the
12. 12
probability of that relationship between the two variables occurring by chance is also calculated and
this yields a ‘p’ or probability value. If the probability calculated is less than 0.5, it is generally
accepted that the relationship observed is unlikely to have happened by chance – i.e. we can safely
conclude that any relationship occurring between our two variables is indeed, significant.
Correlations then, yield two scores; a p value and an r. These are generally placed within a
‘statistical data’ box within this report and can usually be ignored by all but the most statistically-
minded reader.
2.4 DEVELOPMENT OF RECOMMENDATIONS
2.4.1 Once the findings had been produced from the data analysis, the project team explored them to
identify themes, indications and arguments and draw conclusions from them.
2.4.2 Recommendations drawn from one set of findings were checked against qualitative input as well as
other findings to maximise their validity.
2.4.3 It is recognised that some recommendations may be debated and this is healthy as we wish people
not only to take them on board but also to draw their own conclusion to benefit young people.
13. 13
Section 3
3.1 DEMOGRAPHICS
3.1.1 Usable data
733 sets of usable data were returned.
3.1.2 Gender
41% (301) of those who completed this item were male and 53% (388) female (with 44 undeclared cases).
3.1.3 Disability
6% of respondents (38 people) who completed this item, declared themselves as having a disability, with 94% (623)
declaring themselves not to have a disability. 72 respondents did not complete this item.
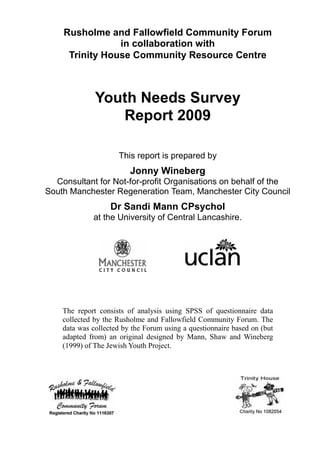
3.1.4 Ethnicity
Around a third (who responded to this item) classed themselves as White British. The next largest grouping was Black
British (12%) followed by Pakistani (11%) and Dual Heritage (10.7%). 72 respondents did not answer this question.
Fig 3.1.1 shows the percentages of respondents falling within each ethnic category.
Fig 3.1.1: The percentages of respondents falling within each ethnic category
32
12 11 11
7
5 5
4 4 4
3 3
1 1
0
5
10
15
20
25
30
35
WhiteBritishBlackBritishPakistani
Dualheritage
SomaliOtherAsian
OtherAfricanCarribeanBangladeshi
Irish
OtherEuropean
Indian
Chinese
MiddleEastern
14. 14
Because there were so many ethnic categories, the group size of some of the groups was too small for meaningful
analysis. Thus, some groups were combined in order to yield more useful categories as shown in Fig 3.1.2.
Fig 3.1.2: Percentage of respondents falling within new ethnic categories
3.1.5 Schooling
The overwhelming majority of respondents (94%) attend a comprehensive school with 2% attending a grammar
school, 1% attending a private school and 0.4% being home-schooled.
AGE
Fig 3.1.3: The percentages of respondents within each age group.
37
28
15
12
11
0
5
10
15
20
25
30
35
40
White British
/European
Asian Black
British/Carribean
African Dual Heritage
10
36 36
10
0
5
10
15
20
25
30
35
40
age11-12 age13-14 age15-16 age17-18
15. 15
SCHOOL YEAR
Fig 3.1.4: The percentages of respondents within each school year
POSTCODE
Fig 3.1.5: The percentages of respondents living within each postcode region.
8
6
16
26
18
7
3
0
5
10
15
20
25
30
year 7
year 8
year 9
year 10
year 11
year 12
year 13
7
6
11
3
11
6
7
5
14
0
2
4
6
8
10
12
14
M12 M13 M14 M15 M16 M18 M19 M20 M21
16. 16
3.2 EDUCATION AND TRAINING
3.2.1 Study Aspirations
There was one forced option item asking about study aspirations and the item has two parts to it. The question asks
how far the respondent wants to study and how far they think their parents want them to study. There were 9 available
options to choose from, ranging from ‘leave school without qualifications’ to ‘University degree’.
The overwhelmingly popular response was ‘University degree’ with 61% selecting this as their own study aspiration
and 57% as the option they felt their parents would choose for them. Percentages selecting each of the other 8 options
were too small to allow any meaningful analysis so much of the analysis in this section will focus on percentages
selecting the University degree option.
There was a significant correlation between how far the respondents wanted to study to and how far they felt their
parents wanted them to study to.
3.2.2 Gender differences
There were some gender differences. 54% of male respondents aspired to a university education compared with 68%
of females. The difference between study aspirations of boys and girls was statistically significant such that girls have
higher aspirations than boys.
Statistical data: The average score across the 9 options for boys was 7.5
whilst the average score for girls was 8. (t = 3.3, df = 545, p <0.05
53% of boys felt that their parents wanted them to get a University education compared with 61% of girls. However,
the difference across the range of 9 options was not significant this time (mean for boys = 7.7, mean for girls = 8).
3.2.3 Ethnic breakdown
The following chart (3.2.1) shows the percentages of each (combined) ethnic grouping that aspires to go to University.
Fig 3.2.1 Percentages of ethnic groupings aspiring to study at University
56
68
61
74
66
0
10
20
30
40
50
60
70
80
White British
/Europea n
Asian Bla ck
British/Ca rribe an
Africa n Dua l He ritage
17. 17
One-way analysis of variance performed on the means across the 9 categories reveals that there is a significant effect
of ethnic origin with the area of significance lying within the white/African categories).
There are no significant differences for the variable of parental views on academic aspirations for respondents of
various ethnic backgrounds.
When examining the males only, the ethnic group with the most respondents aspiring to University education is those
with Dual Heritage background (71%) whilst the ethnic groups with the lowest percentage of respondents aspiring to
University education is White/British (48% or 51 people). Fig 3.2.2 shows the percentages of boys within the various
ethnic groupings aspiring to study at University
Fig 3.2.2 Percentages of boys within ethnic groupings aspiring to study at University
3.2.4 Career choice
Included in this section was an open question asking respondents to suggest a job or career that they want to end up in.
The most commonly mentioned profession was the medical profession (including midwife, doctor, nurse etc) with 41
young people stating this as their desired career. This was followed in popularity by the legal profession with 18
mentions. Other popular choices were teaching (often PE teaching) with 11mentions, sports (footballer, rugby player
etc) with 10 mentions, music industry (10), army (9), beauty/hair industry (9), acting (8), childcare (8) and veterinary/
animal care.
Other careers getting smaller votes include fashion (6), writer/journalist (6), business (6), social care (5), accountancy
(4), air hostess (4), pilot (4), engineer (4),plumber (4), computing (4), police (4) and dancer (4).
More unusual career aspirations included ‘something creative and Islamic’, ‘Aston Martin car designer’, video games
tester, events organiser, TV presenter, ‘owning a horse riding school’, working for the UN, baker and funeral director
(it is possible that some of these could be family businesses).
48
59
45
63
71
0
10
20
30
40
50
60
70
80
White British
/European
Asian Bla ck
British/Ca rribean
African Dual Heritage
18. 18
3.3 WHAT ACTIVITIES DO THEY ATTEND?
This section began with an item that listed various venues and asking respondents to indicate whether they attended
each venue once a week, monthly, four times a year, once a year or never. The next item then asked respondents to
give reasons for their level of attendance at each venue; a range of possible reasons was offered for respondents to
select from (enjoy what is on offer, because their friends go, because they have nothing better to do or because their
parents want them to go).
The data for each venue will be presented separately.
LEISURE CENTRE
Fig 3.3.1: Percentages of male and female respondents attending leisure centres
Statistical analysis (using an independent t-test) suggests that there is a significant difference between how often males
and females attend leisure centres such that males attend more frequently than females (mean for males = 2.58, mean
for females = 3.23; please note that the lower the score the more frequently respondents attend)
Reasons for attending ranged from going because they enjoy what is on offer, going because their friends go, because
they have nothing better to do or because their parents want them to go (see Fig 3.3.2).
27
16
22
17
8 8
4
6
19
29
20
24
0
5
10
15
20
25
30
1xweek 1xmonth 4xyear 1xyear never no answer
male
female
19. 19
Fig 3.3.2: Percentages of male and female respondents giving various reasons for
attending leisure centres
YOUTH CLUB
Fig 3.3.3: Percentages of male and female respondents attending youth clubs
Statistical analysis (using an independent t-test) suggests that there is a significant difference between how
often males and females attend youth clubs such that males attend more frequently than females (mean
males = 3.3, mean females = 3.7; please note that the lower the mean score the more frequently
respondents attend).
37
27
14
10
3
5
2
1
0
5
10
15
20
25
30
35
40
enjoy friends go nothing
better
parents
males
females
22
17
10
7
3
5 5 5
35
42
25 25
0
5
10
15
20
25
30
35
40
45
1xweek 1xmonth 4xyear 1xyear never no answer
male
female
20. 20
Fig 3.3.4: Percentages of male and female respondents giving various reasons for
attending youth clubs
DRAMA / DANCE / MUSIC
Fig 3.3.5: Percentages of male and female respondents attending drama/dance/music
Statistical analysis (using an independent t-test) suggests that there is a significant difference between how
often males and females attend drama/dance/music workshops such that females attend more frequently
than males (mean males = 3.9, mean females = 3.3; please note that the lower the mean score the more
frequently respondents attend).
17
14
15
11
5 5
2 2
0
2
4
6
8
10
12
14
16
18
enjoy friends go nothing
better
parents
males
females
14
28
4
5
3 3 3
2
45
40
31
23
0
5
10
15
20
25
30
35
40
45
1xweek 1xmonth 4xyear 1xyear never no answer
male
female
21. 21
Fig 3.3.6: Percentages of male and female respondents giving various reasons for attending drama/dance/music
SPORT ACTIVITY
Fig 3.3.7: Percentages of male and female attending sport activity
Statistical analysis (using an independent t-test) suggests that there is a significant difference between how
often males and females attend sports activity such that males attend more frequently than females (mean
males = 1.8, mean females = 3.1; please note that the lower the score the more frequently respondents
attend).
17
28
5 5
3 2 2
0
0
5
10
15
20
25
30
enjoy friends go nothing
better
parents
males
females
62
26
8
9
3 5
1
4
14
31
13
25
0
10
20
30
40
50
60
70
1xweek 1xmonth 4xyear 1xyear never no answer
male
female
22. 22
Fig 3.3.8: Percentages of male and female respondents giving various reasons for attending sports activity
AFTER SCHOOL ACTIVITIES
Fig 3.3.9: Percentages of male and female respondents attending after school activities
Statistical analysis (using an independent t-test) suggests that there is a significant
difference between how often males and females attend after school activities such that
males attend more frequently than females (mean males = 2.7 mean females = 3.3;
please note that the lower the score the more frequently respondents attend).
58
29
8
6
2
5 2
1
0
10
20
30
40
50
60
enjoy friends go nothing
better
parents
males
females
29
22
13
10
5
4 4
5
24
35
25 25
0
5
10
15
20
25
30
35
1xweek 1xmonth 4xyear 1xyear never no answer
male
female
23. 23
Fig 3.3.10: Percentages of male and female respondents giving various reasons for attending after school activities
CHURCH / OTHER PLACES OF WORSHIP ACTIVITIES
Fig 3.3.11: Percentages of male and female respondents attending church/places of
worship activities
Statistical analysis (using an independent t-test) suggests that there is no significant difference between
how often males and females attend after church activities.
28
21
12
9
5 5
2 3
0
5
10
15
20
25
30
enjoy friends go nothing
better
parents
males
females
25
23
8
9
5 5
6
8
31
36
24
21
0
5
10
15
20
25
30
35
40
1xweek 1xmonth 4xyear 1xyear never no answer
male
female
24. 24
Fig 3.3.12: Percentages of male and female respondents giving various reasons for attending church/places of
worship activities
UNIFORMED GROUPS (SCOUTS ETC)
Fig 3.3.13: Percentages of male and female respondents attending Uniformed groups
(Scouts etc)
Statistical analysis (using an independent t-test) suggests that there is no significant
difference between how often males and females attend Uniformed groups (Scouts etc).
16
19
3
2 2
1
16 16
0
2
4
6
8
10
12
14
16
18
20
enjoy friends go nothing
better
parents
males
females
6
4
2 1 2 2 2 2
56
61
32
31
0
10
20
30
40
50
60
70
1xweek 1xmonth 4xyear 1xyear never no answer
male
female
25. 25
Fig 3.3.14: Percentages of male and female respondents giving various reasons for attending Uniformed groups
(Scouts etc)
3.3.1 WHAT IS GOOD ABOUT THE PROVISION?
This item suffers from some limitations in that the questionnaire was designed so that this qualitative item
actually refers to the seven items listed in the previous two questions. This means that it cannot be known
which of the seven items respondents are referring to when they say what is good about the ‘provision’.
Many people talk about the ‘provision’ being enjoyable, it keeping them busy or off the streets and the
social benefits.
3.3.2 WHAT COULD BE IMPROVED?
This item suffers from the same limitations as above. However, comments about what could be improved
are more useful even without knowing the context of which venue they are referring to as they are likely to
reflect a need for some kind of provision. Repeated requests for improvement include:
More things to do (this is mentioned frequently in some form or other), more youth clubs, better opening
times, cleaner facilities, more activities/facilities, more local facilities, more variety, better equipment, better
staffing, financial improvements (e.g. cheaper entry, funding for trips, special rates for young people etc),
better security, better accessibility, better swimming facilities (bigger pool), better toilet facilities, food,
better awareness made of what is available.
8
4 4
2 2 2 2
1
0
1
2
3
4
5
6
7
8
enjoy friends go nothing
better
parents
males
females
26. 26
3.4 LIBRARY USAGE
This item asked respondents how often they used the library for various purposes.
BORROWING BOOKS
Fig 3.4.1: Percentage of male and female respondents using the library for borrowing
books
BORROWING VIDEOS / DVD
Fig 3.4.2: Percentage of male and female respondents using the library for borrowing
videos/DVDs
13
19
14
22
10 10 10
9
43
30
0
5
10
15
20
25
30
35
40
45
1xweek 1xmonth 4xyear 1xyear never
male
female
7
3
10 10
3
6 5 6
56
52
0
10
20
30
40
50
60
1xwee k 1xmonth 4xyea r 1xyear ne ve r
male
female
27. 27
ACCESSING INTERNET
Fig 3.4.3: Percentage of male and female respondents using the library for accessing
Internet
MEETING FRIENDS
Fig 3.4.4 Percentage of male and female respondents using the library for meeting
friends
26
29
9
12
4 4
5
7
46
35
0
5
10
15
20
25
30
35
40
45
50
1xweek 1xmonth 4xyear 1xyear never
male
female
20 20
5
9
4
3 3 4
52
46
0
10
20
30
40
50
60
1xweek 1xmonth 4xyear 1xyear never
male
female
28. 28
3.4.1 BREAKDOWN BY DISABILITY
Of particular interest here is the percentage of respondents who never use the library for
various purposes. The following chart (Fig 3.4.5) shows little differences for disabled/non-
disabled except for when it comes to borrowing videos/DVDs with those with disabilities
more likely to use the library for this purpose than those without disabilities (please note
that the chart shows those never using the library so if 45% of disabled never use the
library for borrowing videos then 55% of disabled do use it for this purpose). Across the 1-
5 options (once a week – never) there was no significant difference however between the
two groups for this item. It should be noted, however, that numbers of disabled
respondents are really too low in comparison to non-disabled to make meaningful
comparisons.
Fig 3.4.5: Percentages of disabled and non-disabled respondents NEVER using the
library for various reasons.
Fig 3.4.6: Percentages of disabled and non-disabled respondents who use the library
once a month or more for various reasons
37 36
45
56
40 40
47
49
0
10
20
30
40
50
60
books video internet friends
Disabled
Non-disbld
37
35
13
15
29
39
13
15
0
5
10
15
20
25
30
35
40
books video internet friends
Disabled
Non-disbld
29. 29
3.4.2 BREAKDOWN BY ETHNIC BACKGROUND
The following chart (Fig 3.4.7) shows the percentages of respondents who never use the library for various
purposes. Thus, the lower the percentage, the more actually do use the library for that purpose. The chart
thus shows that Africans have the lowest percentages of ‘never’ using the library suggesting that these
groups use the library more than other groups.
Fig 3.4.7: Percentages of different ethnic groups who NEVER use the library for various
reasons.
Analysis of variance shows a significant effect of ethnic group for library usage when it comes to using the
library to meeting friends and using it to access the internet. In each case, the area of significance lies with
the difference between usage of White British and African individuals (such that African group use the
library more).
Fig 3.4.8: Percentages of respondents of various ethnic groups who use the library once
a month or more for various reasons.
0
10
20
30
40
50
60
70
books video internet friends
white British/E uropean Black B ritish/Carribean African asian dual
0
10
20
30
40
50
60
books video internet friends
whit e B ritish/European Blac k B ritish/Carribean Afric an as ian dual
30. 30
Section 4
4.1 WHERE DO THEY HANG OUT?
Here, respondents were given a list of various venues and asked to indicate how often they ‘hang out’ there.
Options included pubs/bars/nightclubs, youth clubs, home, friends’ homes, leisure centre, shopping centre,
amusement complex, cinema, arcades/betting shops, parks and streets/outside shops.
The following chart (Fig 4.1.1) shows the percentages of respondents in each school year who hang out
‘often’ at each of the various places listed in the questionnaire.
Fig 4.1.1: Percentages of respondents in each age range who hang out ‘often’ at each of
the various places
4.1.1 SCHOOL YEAR BREAKDOWN
The following charts shows the mean scores for each item; the higher/bigger the score, the more
frequently respondents in that school year hang out in that place (so, in the Year 7 chart below, hanging
out at home at 3.5 is the most frequent destination with pubs at 0.4 being the least frequent). Please note
that the scores from the surveys have been reversed in order to present the results more clearly (in the
surveys, smaller scores i.e. those closer to 1 indicate higher frequency which is the opposite to how the
charts are presented).
0
10
20
30
40
50
60
70
pubsyouth
clubs
hom
e
friends
hom
esleisure
ctrs
shops
am
use
com
plx
cinem
a
arcades
park
street
age 11-12
age 13-14
age 15-16
age 17-18
age 19
31. 31
Fig 4.1.2: Year 7 Mean Hang out scores
Fig 4.1.3: Year 8 Mean Hang out scores
Fig 4.1.3: Year 9 Mean Hang out scores
0.4
1.3
3.5
3.2
2.2
2.7
2.3
2.8
1.1
3
1.8
0
0.5
1
1.5
2
2.5
3
3.5
Pubs
youth
home
friends hm
leisure
shop
amuse
cinema
arcades
park
street
0.2
1.1
3.6
2.8
1.8
2.8
2.1
2.6
1.5
2.7
1.8
0
0.5
1
1.5
2
2.5
3
3.5
4
Pubs
youth
hom
e
friends
hm
leisure
shop
am
usecinem
aarcades
park
street
0.4
0.9
3.6
2.9
1.7
2.8
2.2
2.6
1.3
2.8
2.2
0
0.5
1
1.5
2
2.5
3
3.5
4
Pubs
youth
hom
e
friends
hm
leisure
shop
am
usecinem
aarcades
park
street
32. 32
Fig 4.1.4: Year 10 Mean Hang out scores
Fig 4.1.5: Year 11 Mean Hang out scores
Fig 4.1.6: Year 12 Mean Hang out scores
0.7
1.4
3.4
2.9
1.6
3
2.2
2.7
1.3
2.6
2.3
0
0.5
1
1.5
2
2.5
3
3.5
Pubs
youth
hom
e
friends
hm
leisure
shop
am
usecin
em
aarcades
park
street
1.1
1.7
3.6
3.1
1.8
2.9
2.1
2.8
1.5
2.6 2.6
0
0.5
1
1.5
2
2.5
3
3.5
4
P
ubs
youth
hom
e
friends
hm
leisure
shop
am
usecinem
aarcades
park
street
2.1
1.2
4.7
4.3
1.6
2.7
2.1
2.7
0.9
2.6
1.5
0
0.5
1
1.5
2
2.5
3
3.5
4
4.5
5
Pubs
youth
hom
e
friends
hm
leisure
shop
am
usecinem
aarcades
park
street
33. 33
Fig 4.1.7: Year 13 Mean Hang out scores
4.1.2 GENDER DIFFERENCES
The following table (4.1.1 ) shows the mean scores for males and females across the 5 point range for each
item. The lower the score (i.e. the closer to 1) the more frequently that place is frequented. The table also
shows whether the difference between the mean scores for males and females for each item is statistically
significant.
Table 4.1.1 Means and significance for males/females for each venue
2.1
1.9
3.1
3.3
2.4
2.9
2.1
2.8
1
2.4
1.8
0
0.5
1
1.5
2
2.5
3
3.5
Pubs
youth
hom
e
friends
hm
leisure
shop
am
usecinem
aarcades
park
street
Item
Mean
males
Mean
females
Significant
difference?
Analysis data
Pubs/bars/nightclubs 3.9 4.2
Youth clubs 3.4 3.7
t = -3.36, df = 513.6,
p < 0.005
Home 1.9 1.4 approaching p = 0.05
Friends’ homes 2.0 1.9
Leisure centre 3.0 3.4
t = -3.4, df = 558,
p < 0.005
Shopping centre 2.6 1.8
t = 7.5, df = 472.7,
p < 0.005
Amusement complex 2.8 2.7
Cinema 2.4 2.3
Arcades/betting shops 3.6 3.8 approaching p = 0.05
Park 2.3 2.4
Streets/outside shops 2.6 3.0
t = -3.2, df = 586.5,
p < 0.005
34. 34
4.1.3 ETHNIC DIFFERENCES
A one-way analysis of variance was performed in order to ascertain whether there are any significant
effects of ethnicity for any of the items. This showed that there were significant effects of ethnicity for 5 of
the 11 items: pubs, youth clubs, friend’s homes, leisure centres and the cinema. The Means for each of
these items for the ethnic groups are shown in the table below (Table 4.1.2) and illustrated in the chart (Fig
4.1.8):
Table 4.1.2: Mean scores for attendance at venues for each ethnic group
Fig 4.1.8: Mean scores for attendance at venues for each ethnic group
Post-hoc tests (Tukey) revealed that the significant effects were due to the following between-group
differences:
Pubs: The White British/European sub group differed significantly from the Asian. The Asian group also
differed significantly from the Black British/Caribbean group and the ‘Dual Heritage’ group.
Youth clubs: The White British/European group different significantly from the Black British/Caribbean
group. The Black British/Caribbean group also differed significantly from the Asian group. The African group
differed from the Asian group too. The Asian group differed from the Dual Heritage group.
Friend’s homes: the White British/European group differed significantly from both the African group and
the Asian group. The Dual Heritage group also differed from the African group and the Asian group.
Leisure centres: White British/European differs from Asian.
Cinema: Dual Heritage differed significantly from Asian.
pub youth friends leisure cinema
White British/European 3.9 3.9 1.8 3.1 2.3
Black British/Caribbean 4.0 3.0 2.0 3.2 2.4
African 4.3 3.3 2.3 2.0 2.2
Asian 4.6 4.0 2.3 2.6 2.5
Dual Heritage 3.6 3.4 1.6 3.0 2.0
0
0.5
1
1.5
2
2.5
3
3.5
4
4.5
5
p ub youth friends le isure cine ma
W hite British/european
Black Britis h/C arribean
African
asian
dual
35. 35
4.2 TELECOMMUNICATIONS USAGE
The following chart (Fig 4.2.1) shows the percentage of respondents who use various telecommunications
or computer activities (mobile phones, texting, World Wide Web, internet messaging, email and computer
games) daily, weekly, monthly, rarely or never.
Fig 4.2.1: Percentage of respondents who use various telecommunications or computer
activities
4.2.1 GENDER BREAKDOWN
Independent t-tests suggest that the only significant gender differences are with the usage of the World
Wide Web and computer games; in both cases males use these more often than females. The charts below
illustrate usage for males (Fig 4.2.2) and females (Fig 4.2.3).
Fig 4.2.2: Percentages of males using computer/telecommunications
62
21
66
17
64
17
57
19
40
24
35
24
0
10
20
30
40
50
60
70
80
90
100
mob
phon
text WWW int
mess
email comp
gms
never
rarely
monthly
weekly
daily
59
25
64
17
72
14
60
19
44
24
64
17
0
10
20
30
40
50
60
70
80
90
100
mob
phon
text W WW int
mess
email comp
gms
Male
never
rarely
monthly
weekly
daily
36. 36
Fig 4.2.3: Percentages of females using computer/telecommunications
65
19
68
17
59
19
57
18
38
25
68
17
0
10
20
30
40
50
60
70
80
90
100
mob
phon
text W WW int
mess
email comp
gms
Female
never
rarely
monthly
weekly
daily
37. 37
4.3 WHAT ACTIVITY DO THEY WANT?
Respondents were provided with a list of possible activities that they might want for them and their friends
in the area. The following chart (Fig 4.3.1) indicates the percentages of boys and girls who indicated that
each area of provision was ‘very’ or ‘quite’ important to them.
Fig 4.3.1: Percentages of boys and girls who indicated that each area of activity was
‘very’ or ‘quite’ important to them
4.3.1 GENDER DIFFERENCES
In order to ascertain whether the gender differences in the provision they want is significantly different, a
series of t-tests were performed to compare the mean score of males and females given for each item.
Thus, whilst the above chart (Fig 4.3.1) shows the distribution of scores 1 or 2, the following analyses
consider the full ranges of scores (i.e. 1- 5 where 1 indicates that the respondent considers the item very
important and 5 not at all important). The results are summarised in the table (Table 4.3.1) below. Where
differences are significant, the direction can be summarised by examining the means.
40
45
50
55
60
65
70
75
80
85
90
95
sports
health
selfdefencequalificsenterprise
music
dancearts/medialeadershp
creativeplay
holidayclubsinfo/adviceparenting
foodtrips/resisvolunteer
male
female
38. 38
Table 4.3.1: Male and female means and significances for activity requests.
Data provided for research purposes of academic rigour.
4.3.2 ETHNIC DIFFERENCES
A one-way analysis of variance was performed in order to ascertain whether there are any significant
effects of ethnicity for any of the items. This showed that there were significant effects of ethnicity for just 3
of the 16 items which were health workshops, dance and music. However, no significant between-group
differences were uncovered for health. The significant differences for the remaining two items lay in the
following groups:
Dance: The Dual Heritage differed from Asian (see Fig 4.3.2).
Music: White British/European differed from Asian, Black British/Caribbean from Asian and Asian from
Dual Heritage. (see Fig 4.3.3)
Fig 4.3.2: Ethnic breakdown for how important dance workshops are
0
10
20
30
40
50
60
70
80
90
White British
Black/Carribean
African
asian
dual
dance
unimport
not very
don't know
quite imp
very imp
Item
Male
mean
Female
mean
Significant
difference?
Statistical data *
Sport 1.5 2.1 t = -6.64, df = 621, p < 0.05
Health workshops 2.5 2.4
Self defence 1.9 1.9
Qualifications 2.1 2.0
Enterprise 2.5 2.5
Music 2.1 2.0
Dance 2.9 2.1 t = 7.5, df = 470.4, p < 0.05
Arts/media 2.5 2.2 t = 3, df = 485.3, p < 0.05
Leadership 2.6 2.5
Creative play 2.6 2.5
Holiday clubs 2.6 2.4
Information 2.4 2.3
Parenting 2.5 2.3
Food 2.1 2.2
Trips 2.2 2.1
Volunteering 2.7 2.4 t = 2.48, df = 484.6, p < 0.05
39. 39
ETHNIC BREAKDOWN
Fig 3.15: Ethnic breakdown for how important music workshops are
4.3.3 DISABILITY
The numbers of disabled respondents are too small in comparison to non-disabled to allow meaningful
comparisons. However, Independent t-tests revealed no significant effects of disability on the responses
given to items in this section. The ‘sports’ item was approaching significance (p = 0.05).
4.3.4 CORRELATIONS
There is a significant correlation between the results for question Q11A (how important is it for you to have
sports in your area) and Q4D (how often do you attend sports) such that the more frequently they attend,
the more important they think it is to have that provision.
Statistical data: (r = 4.5, p < 0.05)
There is a significant correlation between Q11 F and G (how important is it for you to have music/dance
provision in your area) and Q4C (how often do they attend drama/dance/music groups) such that the more
frequently they attend them the more important they think this provision is.
Statistical data: (music: r = 2.3, P < 0.05; dance: r = 3.3, p < 0.05)
There is a significant negative correlation between Q11D (how important is it for you to have opportunities
for qualifications in your area) and Q2 (how far do you want to study?) such that the higher qualifications
they aspire to, the more important they think it is to have opportunities for qualifications in their area
Statistical data: (r = -1.86, p < 0.05)
0
10
20
30
40
50
60
70
80
90
W
hite British
Black/Carribean
African
asian
dual
Music
unimport
not very
don't know
quite imp
very imp
40. 40
4.4 INVOLVEMENT IN YOUTH PROVISION
4.4.1 HOW INVOLVED SHOULD YOUNG PEOPLE BE?
The following chart (Fig 4.4.1) shows the percentage responses (male and female) for the question of how
involved respondents felt young people should be in the running of youth provision.
Fig 4.4.1: Percentage responses (male and female) for the question of how involved
respondents felt young people should be in the running of youth provision.
Independent t-tests show no significant gender difference between scores overall for this item.
4.4.2 HOW INVOLVED WOULD YOU LIKE TO BE?
The next question asked participants if they would like to be involved in planning and delivering youth
activities and youth provision. The following chart (Fig 4.4.2) shows the gender breakdown of responses.
There are no significant gender differences.
Fig 4.4.2: Gender breakdown for how involved in provision respondents would like to be.
4.4.3 ETHNIC DIFFERENCES
Analysis of variance revealed a significant effect of ethnicity on how involved respondents were in youth
provision*. Further tests reveal that responses by the African group differed significantly from the other
34
29
36
41
18
22
6
3 2 2
0
5
10
15
20
25
30
35
40
45
very quite don't knw little not at all
male
female
19
17
44
51
26
25
0
10
20
30
40
50
60
definitely possibly no
male
female
41. 41
groups. The chart below (Fig 4.4.3) shows that this difference is such that the Somali/African group
indicated a greater desire to be involved in running youth provision than the other ethnic groups.
Statistical data: (df=4, F=5.11, p<0.05). Post-hoc tests performed were Tukey
Fig 4.4.3: Percentages of respondents of various ethnic groups who want to be involved
in running youth provision.
4.4.4 AGE BREAKDOWN
Analysis of variance reveals no significant effect of age on desire to be involved in running youth provision.
The chart below (Fig 4.4.4) does appear to show differences but the smaller numbers within the older and
younger school years may explain why these differences do not reach significance.
Fig 4.4.4: Percentages of respondents across the school years who want to be involved
in running youth provision.
4.4.5 CORRELATIONS
Scores on this item correlated significantly with those on Q4B (frequency of attending youth clubs) such
that the more frequently they attend youth clubs, the more likely they are to want to be involved in delivering
youth provision.
Statistical data:. (r = 2.57, p < 0.05)
14
50
27
18
50
23
36
35
14
14
54
23
18
47
28
0
10
20
30
40
50
60
70
80
90
100
white
blck/carr
som/afrcn
asian
dual
no
possibly
definitely
25
48
27
18
53
23
14
56
22
14
47
27
21
41
28
19
59
21
37
42
21
0
10
20
30
40
50
60
70
80
90
100
Year 7
Year 8
Year 9
Year 10
Year 11
Year 12
Year 13
no
possibly
definitely
42. 42
HOW INVOLVED SHOULD PARENTS BE?
Fig 4.4.5: Percentages of respondents indicating views on parental involvement in
running youth provision
What areas should young people or parents be involved with/not be involved with in terms of running youth
provision?
4.4.6 ITEMS LISTED INCLUDE:
Health problems, bullying (mentioned repeatedly), ‘keeping an eye on things’, street
crime, sexual advice, gang crime, raising funds, sports, information/advice, decision
making, parenting, education, health (mentioned repeatedly), management,
4.4.7 SPECIFIC COMMENTS INCLUDED:
‘youth shouldn’t be involved in finance, parenting and leadership training’.
‘parents shouldn’t be involved’
‘parents shouldn’t be involved’
‘youth should learn to run things’
‘parents should be involved in every aspect of running the youth provision’
‘parents shouldn’t be involved with youth clubs’
‘parents should be involved only with seeing everything goes OK’
10
23
32
16
15
0
5
10
15
20
25
30
35
very invlvd quite
invlvd
don't knw little invlvd not invlvd
43. 43
4.5 WHAT DO THEY READ?
This item is a little hard to analyse due to some design limitations; it is difficult to see how some of the
options could actually match the stem items; for example, whilst the options ‘read most of the articles’, ‘read
articles that look good’, ‘glance at it’ and read to ‘find out what’s going on in the area’ might reasonably
apply to community newsletters and local newspapers (and possibly national newspapers) , it is hard to see
how these would apply to magazines and books. A gender breakdown is shown in the following charts (Figs
4.5.1 and 4.5.2) but no further analyses are conducted on this item.
Fig 4.5.1: Percentages males reading various publications
Fig 4.5.2: Percentages females reading various publications
9
11
14
4
45
24
22
22
6
15
27
23
15
2
21
27
18
13
1
27
27
20
15
5
22
0
10
20
30
40
50
60
70
80
90
newsletter
local pper
magazine
books
nationals
Male
no
listings
glance
read some
read most
7
11
16
6
42
23
23
15
8
20
55
25
8
25
39
20
9
4
19
18
18
15
8
28
0
10
20
30
40
50
60
70
80
90
100
newsletter
local pper
m
agazine
books
nationals
Female
no
listings
glance
read some
read most
44. 44
4.6 WHAT CONCERNS THEM?
This section opened with a qualitative question inviting respondents to write down what ‘worries’ them.
Because there is also a quantitative question (see below), comments listed here are those that are not
included in the quantitative list below.
Comments then include: ‘my life’, ‘danger in the streets’ (mentioned in various formats on 60 occasions),
‘the end of the world’ (2), ‘everything’, ‘getting good grades’/school (17), ‘dying’ (5), ‘going places alone’,
‘people changing’, ‘my religion being humiliated’, ‘I won’t become what I want to be’, ‘what the future
holds’ (6), ‘failing in life’ (2), ‘bad things happening to my family’ (4), ‘peer pressure’, ‘money’, ‘what my
parents think’, ‘what people think of me’, ‘expectations’, ‘drunk drivers’, ‘bad people in the world’.
Respondents were then given a range of issues and asked to indicate how much they concerned them. The
following chart (Fig 4.6.1) shows percentage of all respondents who indicated that they worry ‘a lot’ about
an issue. The issues have been arranged in order with the issue causing most concern on the left side of
the chart.
Fig 4.6.1: Percentage of all respondents who indicated that they worry ‘a lot’ about an
issue.
4.6.1 NON-RESPONDERS
Between 60 – 100 people did not respond to any particular item as the following table (Table 4.6.1)
indicates:
41
34
32
29 29
28
26
22
21
19
18 18 18 18 17 17
15
14 14 14
12
0
5
10
15
20
25
30
35
40
45
careerguns
appearncesafetyracismfamilygangshealthbullying
sexual...childrenfriendpreganc
unemployhousing
elderly...drugsalcoholhomoph
sex
gambling
45. 45
Table 4.6.1: Numbers of participants not responding to various items
Whilst it may be reasonably assumed that people who do not respond to an item choose not to because
they feel that the particular item is not relevant to them (i.e. it is not one that concerns them much), the
actual reasons for not responding can never be known. For this reason, a new chart (Fig 4.6.2) was created
showing the percentages of people who responded to that item, who worry a lot about each issue.
(Please note that the order has changed slightly from the original chart in Fig 4..6.1).
Fig 4.6.2: Percentages of people who responded to that item, who worry a lot about each
issue
4.6.2 GENDER DIFFERENCES
The following chart (Fig 4.6.3) shows percentage of male and female respondents indicating that they
46
37
35
33
32
31
28
25
24
22
20 20 20 20 19
17 16 16 16
15
14
0
5
10
15
20
25
30
35
40
45
50
careerguns
appearncesafetyracismfamilygangshealthbullying
sexual...childrenfriendpreganc
unemploy
elderlypardrugshousing
sexhomophalcohol
gambling
Item
Numbers not re-
sponding
Item
Numbers not re-
sponding
Career 91 Friends 77
Guns 89 Pregnancy 72
Appearance 75 Unemployment 98
Safety 64 housing 87
Racism 61 Elderly parents 89
Family 66 Drugs 60
Gangs 62 Alcohol 61
Health 77 homophobia 87
Bullying 68 Sex 81
Sexual health 87 Gambling 82
46. 46
‘worry a lot’ about each issue. The issues are presented in the same order as the above chart.
Fig 4.6.3: Percentage of male and female respondents indicating that they ‘worry a lot’
about each issue
There are significant gender differences for all items except worries about gambling and elderly parents. In
all cases, females worry significantly more than males.
4.6.3 DISABLED RESPONDENTS
The numbers of disabled respondents is too low in comparison to non-disabled to allow meaningful
comparisons, but the following chart (Fig 4.6.4) shows the percentage of disabled respondents (who
replied) who worry a lot about each item. Again, they are presented in order – biggest worry first.
0
5
10
15
20
25
30
35
40
45
50
careerguns
appearncesafetyracismfam
ilygangshealth
bullying
sexualhlth
childrenfriend
preganc
unem
ploy
housing
elderly
pardrugs
alcohol
hom
oph
sex
gam
bling
male
female
47. 47
Fig 4.6.4: Percentage of disabled respondents (who replied) who worry a lot about each item
4.6.4 ETHNICITY
The following chart (Fig 4.6.5) shows the percentages of each ethnic group who worry ‘a lot’ about their
career. One-way ANOVA reveals no significant differences between the groups.
Fig 4.6.5: Percentages of each ethnic group who worry ‘a lot’ about their career
4.7 SUBSTANCE USE
The following chart (Fig 4.7.1) shows the percentages of respondents who have indicated that they have
used various substances. Each bar is divided into sections according to whether the respondents use the
55
47
46
36 36 34 33 33 32 32
29 28 27 27 26
24 23
19 18 18
17
0
10
20
30
40
50
60
career
appearn
ce
gunssafetygangsfam
ilychildrenracismfriends
bu
llying
gam
blinghealth
unem
ployhousingeld
parsexhlth
hom
ophbiadrugs
pregnancysexhlthalcohl
39
42
39
42
48
0
5
10
15
20
25
30
35
40
45
50
W
hite British
Black Carribean
African
asian
dual
48. 48
substance regularly, sometimes, occasionally or not any more.
Fig 4.7.1: Percentages of respondents who have indicated that they have used various
substances
4.7.1 GENDER DIFFERENCES
There are significant gender differences for all of the substances except wine, solvents, tobacco and heroin.
In the cases of beer, cannabis, LSD, ecstasy and cocaine, males use significantly more than females.
However, overall numbers taking the last three substances are very small so caution should be exercised in
interpreting these findings.
4.7.2 ETHNIC BREAKDOWN
Numbers are too small to allow analysis within the various ethnic groups. A white/non-white analysis, could,
however, be conducted on beer, wine, tobacco, cannabis and cocaine. This reveals significant differences
for beer and wine taking such that whites use more than non-whites. The following chart (Fig 4.7.2) shows
the mean score (such that the lower the score the more frequently that substance is used) for each
substance for the two groups.
8
12
14
6
6
13
21
5
1
2
1
4
6
4
4
12
5
3
3
5
1
1
1
1
2
1
2
2
1
1
1
1 6
4
4
1
0
5
10
15
20
25
30
35
40
45
beer
w
inesolventstobacco
cannbis
LSD
E
H
eroin
cocaine
used to
occasion
sometimes
regularly
49. 49
Fig 4.7.2: Mean score for substance use for whites and non-whites
4.7.3 DISABILITY
Numbers are too small to allow meaningful analysis.
0
0.5
1
1.5
2
2.5
3
3.5
4
4.5
5
bee r wine tobacco cannabis cocaine
white
non-white
50. 50
4.8 FOOD RELATED ISSUES
4.8.1 ARE THEY HAPPY WITH THEIR WEIGHT?
The following chart (Fig 4.8.1) shows the percentage breakdown for this item by gender. It shows that 25%
of females are never or rarely happy with their weight. There is a statistically significant difference between
the genders.
Statistical data: (t = -7.9, df = 663, p <0.0005)
Fig 4.8.1: Percentages of each gender indicating satisfaction with weight.
The following chart (Fig 4.8.2) shows the percentage of respondents from the various ethnic groups who
are not happy with their weight (those who selected the options ‘often not’, ‘rarely’ or ‘never’ happy with
their weight). It shows that those of Dual Heritage are more likely to be unhappy with their weight with those
from African backgrounds less likely to be unhappy with their weight.
Fig 4.8.2: Percentage of respondents from the various ethnic groups who are not happy
with their weight
51
27
17
27
12
8 7
12
4
8
3
17
0
10
20
30
40
50
60
usuallysom
etim
esnotthought
often
not
rarely
never
male
female
30
23
13
29
36
0
5
10
15
20
25
30
35
40
W
hite British
Black Caribbean
African
asian
dual
51. 51
One-way Analysis of Variance reveals that there is a significant effect of ethnicity on contentment with
weight. Post hoc tests reveal that the area of significance is such that the African group is significantly
different from all the other groups except Black British/Caribbean.
4.8.2 DO THEY SKIP MEALS?
The following chart (Fig 4.8.3) shows the gender breakdown for missing meals or leaving food on plates in
order to avoid putting on weight. It shows that 21% of females do skip meals (quite often, very often or most
of the time) with a further 31% doing so occasionally. There is a statistically significant difference between
the genders.
Statistical data: (t = -7.4, df = 644, p <0.0005)
Fig 4.8.3: Gender breakdown for missing meals or leaving food on plates in order to
avoid putting on weight
72
44
13
31
4
10
1
5
2
6
0
10
20
30
40
50
60
70
80
never occasion quite oftn very often mostly
male
female
52. 52
4.9 SEXUAL ISSUES
There were three questions in this section. The first asked whether they would have sex before the age of
16. Although many respondents are actually over the age of 16 all the data was analysed for this question.
There is also no way of knowing how for how many respondents the question is rather academic in that
they have already had sex under that age. However, these limitations aside, the following chart (Fig 4.9.1)
shows the distribution by gender of responses to this question. It shows far more males than females
saying that they would have sex before aged 16, with Independent t-test shows that this difference is
statistically significant.
Statistical data: t = 8.8, df = 661, p < 0.005)
Fig 4.9.1: Percentage of male and female respondents who ‘would have sex under the
age of 16’.
The follow up question to this was an open-ended one asking for reasons for their
responses.
4.9.1 REASONS FOR ABSTAINING INCLUDED:
‘too young’ (a popular comment)
‘it’s against my religion’ (a popular comment)
‘it’s against the law’
‘I don’t want to get pregnant’ (quite a popular comment)
‘I don’t want to be a father’
‘I think it’s wrong’
‘I might get diseases’
‘I want to wait’
‘I don’t want to lose my virginity’
‘There was more important things than sex’
‘I don’t want to be a bad girl’
‘I’m waiting for a special person’
4.9.2 REASONS FOR NOT ABSTAINING INCLUDE:
‘I feel the need to’
‘Some girls are too sexy to resist’
‘It’s good fun’
42
69
12
11
42
16
0
10
20
30
40
50
60
70
no/unlikely possibly proba bly/yes
male
female
53. 53
‘Boys are sexy
‘I want to’
‘I don’t want to get to 15 and still be a virgin’
‘I like girls and it doesn’t seem too bad when safe’
‘I don’t believe the government should tell you when to have sex’
‘It’s cool’
‘It might just happen by mistake’
The final question in this section asked where they get information about sexual issues from. Eight options
are listed and respondents could select as many as applicable. The chart below (Fig 4.9.2) shows the
percentage of male and female respondents who say that they do get information from the listed sources.
The chart shows that the most common source for both genders is school lessons, followed by friends.
Females are generally more likely to get information from all the sources than males (except Internet and
DVDs) with particularly large differences for magazines and parents.
Fig 4.9.2: Percentage of male and female respondents who say that they do get
information from the listed sources
61
73
44
54
15
35
22
17
14
10
16
30
9
13
10
13
0
10
20
30
40
50
60
70
80
school
friends
m
ag
sinternet
D
VD
sparents
siblingsrelatives
male
female
54. 54
4.10 GENERAL ISSUES
Respondents here were given a list of outlets that they might turn to with a ‘serious problem’ and asked to
indicate which of them they would turn to. The following chart (Fig 4.10.1) shows the percentages of males
and females who would turn to each of the listed sources as their first or second choice. It show that mum
is the most popular choice for both boys and girls with friends the next popular for girls and dad for boys.
Fig 4.10.1: Percentages of males and females who would turn to each of the listed
sources as their first or second choice.
0
10
20
30
40
50
60
70
80
90
teacher
yth
w
rker
m
um
dadoth
fam
fam
friendfriends
schlnursereligious
socialwkr
GP
phoneline
male
female