
Recommended
More Related Content
Similar to YingWei03
YingWei03
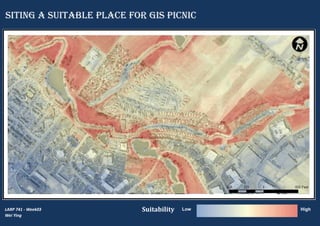
- 1. Siting a Suitable Place For GIS Picnic LARP 741 - Week03 Wei Ying HighLowSuitability
- 2. Development Factor Elevation & Slope Factors 1- Reclassify to identify developed land (Buildings, Public Roads, Private Drive and Parking Lots). 2- Build Euclidean Distance to development grids. 3- Reclassify for Suitability Index, the further from development land the better, for good open-land view. 1- Reclassify Elevation grids Suitability Index, the higher elevation, the lower index, considering relaxing and less physical output. 2- Based on elevation, build create slope using “Slope” tool in Spatial Analyst. 3- Reclassify Slope for Suitability Index, the flatter the better for picnic convenience. Suitability Index Elevation 0 1 2 3 4 5 6 7 8 9 10 Slope Distance Other Developed Legend Low: 0 High: 9
- 3. Suitability Index Hydrology Factor 1- Reclassify and create Euclidean Distance to water feature. 2- Reclassify for Suitability Index, the closer to water the better. But picnic cannot be hold in water, so where the distance is zero, the index is zero. Land Use Factors 1- Reclassify Land Use for Suitability Index 2- Reclassify for green land (lawn, crop, pasture), and create Euclidean Distance. 3- Reclassify the distance for Suitability Index. The closer to the green, the better the scenery and picnic environment, the higher index. Distance Distance Other Green Land Legend Other Hydrology Legend Open Water Non-Forest Wetlands Crops Pasture Lawn Under Construction Recreational Land Institutional Land Low Density Residential Median Density Residential High Density Residential Farmsteads Livestock Feed Centers Industrial/Commercial Land Commercial Land Legend Low: 0 High: 9
- 4. DEVELOPMENT ELEVATION SLOPE HYDROLOGY Land TYPE GREEN Suitability High : 107 Low : 0 Summary: Based on the six indexes, use Raster Calculator to generate complex index, which indicates the suitability for being a picnic for GIS group members. Shown in result map, the red lands are good for picnic, while the blue definitely not. The sites marked with smile face are the best choices as this report suggests.