1. 1
VATTENFALL YEAR-END REPORT 2020
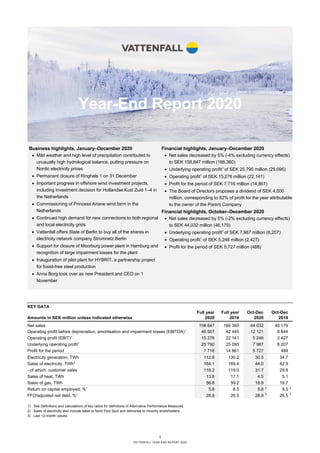
Year-End Report 2020
KEY DATA
Full year Full year Oct-Dec Oct-Dec
Amounts in SEK million unless indicated otherwise 2020 2019 2020 2019
Net sales 158 847 166 360 44 032 46 179
Operating profit before depreciation, amortisation and impairment losses (EBITDA)1
46 507 42 445 12 121 8 844
Operating profit (EBIT)1
15 276 22 141 5 246 2 427
Underlying operating profit1
25 790 25 095 7 987 8 207
Profit for the period 7 716 14 861 5 727 488
Electricity generation, TWh 112.8 130.2 30.5 34.7
Sales of electricity, TWh2
164.1 169.4 44.0 42.9
- of which, customer sales 118.2 119.0 31.7 29.8
Sales of heat, TWh 13.8 17.1 4.5 5.1
Sales of gas, TWh 56.8 59.2 18.9 19.7
Return on capital employed, %1
5.8 8.5 5.8 3
8.5 3
FFO/adjusted net debt, %1
28.8 26.5 28.8 3
26.5 3
1) See Definitions and calculations of key ratios for definitions of Alternative Performance Measures.
2) Sales of electricity also include sales to Nord Pool Spot and deliveries to minority shareholders.
3) Last 12-month values.
Business highlights, January–December 2020
• Mild weather and high level of precipitation contributed to
unusually high hydrological balance, putting pressure on
Nordic electricity prices
• Permanent closure of Ringhals 1 on 31 December
• Important progress in offshore wind investment projects,
including investment decision for Hollandse Kust Zuid 1–4 in
the Netherlands
• Commissioning of Princess Ariane wind farm in the
Netherlands
• Continued high demand for new connections to both regional
and local electricity grids
• Vattenfall offers State of Berlin to buy all of the shares in
electricity network company Stromnetz Berlin
• Support for closure of Moorburg power plant in Hamburg and
recognition of large impairment losses for the plant
• Inauguration of pilot plant for HYBRIT, a partnership project
for fossil-free steel production
• Anna Borg took over as new President and CEO on 1
November
Financial highlights, January–December 2020
• Net sales decreased by 5% (-4% excluding currency effects)
to SEK 158,847 million (166,360)
• Underlying operating profit1
of SEK 25,790 million (25,095)
• Operating profit1
of SEK 15,276 million (22,141)
• Profit for the period of SEK 7,716 million (14,861)
• The Board of Directors proposes a dividend of SEK 4,000
million, corresponding to 62% of profit for the year attributable
to the owner of the Parent Company
Financial highlights, October–December 2020
• Net sales decreased by 5% (-2% excluding currency effects)
to SEK 44,032 million (46,179)
• Underlying operating profit1
of SEK 7,987 million (8,207)
• Operating profit1
of SEK 5,246 million (2,427)
• Profit for the period of SEK 5,727 million (488)
2. 2
VATTENFALL YEAR-END REPORT 2020
CEO’s comment
Resilience and progress
during a challenging year
Vattenfall’s performance in 2020 shows that we are a resilient
company. Despite a year with record-low electricity prices, lower
power generation and lower sales of electricity, gas and heat, we
are reporting a stable underlying operating profit. However, large
impairment losses associated with the decreased value of coal-fired
power impacted net profit. The fact that coal is being forced out by
fossil-free energy is in line with Vattenfall’s strategy.
An extreme and unusual year – for several reasons other than the
pandemic
Owing to good preparedness and outstanding efforts by our employees,
the impact of the pandemic on Vattenfall’s business has been limited.
Operation of our facilities has been stable and safe whilst deliveries to
customers have continued with a sustained high level of service. We are
making progress in our investment projects and partnerships, where we
are also benefiting from increased electrification in society. The Nordic
electricity market, which is crucial for Vattenfall, had a dramatic year for
other reasons than the pandemic. Mild weather and a high level of
precipitation resulted in large inflows to reservoirs. This translated to
historically low electricity prices and extreme differences between price
areas in Sweden.
Vattenfall impacted by costs of the energy transition
The decreased value of coal-fired power is a natural development, but it
also had a strongly negative impact on Vattenfall’s financial results in
2020. Net profit for the year was SEK 7.7 billion and was weighed down
by impairment losses mainly related to the Moorburg coal-fired power
plant in Hamburg. In Germany, the Parliament passed a law calling for
the phase-out of coal-fired power by 2038 at the latest. At the end of the
year our bid to handle the phase-out of Moorburg was accepted, and
since year-end we are no longer generating coal-fired power from the
plant.
A diversified business and balanced risk-taking stabilised the
underlying operating profit
Vattenfall’s generation volume in 2020 was considerably lower compared
with the preceding year. This is due above all to the situation for Swedish
nuclear power, where we are phasing out older reactors, performed more
maintenance and periodically cut back on production when prices were
at their lowest. At year-end we closed Ringhals 1 according to plan and
are now focusing on long-term and safe operation of our five remaining
reactors.
In addition to lower power generation, sales of electricity, gas and heat
were also lower. Despite this and the record low electricity prices, we
report a stable underlying operating profit of SEK 25.8 billion. Several
factors have contributed to Vattenfall’s resilience. We are a diversified
company, both geographically and with respect to our different business
areas. Our hedging has served us well in a declining market. And we
have drawn benefit from our market knowledge in the trading operations,
where we reported a strong result for the year. To deliver an underlying
result in line with last year despite low prices and the ongoing pandemic
is a testament to the strength, stability and delivery capacity of Vattenfall.
The Board of Directors proposes a dividend of SEK 4 billion.
Vattenfall’s strategic direction continues
I took office as CEO of Vattenfall on November 1st. I feel secure in that
the strategic direction that we at Vattenfall have set – to enable fossil-
free living within one generation – is right. This is not our sustainability
strategy, it is our business strategy. And it is sustainable. It is in line with
this direction that we will find and create the business models of
tomorrow. We now report the outcome of our strategic targets for 2020
and continue to work towards the new targets for 2025. I look forward to
working together with my colleagues on continuing to build a company
that is profitable, sustainable and future-oriented.
Anna Borg
President and CEO
Profit for the period
7.7
SEK billion
Full year 2020
Underlying operating profit
25.8
SEK billion
Full year 2020
FFO/adjusted net debt
28.8%
Full year 2020
Return on capital employed
5.8%
Full year 2020
3. 3
VATTENFALL YEAR-END REPORT 2020
Group overview
Customer sales development
Sales of electricity, excluding sales to Nord Pool Spot and
deliveries to minority shareholders, decreased by 0.8 TWh to
118.2 TWh (119.0), mainly owing to lower volumes in the
Nordic countries and Germany. Higher sales in the B2B
segment in France had a countering effect. Sales of gas
decreased by 2.4 TWh to 56.8 TWh (59.2) as a result of
warmer weather in the Netherlands. Sales of heat decreased
by 3.3 TWh to 13.8 TWh (17.1).
CUSTOMER SALES (TWh)
Generation development
Total electricity generation decreased by 17.4 TWh to
112.8 TWh (130.2) in 2020. Lower nuclear power (-14.0 TWh)
and fossil-based (-8.4 TWh) power generation was countered
by higher hydro power (+4.0 TWh) and wind power (+1.1
TWh) generation.
ELECTRICITY GENERATION (TWh)
Price development
Average Nordic electricity spot prices were 65% lower, at
EUR 13.6/MWh (38.7) during the fourth quarter of 2020
compared with the corresponding period in 2019, mainly
owing to a stronger hydrological balance. Spot prices in
Germany were 6% higher, at EUR 38.9/MWh (36.6), and
prices in the Netherlands increased by 7% to EUR 42.2/MWh
(39.3). Prices in Germany and the Netherlands were mainly
affected by higher fuel prices and higher prices for CO2
emission allowances. Electricity futures prices for delivery in
2021 and 2022 were 8%–45% lower than during the fourth
quarter of 2019.
Compared with the fourth quarter of 2019 the average spot
price for gas was 16% higher, at EUR 14.6/MWh (12.6). The
spot price for coal was 5% higher, at USD 59.1/t (56.3). The
futures price 2021 for gas was 20% lower, at EUR 14.0/MWh
(17.5), and the futures price 2021 for coal was 11% lower, at
USD 60.5/t (67.7). The price of CO2 emission allowances was
11% higher, at EUR 27.6/t (24.9).
AVERAGE INDICATIVE NORDIC HEDGE PRICES (SE, DK, FI)
AS PER 30 DECEMBER 2020, EUR/MWh
EUR/MWh 2021 2022 2023
28 29 26
VATTENFALL’S ESTIMATED NORDIC HEDGE RATIO (SE,
DK, FI) AS PER 30 DECEMBER 2020 (%)
ACHIEVED NORDIC ELECTRICITY PRICES (SE, DK, FI)1
EUR/MWh
Full year
2020
Full year
2019
Oct-Dec
2020
Oct-Dec
2019
31 32 31 33
SENSITIVITY ANALYSIS – CONTINENTAL PORTFOLIO (DE,
NL, UK)
+/-10% price impact on future
profit before tax, SEK million2
Market-
quoted 2021 2022 2023
Observed
yearly
volatility3
Electricity +/- 352 +/- 454 +/- 1,439 19%-27%
Coal -/+ 43 -/+ 22 -/+ 7 17%-21%
Gas -/+ 133 -/+ 156 -/+ 720 18%-28%
CO2 -/+ 60 -/+ 72 -/+ 318 48%-50%
1) Achieved prices from the spot market and hedges. Includes Nordic
hydro, nuclear and wind power generation
2) The denotation +/- entails that a higher price affects operating profit
favourably, and -/+ vice versa
3) Observed yearly volatility for daily price movements for each
commodity, based on forward contracts. Volatility normally
decreases the further ahead in time the contracts pertain to.
0
20
40
60
80
100
120
140
Electricity Gas Heat
Full year 2019 Full year 2020
0
10
20
30
40
50
60
Fossil Nuclear Hydro Wind Biomass,
waste
Full year 2019 Full year 2020
69
41
20
0
20
40
60
80
2021 2022 2023
4. 4
VATTENFALL YEAR-END REPORT 2020
Net sales
January–December: Consolidated net sales decreased by
SEK 7.5 billion, including negative currency effects of SEK 0.9
billion). The decrease is mainly attributable to lower electricity
prices and lower sales volumes in the Nordic countries, the
Netherlands and Germany, and lower revenue from the heat
operations.
October–December: Consolidated net sales decreased by
SEK 2.1 billion, including negative currency effects of SEK 1.0
billion. The decrease is mainly attributable to lower sales
volumes in the Nordic countries and the Netherlands.
Earnings
January–December: The underlying operating profit increased
by SEK 0.7 billion, which is explained by:
• A higher earnings contribution from the Customers &
Solutions operating segment (SEK 0.8 billion), mainly owing
to lower depreciation in the Netherlands
• A higher earnings contribution from the Heat operating
segment (SEK 0.4 billion), owing to lower maintenance costs
and lower depreciation
• A lower earnings contribution from the Power Generation
operating segment (SEK -0.8 billion), owing to lower
achieved prices in the Nordic countries and lower nuclear
power generation, which was partly compensated by higher
realised earnings from the trading operations and higher
hydro power generation
• Other items, net (SEK 0.2 billion)
Items affecting comparability amounted to SEK -10.5 billion
(-3.0), of which most pertain to impairment losses in the Heat
(SEK-11.3 billion) and Wind (SEK -1.6 billion) operating
segments, which were partly countered by unrealised changes
in market value for energy derivatives and inventories (SEK 5.2
billion) and the sale of nuclear power production rights in
Germany (SEK 2.8 billion). Profit for the period totalled
SEK 7.7 billion (14.9) and was affected by, in addition to items
affecting comparability, higher net financial items resulting from
lower interest for provisions and a higher tax cost.
October–December: Underlying operating profit decreased by
SEK 0.2 billion. Negative contributions from the Customers &
Solutions (SEK -0.4 billion) and Power Generation (SEK -0.2
billion) operating segments were offset by a positive
contribution from the Heat operating segment (SEK +0.6 billion).
Items affecting comparability amounted to SEK -2.7 billion (-
5.8), of which provisions (SEK -2.8 billion) pertain mainly to
nuclear power and costs for phasing out coal-fired generation,
and impairment losses (SEK -2.4 billion) pertain mainly to the
Heat operating segment. Unrealised changes in market value
for energy derivatives and inventories (SEK 2.4 billion) had a
countering effect. Profit for the period was SEK 5.7 billion (0.5)
and was affected by a higher operating profit (EBIT), higher net
financial items resulting from a higher return from the Swedish
Nuclear Waste Fund (SEK 1.3 billion), and lower income taxes
due to measurement of previously written down deferred tax
assets.
Cash flow
January–December: Funds from operations (FFO) increased
by SEK 0.1 billion. A higher underlying operating profit before
depreciation, amortisation and impairment losses (EBITDA) was
countered by higher paid tax (the comparison is affected by a
tax refund in Germany in 2019). Cash flow from changes in
working capital amounted to SEK 6.7 billion. The largest
contributing factors were the net change in margin calls (SEK
12.6 billion), an increase in inventories (SEK -1.6 billion), and
changes related to CO2 emission allowances, which had a
negative cash flow effect (SEK -3.7 billion).
October–December: Funds from operations (FFO) decreased
by SEK 0.2 billion, mainly owing to the lower underlying
operating profit before depreciation, amortisation and
impairment losses (EBITDA) and a lower net of interest
received and paid, which was countered by lower paid tax.
Cash flow from changes in working capital amounted to
SEK 3.5 billion, which is mainly explained by the net change in
margin calls (SEK 9.2 billion). This was countered by a net
change in operating receivables and operating liabilities
attributable to seasonal effects in the Customers & Solutions
and Heat operating segments (SEK -3.5 billion) and an increase
in inventories (SEK -2.8 billion).
KEY FIGURES – GROUP OVERVIEW
Full year Full year Oct-Dec Oct-Dec
Amounts in SEK million 2020 2019 2020 2019
Net sales 158 847 166 360 44 032 46 179
Operating profit before depreciation, amortisation and impairment losses (EBITDA)1
46 507 42 445 12 121 8 844
Operating profit (EBIT)1
15 276 22 141 5 246 2 427
Underlying operating profit1
25 790 25 095 7 987 8 207
Items affecting comparability1
- 10 514 - 2 954 - 2 741 - 5 780
Profit for the period 7 716 14 861 5 727 488
Funds from operations (FFO)1
35 024 34 949 11 368 11 520
Cash flow from changes in operating assets and operating liabilities (working capital) 6 668 - 18 230 3 486 - 6 530
Cash flow from operating activities 41 692 16 719 14 854 4 990
1) See Definitions and calculations of key ratios for definitions of Alternative Performance Measures.
5. 5
VATTENFALL YEAR-END REPORT 2020
Capital structure
Cash and cash equivalents, and short-term investments increased by SEK 23.1 billion compared with the level at 31 December
2019. Committed credit facilities consist of a EUR 2.0 billion Revolving Credit Facility that expires in November 2023 and a credit
facility of SEK 3.0 billion that expires in January 2022. As per 31 December 2020 available liquid assets and/or committed credit
facilities amounted to 46.5% of net sales. Vattenfall’s target is to maintain a level of no less than 10% of consolidated net sales, but
at least the equivalent of the next 90 days’ maturities.
Net debt and adjusted net debt decreased by SEK 16.1 billion and SEK 10.5 billion, respectively, compared with the levels at 31
December 2019. These reductions are mainly attributable to a positive cash flow after investments (SEK 21.5 billion) and positive
currency effects (SEK 3.7 billion), which were partly countered by payment of a dividend to the owner (SEK 3.6 billion) and to
minority owners (SEK 1.7 billion). In addition, adjusted net debt was affected by higher provisions for nuclear power, net (SEK 2.3
billion) and higher provisions for the phase-out of coal-fired power generation (SEK 1.4 billion).
NET DEBT
0
30
60
90
120
0
30 000
60 000
90 000
120 000
Q3
2019
Q4
2019
Q1
2020
Q2
2020
Q3
2020
Q4
2020
%
MSEK
Interest-bearing liabilities, MSEK
Net debt, MSEK
Gross debt/equity, %
Net debt/equity, %
ADJUSTED NET DEBT
Strategic objectives and targets for 2020
Strategic objectives Targets for 2020 Outcome 2020 Outcome 2019
Leading towards sustainable
consumption
1. Customer engagement, Net Promoter Score
relative to peers1
(NPS relative): +2 +2 +1
Leading towards sustainable
production
2. Aggregated commissioned new renewables
capacity 2016-2020: ≥2,300 MW
3. Absolute CO2 emissions pro rata: ≤21 Mt
1,560 MW
12.1 Mt2
1,226 MW
19.3 Mt3
High performing operations 4. Return On Capital Employed (ROCE), last
12 months: ≥8% 5.8% 8.5%
Empowered and engaged
people
5. Lost Time Injury Frequency (LTIF): ≤1.25
6. Employee Engagement Index4
: ≥70%
1.7
72%
2.1
69%
1) The target is a positive NPS in absolute terms and +2 compared to Vattenfall’s peer competitors and was set to be achieved by 2020
2) Preliminary value. The final value will be presented in the Annual and Sustainability Report.
3) The outcome includes the divested heat operations in Hamburg, where emissions amounted to 1.1 Mt during the period January-September 2019
4) Documentation for measurement of target achievement is derived from the results of an employee survey, which is conducted on an annual basis
0
5
10
15
20
25
30
0
30 000
60 000
90 000
120 000
150 000
Q3
2019
Q4
2019
Q1
2020
Q2
2020
Q3
2020
Q4
2020
%
MSEK
Adjusted net debt, MSEK
FFO/adjusted net debt, %
6. 6
VATTENFALL YEAR-END REPORT 2020
71%
14%
9%
6%
Growth capex per
technology 2021-2022
Wind power, 23 bn SEK
Electricity distribution, 4 bn SEK
Heat supply, 3 bn SEK
Other, 2 bn SEK
Empty
29%
28%
22%
11%
10%
Growth capex per country
2021-2022
Netherlands, 9 bn SEK
Denmark, 9 bn SEK
UK, 7 bn SEK
Sweden, 4 bn SEK
Germany, 3 bn SEK
57%
25%
18%
Total capex
2021-2022
Growth, 32 bn SEK
Maintenance, 14 bn SEK
Replacement, 10 bn SEK
Empty
32 bn
SEK
32 bn
SEK
57 bn
SEK
Investment plan 2021-2022
Vattenfall has decided on an investment plan for 2021–2022 of SEK 57 billion, net. Gross investments amount to SEK 78 billion,
where the difference is attributable to assumptions for partnerships for the Hollandse Kust Zuid 1–4 wind power project and the
Norfolk project, and an assumption for revenue from sales of projects developed for sale. The amounts stated below pertain to net
investments.
Growth investments amount to SEK 32 billion, where the largest share, SEK 23 billion – or 71% – is planned to be invested in wind
power. Vattenfall will also invest in the electricity grid and in the expansion of district heating operations. Other growth investments
include charging infrastructure, solar and battery projects, decentralised energy solutions and the HYBRIT project.
7. 7
VATTENFALL YEAR-END REPORT 2020
Operating segments
Full year Full year Oct-Dec Oct-Dec
Amounts in SEK million 2020 2019 2020 2019
Underlying operating profit
Customers & Solutions 2 146 1 337 387 744
Power Generation 14 670 15 437 3 938 4 186
- of which, trading 2 757 1 794 631 1 015
Wind 3 970 4 155 1 716 1 680
Heat 978 550 784 232
Distribution 5 325 4 998 1 454 1 544
- of which, Distribution Germany 1 093 1 132 268 281
- of which, Distribution Sweden 4 225 3 856 1 177 1 265
Other1
- 1 290 - 1 274 - 397 - 279
Eliminations - 9 - 108 105 100
Underlying operating profit 25 790 25 095 7 987 8 207
1) “Other” pertains mainly to all Staff functions, including Treasury and Shared Service Centres.
Customers & Solutions Power Generation
– Generation
Power Generation
– Markets
Wind Heat Distribution
8. 8
VATTENFALL YEAR-END REPORT 2020
Customers & Solutions
The Customers & Solutions Business Area is responsible for
sales of electricity, gas and energy services in all of Vattenfall’s
markets.
Continued strong sales development in Germany and
France
• Agreement with Microsoft on supply of renewable electricity
to data centers
• Transfer of retail business in the UK to EDF
• Increased customer base in Germany and more than
100,000 retail contracts in France
Full year: Net sales decreased mainly owing to lower electricity
prices in the Nordic countries and the Netherlands and to lower
volumes in these markets as a result of slightly lower demand.
This was partly offset by higher volumes in the B2B segment in
France and a larger customer base in Germany. Underlying
operating profit increased mainly as a result of lower
depreciation in the Netherlands.
Q4: Net sales decreased mainly owing to lower prices and
volumes in the Nordic countries and the Netherlands. This was
partly countered by higher volumes in the B2B segment in
France. Underlying operating profit decreased mainly owing to a
lower contribution from sales in the Netherlands due to warmer
weather and higher selling costs in Germany. This was partly
countered by lower depreciation in the Netherlands.
The total customer base was stable and amounted to 10.1
million contracts at year-end 2020. In the UK, the sale of the
retail business iSupply was completed, and all customers have
now been transferred to EDF. A decreased customer base in
the Netherlands was offset by a larger customer base in
Germany and France.
Two years after Vattenfall’s entry to the French retail market, the
customer base now exceeds 100,000 contracts. Growth has
been achieved organically through the offer of CO2-neutral and
renewable electricity. The business complements Vattenfall’s
B2B sales, which have been conducted in the country for the
past 20 years.
Vattenfall entered into an agreement with Microsoft to deliver
electricity from hydro and wind power to Microsoft’s new data
centers in Sweden starting in November 2021. The solution
ensures delivery of 100% renewable electricity, and smart
meters will allow measuring of consumption in real time. This
will contribute to greater transparency and a better
understanding of energy use and its climate impact. The
solution was previously tested in a pilot project at Vattenfall’s
and Microsoft’s respective headquarters in Sweden.
KEY FIGURES – CUSTOMERS & SOLUTIONS
Full year Full year Oct-Dec Oct-Dec
Amounts in SEK million unless indicated otherwise 2020 2019 2020 2019
Net sales 86 298 89 859 23 931 25 773
External net sales 84 661 87 343 23 470 25 078
Underlying operating profit before depreciation, amortisation and impairment losses 3 083 3 021 611 1 180
Underlying operating profit 2 146 1 337 387 744
Sales of electricity, TWh 95.8 89.5 25.7 22.9
- of which, private customers 26.3 28.0 7.3 7.9
- of which, resellers 8.0 6.5 2.6 1.8
- of which, business customers 61.5 55.0 15.8 13.2
Sales of gas, TWh 52.1 54.2 17.6 18.1
Number of employees, full-time equivalents 2 971 3 150 2 971 3 150
9. 9
VATTENFALL YEAR-END REPORT 2020
Power Generation
Power Generation comprises the Generation and Markets
Business Areas. The segment includes Vattenfall’s hydro and
nuclear power operations, maintenance services business, and
optimisation and trading operations including certain large
business customers.
Earnings impact from record-low electricity prices and
lower nuclear power generation
• Permanent closure of Ringhals 1 on 31 December
• Increase in available hydro power capacity by more than
600 MW during the period 2016–2020
• New balancing agreement for wind power
Full year: Net sales decreased mainly as a result of lower
electricity prices in the Nordic countries resulting from a high
hydrological balance, which was partly countered by hedging. In
addition, net sales were negatively affected by lower sales of
electricity and gas in the B2B segment in Germany, lower
internal sales and lower nuclear power generation. Underlying
operating profit decreased as a result of lower achieved prices
in the Nordic countries and lower nuclear power generation,
which was partly compensated by a higher realised trading
result and higher hydro power generation.
Nuclear power generation decreased by 14.0 TWh mainly due
to the closure of Ringhals 2, the prolonged outages for yearly
inspections and output reductions in response to lower price
levels. Combined availability for Vattenfall’s nuclear power
plants for the full year 2020 was 76.4% (87.8%). The decrease
is mainly attributable to longer maintenance work and outages
than in 2019 at Ringhals 1 and 3.
Hydro power generation increased by 4.0 TWh. At year-end,
Nordic reservoir levels were at 82% (60%) of capacity, which is
25 percentage points above the normal level.
Q4: Net sales decreased mainly as a result of lower electricity
prices in the Nordic countries, which were partly offset by
hedging. Underlying operating profit decreased mainly as a
result of lower achieved prices, lower nuclear power generation
and a lower realised trading result.
After nearly 45 years of service, the Ringhals 1 nuclear power
reactor was shut down on 31 December. Over its lifetime
Ringhals 1 delivered 220 terawatt hours of electricity. In the next
step, the nuclear fuel will be removed from the reactor, after
which the plant will be prepared for dismantling, which will begin
on a large scale during the second half of 2022.
In mid-December the Swedish Radiation Safety Authority
announced its approval of implementation of independent core
cooling systems at the Ringhals and Forsmark nuclear power
plants. The systems will ensure that water can be pumped in to
cool the reactor cores for 72 hours in the event of a failure of the
other safety systems.
During the period 2016–2020, available capacity of Vattenfall’s
hydro power increased by over 600 MW. This is the result of a
combination of measures that have reduced technical
limitations, boosted installed capacity and shortened periods of
unavailability due to maintenance.
In Sweden Vattenfall signed agreements for power balancing
and market access for the Markbygden II (253 MW) wind farm,
which is owned by the Swiss collective asset manager Energy
Infrastructure Partners AG (EIP) and the German turbine
manufacturer Enercon.
KEY FIGURES – POWER GENERATION
Full year Full year Oct-Dec Oct-Dec
Amounts in SEK million unless indicated otherwise 2020 2019 2020 2019
Net sales 90 133 102 378 24 825 27 678
External net sales 36 597 38 425 9 571 10 230
Underlying operating profit before depreciation, amortisation and impairment losses 18 796 19 207 4 997 5 148
Underlying operating profit 14 670 15 437 3 938 4 186
- of which, realised trading result 2 757 1 794 631 1
1 015
Electricity generation, TWh 79.0 89.0 21.2 23.6
- of which, hydro power 39.7 35.7 10.4 9.8
- of which, nuclear power 39.3 53.3 10.8 13.8
Sales of electricity, TWh 20.0 27.0 5.3 6.2
- of which, resellers 17.9 22.8 4.7 5.1
- of which, business customers 2.1 4.2 0.6 1.1
Sales of gas, TWh 4.7 5.0 1.3 1.6
Number of employees, full-time equivalents 7 474 7 429 7 474 7 429
1) The value has been adjusted compared with information previously published in Vattenfall’s financial reports.
10. 10
VATTENFALL YEAR-END REPORT 2020
Wind
The Wind Business Area is responsible for development,
construction and operation of Vattenfall’s wind farms as well as
large-scale and decentralised solar power and batteries.
Expansion in renewables but dampened earnings as
result of lower prices and more maintenance
• Permits granted for construction of the Vesterhav Syd and
Nord offshore wind farms
• Commissioning of Moerdijk onshore wind farm in the
Netherlands
• Investment decision for solar park in Germany and power
purchase agreement signed with Bosch
Full year: Net sales were unchanged compared with 2019.
New capacity made a positive contribution and came mainly
from the Horns Rev 3 offshore wind farm in Denmark and
Princess Ariane onshore wind farm in the Netherlands. This was
largely countered by lower electricity prices and lower availability
for offshore wind power owing to increased maintenance work.
This also resulted in higher costs for maintenance, which
contributed to a lower underlying operating profit. Electricity
generation increased as a result of new capacity and higher
wind speeds early in the year. Total investments in 2020
amounted to SEK 7.7 billion, and during the year the investment
decision was made for the Hollandse Kust Zuid 1–4 offshore
wind farm in the Netherlands.
Q4: Net sales were unchanged compared with the
corresponding period in 2019. New capacity (Princess Ariane)
made a positive contribution. This was countered by lower
availability of offshore wind and lower electricity prices.
Underlying operating profit increased as a result of lower
depreciation.
In December the Danish Energy Agency gave permission for
construction work to begin on the Vesterhav Syd and Nord
offshore wind farms (350 MW) off Denmark’s west coast. The
decision is affirmation that the project is in compliance with
legislation regarding the environment and consideration for
neighbours. The wind farms are expected to be fully operational
in 2024, with generation corresponding to the annual electricity
consumption of 380,000 Danish households.
In December the Moerdijk onshore wind farm in the Netherlands
was commissioned. The wind farm comprises seven turbines
with total capacity of 25 MW.
The final investment decision was taken for the Kogel-Leizen
solar park in Germany. The facility will have a capacity of 28
MW and will be commissioned during the first half of 2021. A 12-
year power purchase agreement was signed with Bosch for the
equivalent of one-third of the solar park’s expected electricity
generation.
KEY FIGURES – WIND
Full year Full year Oct-Dec Oct-Dec
Amounts in SEK million unless indicated otherwise 2020 2019 2020 2019
Net sales 13 565 13 492 3 959 3 990
External net sales 6 901 6 578 2 047 1 899
Underlying operating profit before depreciation, amortisation and impairment losses 9 426 9 620 2 982 3 120
Underlying operating profit 3 970 4 155 1 716 1 680
Electricity generation - wind power TWh 10.8 9.7 3.1 2.9
Sales of electricity, TWh 1.2 1.3 0.4 0.4
Number of employees, full-time equivalents 1 104 1 000 1 104 1 000
11. 11
VATTENFALL YEAR-END REPORT 2020
Heat
The Heat Business Area comprises Vattenfall’s heat business
(district heating and decentral solutions) and gas- and coal-fired
condensing plants.
Improved underlying profit but large impairment losses
• Support for closure of the Moorburg power plant in
Hamburg and additional impairment losses for the plant
• Progress in investment projects in Berlin and Uppsala
supporting the energy transition
• Lower margins for gas- and coal-fired power generation
Full year: Net sales decreased and underlying operating profit
increased compared with 2019. The sale of the district heating
operations in Hamburg and the closure of the Hemweg 8 power
plant had a negative effect on the net sales comparison by SEK
4.1 billion and on the underlying operating profit comparison by
SEK 0.3 billion. Lower clean dark- and clean spark spreads also
had a negative effect on net sales. Underlying operating profit
increased mainly as a result of lower maintenance costs and
lower depreciation. Compared with year-end 2019, the number
of customers increased by 1.6% to 1.8 million households.
Q4: Net sales decreased and underlying operating profit
increased compared with 2019. The closure of Hemweg 8 had a
positive effect on the net sales comparison by SEK 0.4 billion
and on the underlying operating profit comparison by SEK 0.1
billion. Net sales were also affected by lower clean dark- and
clean spark spreads and lower sales of heat in Germany and
Sweden due to warmer weather. Underlying operating profit
increased as a result of lower maintenance costs and lower
depreciation.
In December the German Federal Network Agency
(Bundesnetzagentur) decided to award Vattenfall compensation
for the complete phase-out of the Moorburg coal-fired power
plant in Hamburg. No coal-fired power has been generated by
the plant since year-end and an impairment loss of SEK 2.4
billion has been recognised in the fourth quarter, which is
reported in items affecting comparability. The total impairment
loss for the plant in 2020 amounts to SEK 11.3 billion, and
provisions for the closure had an additional impact on earnings
of SEK 1.8 billion. Provided that the German regional
transmission system operators do not consider Moorburg to be
system-relevant for grid stability, the formal ban on coal-fired
power generation will take effect by 1 July 2021 at the latest.
In Berlin the gas-fired boiler at Reuter West was put in operation
in December, with capacity of 120 MW. In addition, one of
Europe’s largest heat storage facilities will be built at the site
with water volume of 52,000 m3
. The heat storage facility will
add flexibility and reliability to the district heating network in
Berlin while optimising the production portfolio.
Construction of a new biofuel-fired heat plant in Uppsala (Carpe
Futurum) has continued with a strong safety record of 500,000
work hours without any serious incidents. The project accounts
for roughly half of the SEK 3.5 billion that Vattenfall is investing
in heat operations in Uppsala and is expected to result in a
reduction of CO2 emissions by 150,000 tonnes per year. The
new plant is planned to be commissioned during the first half of
2022.
In October Vattenfall signed a Memorandum of Understanding
with the Norwegian company Aker Carbon Capture to evaluate
future development of bio-CCS plants. The agreement supports
Vattenfall’s ambitions to achieve negative carbon emissions
through investment in a large-scale commercial bio-CCS plant
at one of Vattenfall’s Swedish district heating plants by 2030 at
the latest.
KEY FIGURES – HEAT
Full year Full year Oct-Dec Oct-Dec
Amounts in SEK million unless indicated otherwise 2020 2019 2020 2019
Net sales 23 328 31 403 7 279 8 158
External net sales 13 538 15 947 4 165 4 188
Underlying operating profit before depreciation, amortisation and impairment losses 4 462 4 409 1 581 1 280
Underlying operating profit 978 550 784 232
Electricity generation - TWh 23.0 31.5 6.2 8.2
- of which, fossil-based power 22.7 31.1 6.1 8.1
- of which, biomass, waste 0.3 0.4 0.1 0.1
Sales of electricity business customers, TWh 1.2 1.2 0.3 0.3
Sales of heat, TWh 13.8 17.1 4.5 5.1
Number of employees, full-time equivalents 3 213 3 310 3 213 3 310
12. 12
VATTENFALL YEAR-END REPORT 2020
Distribution
The Distribution Business Area comprises Vattenfall’s electricity
distribution operations in Sweden, Germany (Berlin) and the UK.
High demand for electricity grid connections in Sweden
• Continued high demand for new connections to both the
regional and local grids
• Development of regional capacity flexibility market through
Sthlmflex project
• Commissioning of Sweden’s largest battery storage facility
in Uppsala
Full year: Net sales decreased due to lower distributed volumes
in Swedish local grids and a lower contribution from Germany.
Underlying operating profit increased as a result of lower
operating expenses, which were elevated in 2019 by the impact
of Storm Alfrida.
Q4: Net sales were unchanged compared with 2019. Underlying
operating profit decreased as a result of a lower gross margin in
the Swedish regional grids.
The electricity grid’s central role in enabling the energy transition
and electrification can be seen clearly in the continued high
demand for new connections to the grid. Connection queries at
both the regional and local levels are growing and pertain to
everything from large wind farms and solar parks to private
customers interested in generating their own electricity from
solar panel systems. In parallel with this, the electricity grid
needs to enable the transformation brought about by major
industrial customers when their processes are electrified. A
number of areas are experiencing capacity bottlenecks, and the
situation in the greater Stockholm and Mälardal area is
especially strained. Vattenfall is continuing its extensive work on
upgrading and strengthening the electricity grid, and is working
in parallel on developing new, innovative solutions that can
contribute to reducing capacity shortages in the grid.
In the new Sthlmflex project Vattenfall – together with the TSO
Svenska Kraftnät and the regional distribution network operator
Ellevio – is developing a capacity flexibility market. Flexible
electricity users can help reduce capacity bottlenecks in the
electricity grid in Stockholm, and the aim of the market is to
enable electricity distribution companies to buy flexibility
services such as storage, generation or consumption
reductions, which together contribute to a more efficient and
dynamic energy system.
In Uppsala, Vattenfall’s unregulated business, Network
Solutions, is participating in an innovation project together with
Uppsala Municipality in which Sweden’s largest battery storage
park, with a capacity of 5 MW, was recently put into operation.
The permitting processes for building electricity grids are
lengthy, and battery storage can help relieve the burden on the
grid during capacity shortages in the interim until the grid can be
expanded.
In early December the Swedish government presented a new
memorandum calling for a special investment scope for
electricity network companies. The proposal aims to increase
the scope for investments in the electricity grid by enabling
electricity grid companies to use unutilised revenue frames from
the preceding regulation period. The proposal is currently out on
circulation and is expected to take effect on 1 May 2021.
Parallel with this, the legal process on revenue frames in
Sweden continues. In October 2019 the Swedish Energy
Markets Inspectorate communicated its decision on the revenue
frames for the 2020–2023 regulatory period, and the weighted
average cost of capital (WACC) was set at the low level of
2.16%, compared with 5.85% for the preceding regulatory
period. The revenue frames for 2020–2023 have been appealed
by many electricity distribution companies, including Vattenfall.
The new revenue regulation is set in an ordinance, and the
electricity distribution companies must prove that the decision is
in violation of law as well as the ordinance. The new ordinance
is very detailed, and according to the European Commission it
may be in contravention of EU directives. The Swedish legal
process is ongoing in the Administrative Court in Linköping and
a judicial ruling is expected in early 2021. In the course of this
process an additional company was added for comparison, and
the regulator thereby reviewed the WACC calculation. The
updated WACC is 2.35%, which is the level that will apply if the
ordinance remains.
KEY FIGURES – DISTRIBUTION
Full year Full year Oct-Dec Oct-Dec
Amounts in SEK million unless indicated otherwise 2020 2019 2020 2019
Net sales 21 644 22 540 5 982 5 938
External net sales 16 970 17 903 4 736 4 719
Underlying operating profit before depreciation, amortisation and impairment losses 8 725 8 248 2 328 2 402
Underlying operating profit 5 325 4 998 1 454 1 544
Number of employees, full-time equivalents 2 366 2 247 2 366 2 247
13. 13
VATTENFALL YEAR-END REPORT 2020
Other
Other pertains mainly to all Staff functions, including Treasury
and Shared Service Centres.
Net sales consist primarily of revenues attributable to
Vattenfall’s service organisations such as Shared Services, IT
and Vattenfall Insurance.
KEY FIGURES – OTHER
Full year Full year Oct-Dec Oct-Dec
Amounts in SEK million unless indicated otherwise 2020 2019 2020 2019
Net sales 5 917 5 556 1 662 1 460
External net sales 180 164 43 65
Underlying operating profit before depreciation, amortisation and impairment losses - 442 - 457 - 189 - 65
Underlying operating profit - 1 290 - 1 274 - 397 - 279
Number of employees, full-time equivalents 2 731 2 678 2 731 2 678
14. 14
VATTENFALL YEAR-END REPORT 2020
Consolidated income statement
Full year Full year Oct-Dec Oct-Dec
Amounts in SEK million 2020 2019 2020 2019
Net sales 158 847 166 360 44 032 46 179
Cost of purchases - 76 225 - 87 580 - 20 243 - 24 789
Other external expenses - 20 732 - 22 675 - 8 107 - 8 528
Personnel expenses - 19 535 - 20 249 - 4 787 - 5 265
Other operating income and expenses, net 3 882 6 167 1 078 1 078
Participations in the results of associated companies 270 422 148 169
Operating profit before depreciation, amortisation and impairment losses (EBITDA) 46 507 42 445 12 121 8 844
Depreciation, amortisation and impairments - 31 231 - 20 304 - 6 875 - 6 417
Operating profit (EBIT)1
15 276 22 141 5 246 2 427
Financial income4
558 451 76 - 2
Financial expenses2,3,4
- 5 886 - 6 522 - 1 402 - 1 595
Return from the Swedish Nuclear Waste Fund 2 058 2 252 633 - 657
Profit before income taxes 12 006 18 322 4 553 173
Income taxes - 4 290 - 3 461 1 174 315
Profit for the period 7 716 14 861 5 727 488
Attributable to owner of the Parent Company 6 489 13 173 5 132 151
Attributable to non-controlling interests 1 227 1 688 595 337
Supplementary information
Underlying operating profit before depreciation, amortisation and impairment losses 44 041 43 940 12 415 13 165
Underlying operating profit 25 790 25 095 7 987 8 207
Financial items, net excl. discounting effects attributable
to provisions and return from the Swedish Nuclear Waste Fund - 3 163 - 3 774 - 773 - 1 021
1) Including items affecting comparability - 10 514 - 2 954 - 2 741 - 5 780
- of which, capital gains 301 3 538 86 49
- of which, capital losses - 241 - 25 - 184 - 7
- of which, impairment losses - 12 980 - 1 459 - 2 447 - 1 459
- of which, provisions - 3 488 - 3 431 - 2 803 - 2 901
- of which, unrealised changes in the fair value of energy derivatives 4 753 - 1 688 1 967 - 1 789
- of which, unrealised changes in the fair value of inventories 476 - 556 418 125
- of which, restructuring costs - 854 - 148 - 709 - 19
- of which, other non-recurring items affecting comparability 1 519 815 931 221
2) Including interest components related to pension costs - 538 - 871 - 132 - 207
3) Including discounting effects attributable to provisions - 2 165 - 2 297 - 553 - 576
4) Items affecting comparability recognised as
financial income and expenses, net - 1 - 1 - 1 —
15. 15
VATTENFALL YEAR-END REPORT 2020
Consolidated statement of
comprehensive income
Full year Full year Oct-Dec Oct-Dec
Amounts in SEK million 2020 2019 2020 2019
Profit for the period 7 716 14 861 5 727 488
Other comprehensive income
Items that will be reclassified to profit or loss when specific conditions are met
Cash flow hedges - changes in fair value 3 023 181 3 287 - 858
Cash flow hedges - dissolved against income statement 4 310 - 5 641 267 - 2 267
Cash flow hedges - transferred to cost of hedged item - 43 - 34 12 - 8
Hedging of net investments in foreign operations 1 808 - 1 275 1 864 682
Translation differences, divested companies - 5 - 94 — - 18
Translation differences - 4 084 2 728 - 4 251 - 1 865
Income taxes related to items that will be reclassified - 2 587 2 157 - 1 676 901
Total items that will be reclassified to profit or loss when specific conditions are met 2 422 - 1 978 - 497 - 3 433
Items that will not be reclassified to profit or loss
Remeasurement pertaining to defined benefit obligations - 1 505 - 4 577 - 2 224 3 301
Income taxes related to items that will not be reclassified 392 1 244 667 - 913
Total items that will not be reclassified to profit or loss - 1 113 - 3 333 - 1 557 2 388
Total other comprehensive income, net after income taxes 1 309 - 5 311 - 2 054 - 1 045
Total comprehensive income for the period 9 025 9 550 3 673 - 557
Attributable to owner of the Parent Company 8 260 7 757 3 563 - 532
Attributable to non-controlling interests 765 1 793 110 - 25
16. 16
VATTENFALL YEAR-END REPORT 2020
Operating segments, Vattenfall Group
Full year Full year Oct-Dec Oct-Dec
Amounts in SEK million 2020 2019 2020 2019
External net sales
Customers & Solutions 84 661 87 343 23 470 25 078
Power Generation 36 597 38 425 9 571 10 230
Wind 6 901 6 578 2 047 1 899
Heat 13 538 15 947 4 165 4 188
Distribution 16 970 17 903 4 736 4 719
- of which, Distribution Germany 5 464 6 498 1 339 1 599
- of which, Distribution Sweden 11 377 11 288 3 358 3 086
Other1
180 164 43 65
Total 158 847 166 360 44 032 46 179
Internal net sales
Customers & Solutions 1 637 2 516 461 695
Power Generation 53 536 63 953 15 254 17 448
Wind 6 664 6 914 1 912 2 091
Heat 9 790 15 456 3 114 3 970
Distribution 4 674 4 637 1 246 1 219
- of which, Distribution Germany 4 107 4 156 1 110 1 078
- of which, Distribution Sweden 597 509 142 147
Other1
5 737 5 392 1 619 1 395
Eliminations - 82 038 - 98 868 - 23 606 - 26 818
Total — — — —
Total net sales
Customers & Solutions 86 298 89 859 23 931 25 773
Power Generation 90 133 102 378 24 825 27 678
Wind 13 565 13 492 3 959 3 990
Heat 23 328 31 403 7 279 8 158
Distribution 21 644 22 540 5 982 5 938
- of which, Distribution Germany 9 571 10 654 2 449 2 677
- of which, Distribution Sweden 11 974 11 797 3 500 3 233
Other1
5 917 5 556 1 662 1 460
Eliminations - 82 038 - 98 868 - 23 606 - 26 818
Total 158 847 166 360 44 032 46 179
17. 17
VATTENFALL YEAR-END REPORT 2020
Full year Full year Oct-Dec Oct-Dec
Amounts in SEK million 2020 2019 2020 2019
Operating profit before depreciation, amortisation and impairment losses (EBITDA)
Customers & Solutions 2 832 2 976 456 1 158
Power Generation 23 144 13 642 6 580 220
Wind 9 482 9 645 3 045 3 148
Heat 2 644 4 957 - 187 1 839
Distribution 8 713 8 236 2 326 2 397
- of which, Distribution Germany 2 162 2 175 539 562
- of which, Distribution Sweden 6 505 6 018 1 766 1 827
Other1
- 299 3 097 - 204 - 18
Eliminations - 9 - 108 105 100
Total 46 507 42 445 12 121 8 844
Underlying operating profit before depreciation, amortisation and impairment losses
Customers & Solutions 3 083 3 021 611 1 180
Power Generation 18 796 19 207 4 997 5 148
Wind 9 426 9 620 2 982 3 120
Heat 4 462 4 409 1 581 1 280
Distribution 8 725 8 248 2 328 2 402
- of which, Distribution Germany 2 174 2 189 542 567
- of which, Distribution Sweden 6 505 6 016 1 766 1 827
Other1
- 442 - 457 - 189 - 65
Eliminations - 9 - 108 105 100
Total 44 041 43 940 12 415 13 165
Full year Full year Oct-Dec Oct-Dec
Amounts in SEK million 2020 2019 2020 2019
Operating profit (EBIT)
Customers & Solutions 1 882 1 157 231 588
Power Generation 18 984 9 870 5 490 - 746
Wind 2 401 3 603 1 639 1 132
Heat - 12 149 354 - 3 257 46
Distribution 5 313 4 986 1 452 1 540
- of which, Distribution Germany 1 081 1 118 266 277
- of which, Distribution Sweden 4 225 3 858 1 177 1 265
Other1
- 1 146 2 279 - 414 - 233
Eliminations - 9 - 108 105 100
Operating profit (EBIT) 15 276 22 141 5 246 2 427
Operating profit (EBIT) 15 276 22 141 5 246 2 427
Financial net - 3 270 - 3 819 - 693 - 2 254
Profit before tax 12 006 18 322 4 553 173
Underlying operating profit
Customers & Solutions 2 146 1 337 387 744
Power Generation 14 670 15 437 3 938 4 186
Wind 3 970 4 155 1 716 1 680
Heat 978 550 784 232
Distribution 5 325 4 998 1 454 1 544
- of which, Distribution Germany 1 093 1 132 268 281
- of which, Distribution Sweden 4 225 3 856 1 177 1 265
Other1
- 1 290 - 1 274 - 397 - 279
Eliminations - 9 - 108 105 100
Underlying operating profit 25 790 25 095 7 987 8 207
1) “Other” pertains mainly to all Staff functions, including Treasury, Shared Service Centres and material capital gains and -losses.
18. 18
VATTENFALL YEAR-END REPORT 2020
Consolidated balance sheet
31 Dec 31 Dec
Amounts in SEK million 2020 2019
Assets
Non-current assets
Intangible assets: non-current 16 524 18 735
Property, plant and equipment 249 120 256 700
Participations in associated companies and joint arrangements 4 347 4 827
Other shares and participations 304 333
Share in the Swedish Nuclear Waste Fund 48 270 45 691
Derivative assets 9 449 7 788
Deferred tax assets 13 824 14 583
Other non-current receivables 5 529 5 537
Total non-current assets 347 367 354 194
Current assets
Inventories 16 828 13 353
Intangible assets: current 192 135
Trade receivables and other receivables 23 812 26 345
Contract assets 416 188
Advance payments paid 1 046 3 996
Derivative assets 9 962 10 080
Prepaid expenses and accrued income 6 935 7 853
Current tax assets 280 1 163
Short-term investments 30 148 22 551
Cash and cash equivalents 26 074 10 604
Assets held for sale 188 318
Total current assets 115 881 96 586
Total assets 463 248 450 780
Equity and liabilities
Equity
Attributable to owner of the Parent Company 97 724 93 631
Attributable to non-controlling interests 13 468 14 891
Total equity 111 192 108 522
Non-current liabilities
Hybrid Capital 19 304 20 164
Other interest-bearing liabilities 49 091 52 405
Pension provisions 43 824 44 026
Other interest-bearing provisions 108 665 102 395
Derivative liabilities 7 924 7 833
Deferred tax liabilities 17 617 14 713
Contract liabilities 8 752 8 462
Other noninterest-bearing liabilities 1 994 2 134
Total non-current liabilities 257 171 252 132
Current liabilities
Trade payables and other liabilities 24 912 27 809
Advance payments received 5 794 1 577
Derivative liabilities 8 901 13 701
Accrued expenses and deferred income 14 558 17 098
Current tax liabilities 838 1 502
Other interest-bearing liabilities 36 380 25 058
Interest-bearing provisions 3 462 3 371
Liabilities associated with assets held for sale 40 10
Total current liabilities 94 885 90 126
Total equity and liabilities 463 248 450 780
19. 19
VATTENFALL YEAR-END REPORT 2020
SUPPLEMENTARY INFORMATION
31 Dec 31 Dec
Amounts in SEK million 2020 2019
Calculation of capital employed
Intangible assets: current and non-current 16 716 18 870
Property, plant and equipment 249 120 256 700
Participations in associated companies and joint arrangements 4 347 4 827
Deferred and current tax assets 14 104 15 746
Non-current noninterest-bearing receivables 3 853 3 758
Contract assets 416 188
Inventories 16 828 13 353
Trade receivables and other receivables 23 812 26 345
Prepaid expenses and accrued income 6 935 7 853
Unavailable liquidity 5 374 3 859
Other 483 530
Total assets excl. financial assets 341 988 352 029
Deferred and current tax liabilities - 18 455 - 16 215
Other noninterest-bearing liabilities - 1 994 - 2 134
Contract liabilities - 8 752 - 8 462
Trade payable and other liabilities - 24 912 - 27 809
Accrued expenses and deferred income - 14 558 - 17 098
Other - 232 - 186
Total noninterest-bearing liabilities - 68 903 - 71 904
Other interest-bearing provisions not related to adjusted net debt1
- 10 619 - 11 314
Capital employed2
262 466 268 811
Capital employed, average 265 639 260 190
Calculation of net debt
Hybrid Capital - 19 304 - 20 164
Bond issues and liabilities to credit institutions - 49 642 - 38 829
Short-term debt, commercial papers and repo - 13 268 - 17 453
Present value of liabilities pertaining to acquisitions of Group companies - 1 - 28
Liabilities to associated companies - 688 - 733
Liabilities to owners of non-controlling interests - 10 931 - 10 647
Other liabilities - 10 941 - 9 773
Total interest-bearing liabilities - 104 775 - 97 627
Cash and cash equivalents 26 074 10 604
Short-term investments 30 148 22 551
Loans to owners of non-controlling interests in foreign Group companies 375 206
Net debt2
- 48 178 - 64 266
Calculation of adjusted gross debt and net debt
Total interest-bearing liabilities - 104 775 - 97 627
50% of Hybrid Capital3
9 652 10 082
Present value of pension obligations - 43 824 - 44 026
Provisions for gas and wind operations and other environment-related provisions - 10 599 - 8 571
Provisions for nuclear power (net)4
- 37 794 - 35 521
Margin calls received 4 081 3 706
Liabilities to owners of non-controlling interests due to consortium agreements 10 931 10 647
Adjusted gross debt - 172 328 - 161 310
Reported cash and cash equivalents and short-term investments 56 222 33 155
Unavailable liquidity - 5 374 - 3 859
Adjusted cash and cash equivalents and short-term investments 50 848 29 296
Adjusted net debt2
- 121 480 - 132 014
1) Includes personnel-related provisions for non-pension purposes, provisions for tax and legal disputes and certain other provisions.
2) See Definitions and calculations of key ratios for definitions of Alternative Performance Measures.
3) 50% of Hybrid Capital is treated as equity by the rating agencies, which thereby reduces adjusted net debt.
4) The calculation is based on Vattenfall’s share of ownership in the respective nuclear power plants, less Vattenfall’s share in the Swedish Nuclear Waste Fund and
liabilities to associated companies. Vattenfall has the following ownership interests in the respective plants: Forsmark 66%, Ringhals 70.4%, Brokdorf 20%, Brunsbüttel
66.7%, Krümmel 50% and Stade 33.3%. (According to a special agreement, Vattenfall is responsible for 100% of the provisions for Ringhals.)
20. 20
VATTENFALL YEAR-END REPORT 2020
Consolidated statement of cash flows
Full year Full year Oct-Dec Oct-Dec
Amounts in SEK million 2020 2019 2020 2019
Operating activities
Operating profit before depreciation, amortisation and impairment losses (EBITDA) 46 507 42 445 12 121 8 844
Tax paid - 2 719 - 1 528 - 420 - 522
Capital gains/losses, net - 62 - 3 513 102 - 41
Interest received 183 329 72 156
Interest paid - 2 808 - 2 969 - 420 - 252
Other, incl. non-cash items - 6 077 185 - 87 3 335
Funds from operations (FFO) 35 024 34 949 11 368 11 520
Changes in inventories - 1 315 - 196 - 2 584 - 219
Changes in operating receivables - 1 344 - 6 294 - 6 094 - 8 159
Changes in operating liabilities - 3 726 9 171 2 742 9 662
Margin calls 12 588 - 20 733 9 238 - 7 900
Other changes 465 - 178 184 86
Cash flow from changes in operating assets and operating liabilities 6 668 - 18 230 3 486 - 6 530
Cash flow from operating activities 41 692 16 719 14 854 4 990
Investing activities
Acquisitions in Group companies - 86 - 754 - 19 - 2
Investments in associated companies and other shares and participations 223 256 78 20
Other investments in non-current assets - 21 484 - 26 335 - 5 710 - 9 810
Total investments - 21 347 - 26 833 - 5 651 - 9 792
Divestments 1 237 7 452 557 150
Cash and cash equivalents in acquired companies 20 148 20 1
Cash and cash equivalents in divested companies - 80 - 3 542 4 84
Cash flow from investing activities - 20 170 - 22 775 - 5 070 - 9 557
Cash flow before financing activities 21 522 - 6 056 9 784 - 4 567
Financing activities
Changes in short-term investments - 8 926 559 - 2 659 - 1 913
Changes in loans to owners of non-controlling interests in foreign Group companies - 185 282 57 33
Loans raised1
21 471 12 622 545 3 373
Amortisation of debt pertaining to acquisitions of Group companies - 27 - 23 — —
Amortisation of other debt - 12 156 - 12 001 - 1 057 2 072
Effect of early termination of swaps related to financing activities — — — - 258
Dividends paid to owners - 5 298 - 3 714 - 275 - 266
Contribution to/from owners of non-controlling interests - 829 - 1 138 - 364 - 466
Cash flow from financing activities - 5 950 - 3 413 - 3 753 2 575
Cash flow for the period 15 572 - 9 469 6 031 - 1 992
Full year Full year Oct-Dec Oct-Dec
Amounts in SEK million 2020 2019 2020 2019
Cash and cash equivalents
Cash and cash equivalents at start of period 10 604 17 094 20 180 12 773
Cash and cash equivalents included in assets held for sale — 2 992 — —
Cash flow for the period 15 572 - 9 469 6 031 - 1 992
Translation differences - 102 - 13 - 137 - 177
Cash and cash equivalents at end of period 26 074 10 604 26 074 10 604
21. 21
VATTENFALL YEAR-END REPORT 2020
SUPPLEMENTARY INFORMATION
Full year Full year Oct-Dec Oct-Dec
Amounts in SEK million 2020 2019 2020 2019
Cash flow before financing activities 21 522 - 6 056 9 784 - 4 567
Financing activities
Effects from terminating swaps related to financing activities — — — - 258
Dividends paid to owners - 5 298 - 3 714 - 275 - 266
Contribution to/from owners of non-controlling interests - 829 - 1 138 - 364 - 466
Cash flow after dividend 15 395 - 10 908 9 145 - 5 557
Analysis of change in net debt
Net debt at start of period - 64 266 - 47 728 - 58 858 - 59 648
Change accounting principles — - 4 609 — —
Cash flow after dividend 15 395 - 10 908 9 145 - 5 557
Changes as a result of valuation at fair value - 171 - 456 141 416
Changes in interest-bearing liabilities for leasing - 2 837 - 711 - 1 712 - 177
Interest-bearing liabilities/short-term investments acquired/divested 24 - 11 — - 9
Cash and cash equivalents included in assets held for sale — 2 992 — —
Interest-bearing liabilities associated with assets held for sale — - 792 — 2
Translation differences on net debt 3 677 - 2 043 3 106 707
Net debt at end of period - 48 178 - 64 266 - 48 178 - 64 266
Cash flow from operating activities 41 692 16 719 14 854 4 990
Maintenance/replacement investments - 12 539 - 15 148 - 4 655 - 6 161
Free cash flow2
29 153 1 571 10 199 - 1 171
1) Short-term borrowings in which the duration is three months or shorter are reported net.
2) See Definitions and calculations of key ratios for definitions of Alternative Performance Measures.
22. 22
VATTENFALL YEAR-END REPORT 2020
INVESTMENTS
Full year Full year Oct-Dec Oct-Dec
Amounts in SEK million 2020 2019 2020 2019
Electricity generation
Hydro power 920 920 349 352
Nuclear power 1 877 2 213 499 583
Coal power 22 139 15 77
Gas 192 277 33 110
Wind power and solar PV 7 709 7 501 2 568 1 972
Biomass, waste 295 149 71 58
Total electricity generation 11 015 11 199 3 535 3 152
CHP/heat
Fossil-based power 1 261 2 134 396 659
Heat networks 1 400 1 522 598 643
Other 933 760 418 293
Total CHP/heat 3 594 4 416 1 412 1 595
Electricity networks
Electricity networks 7 435 7 071 2 511 2 939
Total electricity networks 7 435 7 071 2 511 2 939
Purchases of shares, shareholder contributions - 137 498 - 59 - 18
Other 1 690 1 754 512 796
Total investments 23 597 24 938 7 911 8 464
Accrued investments, unpaid invoices (-)/
release of accrued investments (+) - 2 250 1 895 - 2 260 1 328
Total investments with cash flow effect 21 347 26 833 5 651 9 792
23. 23
VATTENFALL YEAR-END REPORT 2020
Consolidated statement of changes in equity
31 Dec 2020 31 Dec 2019
Amounts in SEK million
Attributable
to owner of
the Parent
Company
Attributable
to non-
controlling
interests
Total
equity
Attributable
to owner of
the Parent
Company
Attributable
to non-
controlling
interests
Total
equity
Balance brought forward 93 631 14 891 108 522 88 096 15 501 103 597
Profit for the period 6 489 1 227 7 716 13 173 1 688 14 861
Cash flow hedges - changes in fair value 3 023 — 3 023 181 — 181
Cash flow hedges - dissolved against income statement 4 344 - 34 4 310 - 5 624 - 17 - 5 641
Cash flow hedges - transferred to cost of hedged item - 43 — - 43 - 34 — - 34
Hedging of net investments in foreign operations 1 808 — 1 808 - 1 275 — - 1 275
Translation differences, divested companies - 5 — - 5 - 94 — - 94
Translation differences - 3 684 - 400 - 4 084 2 504 224 2 728
Remeasurement pertaining to defined benefit obligations - 1 465 - 40 - 1 505 - 4 443 - 134 - 4 577
Income taxes related to other comprehensive income - 2 207 12 - 2 195 3 369 32 3 401
Total other comprehensive income for the period 1 771 - 462 1 309 - 5 416 105 - 5 311
Total comprehensive income for the period 8 260 765 9 025 7 757 1 793 9 550
Dividends paid to owners - 3 623 - 1 675 - 5 298 - 2 000 - 1 714 - 3 714
Group contributions from(+)/to(-) owners of non-controlling interests — - 1 - 1 — 30 30
Contribution to/from owners of non-controlling interests — - 829 - 829 — - 1 138 - 1 138
Changes as a result of changed ownership — - 227 - 227 — 197 197
Other changes - 544 544 — - 222 222 —
Total transactions with equity holders - 4 167 - 2 188 - 6 355 - 2 222 - 2 403 - 4 625
Balance carried forward 97 724 13 468 111 192 93 631 14 891 108 522
- Of which, Reserve for hedges 1 970 - 5 1 965 - 3 147 22 - 3 125
24. 24
VATTENFALL YEAR-END REPORT 2020
Key ratios, Vattenfall Group
Full year Full year Oct-Dec Oct-Dec
In % unless otherwise stated. (x) means times1
2020 2019 2020 2019
Operating margin 9.6 13.3 11.9 5.3
Operating margin2
16.2 15.1 18.1 17.8
Pre-tax profit margin 7.6 11.0 10.3 0.4
Pre-tax profit margin2
14.2 12.8 16.6 12.9
Return on equity 6.7 14.0 6.73
14.03
Return on capital employed 5.8 8.5 5.83
8.53
Return on capital employed2
9.7 9.6 9.73
9.63
EBIT interest cover, (x) 4.3 5.3 4.33
5.33
EBIT interest cover, (x)2
7.1 6.0 7.13
6.03
FFO interest cover, (x) 10.4 9.3 10.43
9.33
FFO interest cover, net, (x) 12.1 10.3 12.13
10.33
Cash flow interest cover after maintenance investments, (x) 10.2 1.5 10.23
1.53
FFO/gross debt 33.4 35.8 33.43
35.83
FFO/net debt 72.7 54.4 72.73
54.43
FFO/adjusted net debt 28.8 26.5 28.83
26.53
EBITDA/net financial items, (x) 14.7 11.2 15.7 8.7
EBITDA/net financial items, (x)2
13.9 11.6 16.1 12.9
Equity/Total assets 24.0 24.1 24.0 24.1
Gross debt/equity 94.2 90.0 94.2 90.0
Net debt/equity 43.3 59.2 43.3 59.2
Gross debt/gross debt plus equity 48.5 47.4 48.5 47.4
Net debt/net debt plus equity 30.2 37.2 30.2 37.2
Net debt/EBITDA, (x) 1.0 1.5 1.03
1.53
Adjusted net debt/EBITDA, (x) 2.6 3.1 2.63
3.13
1) See Definitions and calculations of key ratios for definitions of Alternative Performance Measures.
2) Based on Underlying operating profit.
3) Last 12-month values.
26. 26
VATTENFALL YEAR-END REPORT 2020
Q4 Q3 Q2 Q1 Q4 Q3 Q2 Q1
In % unless otherwise stated. (x) means times1
2020 2020 2020 2020 2019 2019 2019 2019
Key ratios
Return on equity1
6.7 1.5 4.4 14.4 14.0 16.8 12.04
13.84
Return on capital employed2
5.8 4.7 6.1 9.4 8.5 9.2 7.1 7.1
Return on capital employed2, 3
9.7 9.9 9.2 9.2 9.6 8.3 7.5 7.6
EBIT interest cover, (x)2
4.3 3.3 4.1 5.7 5.3 6.0 5.1 5.1
EBIT interest cover, (x)2, 3
7.1 6.8 6.1 5.6 6.0 5.4 5.4 5.4
FFO/gross debt2
33.4 32.4 31.2 32.8 35.8 32.7 25.9 24.4
FFO/net debt2
72.7 59.8 49.9 45.8 54.4 51.5 36.4 33.5
FFO/adjusted net debt2
28.8 27.9 25.5 25.2 26.5 24.5 19.2 18.1
Equity/assets ratio 24.0 24.0 22.8 24.8 24.1 24.5 23.1 23.9
Gross debt/equity 94.2 100.6 111.0 93.1 90.0 85.7 97.0 91.7
Net debt/equity 43.3 54.6 69.3 66.7 59.2 54.5 69.1 66.8
Net debt/net debt plus equity 30.2 35.3 40.9 40.0 37.2 35.3 40.9 40.0
Net debt/EBITDA, (x)2
1.0 1.4 1.5 1.7 1.5 1.4 2.0 2.0
Adjusted net debt/EBITDA, (x)2
2.6 2.9 3.0 3.2 3.1 3.0 3.7 3.7
1) See Definitions and calculations of key ratios for definitions of Alternative Performance Measures.
2) Last 12-month values.
3) Based on Underlying operating profit.
4) The value has been adjusted compared with information previously published in Vattenfall’s financial reports.
27. 27
VATTENFALL YEAR-END REPORT 2020
NOTE 1 | Accounting policies, risks and uncertainties
Accounting policies
This interim report for the Group has been prepared in accordance with
IAS 34 – “Interim Financial Reporting”, and the Swedish Annual
Accounts Act. The accounting policies and calculation methods applied
in this interim report are the same as those described in Vattenfall’s 2019
Annual and Sustainability Report in Note 3 to the consolidated accounts,
Accounting policies. Amended IFRSs endorsed by the EU for application
in the 2020 financial year have no significant effect on Vattenfall’s
financial statements.
Risks and uncertainties
For a description of risks, uncertainties and risk management, please
refer to Vattenfall’s 2019 Annual and Sustainability Report, pages 62-71.
Apart from the information provided under “Business highlights” in this
report and under “Business highlights” in previously published interim
reports in 2020, no other material changes have taken place since the
publication. Furthermore, the group assesses that materialized risks
following Covid-19 are still in line with Vattenfall’s risk assessments for
the Annual and Sustainability Report 2019. However, the probability of
downside events has significantly increased compared to the pre-Covid-
19 world
Other
Significant related-party transactions are described in Note 44 to the
consolidated accounts in Vattenfall’s 2019 Annual and Sustainability
Report. No material changes have taken place in relations or
transactions with related parties since the publication. In addition to the
significant contingent liabilities described in Note 40 to the consolidated
accounts in Vattenfall’s 2019 Annual and Sustainability Report, the
Nuclear Power plant Kernkraftwerk Krümmel GmbH & Co. OHG, in
which Vattenfall has a shareholding of 50%, sold additional production
rights to the co-shareholder PreussenElektra GmbH. Vattenfall’s share of
the sales price for the production rights sold during 2020 is SEK 2.8
billion. Early January 2021 additional production rights has been sold
where Vattenfall’s share of the sales price is SEK 1.4 billion, including
this, Vattenfall’s accumulated share is SEK 5.5 billion. The price for all
production rights sold is subject to a court proceeding initiated by
PreussenElektra. Should a lower price be confirmed by the court, a
repayment must be made.
NOTE 2 | Exchange rates
KEY EXCHANGE RATES APPLIED IN THE ACCOUNTS OF THE VATTENFALL GROUP
Full year Full year Oct-Dec Oct-Dec
2020 2019 2020 2019
Average rate
EUR 10.4789 10.5572 10.2871 10.5980
DKK 1.4056 1.4140 1.3820 1.4188
GBP 11.8334 12.0391 11.3916 12.2887
USD 9.1718 9.4180 8.6406 9.5800
31 Dec 31 Dec
2020 2019
Balance sheet date rate
EUR 10.0343 10.4468
DKK 1.3485 1.3982
GBP 11.1613 12.2788
USD 8.1773 9.2993
28. 28
VATTENFALL YEAR-END REPORT 2020
NOTE 3 | Financial instruments by measurement category and related effects on income
For assets and liabilities with a remaining maturity less than three
months (e.g., cash and bank balances, trade receivables and other
receivables and trade payables and other payables), fair value is
considered to be equal to the carrying amount. For other shares and
participations the fair value is approximated by using cost.
The carrying amounts of financial assets do not differ significantly from
their fair values. The difference between carrying amounts and fair
values for financial liabilities amounts to SEK 8,509 million (31 December
2019: 7,580).
Financial instruments that are measured at fair value on the balance
sheet are described below according to the fair value hierarchy (levels),
which in IFRS 13 is defined as:
Level 1: Quoted prices (unadjusted) in active markets for identical assets
or liabilities.
Level 2: Inputs other than quoted prices included in Level 1 that are
observable for the asset or liability, either directly (that is, as prices) or
indirectly (that is, derived from prices). In Level 2 Vattenfall reports
mainly commodity derivatives, currency-forward contracts and interest
rate swaps.
Level 3: Inputs for the asset or liability that are not based on observable
market data.
FINANCIAL ASSETS AND LIABILITIES THAT ARE MEASURED AT FAIR VALUE ON THE BALANCE SHEET AT 31 DECEMBER
2020
Amounts in SEK million Level 1 Level 2 Level 3 Total
Assets
Share in the Swedish Nuclear Waste Fund 48 270 — — 48 270
Derivative assets — 18 911 500 19 411
Short-term investments, cash equivalents and other shares and participations 29 900 8 011 — 37 911
Total assets 78 170 26 922 500 105 592
Liabilities
Derivative liabilities — 16 825 — 16 825
Total liabilities — 16 825 — 16 825
FINANCIAL ASSETS AND LIABILITIES THAT ARE MEASURED AT FAIR VALUE ON THE BALANCE SHEET AT 31 DECEMBER
2019
Amounts in SEK million Level 1 Level 2 Level 3 Total
Assets
Share in the Swedish Nuclear Waste Fund 45 691 — — 45 691
Derivative assets — 17 490 377 17 867
Short-term investments, cash equivalents and other shares and participations 15 870 8 430 — 24 300
Total assets 61 561 25 920 377 87 858
Liabilities
Derivative liabilities — 21 514 20 21 534
Total liabilities — 21 514 20 21 534
29. 29
VATTENFALL YEAR-END REPORT 2020
NOTE 4 | Acquired and divested operations
Divested operations
On 20th
of February 2020, Vattenfall signed an agreement to sell its 55%
shareholding in the waste incineration plant Müllverwertung Rugenberger
Damm GmbH (MVR), to the co-shareholder Stadtreinigung Hamburg, a
subsidiary of the City of Hamburg. The transaction received approval
from the cartel office and was closed in the beginning of May. The
consideration received amounts to SEK 506 million and the capital gain
to.SEK 207 million.
NOTE 5 | Impairment losses and reversed impairment losses
Accounting policy
Assessments are made on a regular basis throughout the year for any
indication that an asset may have decreased in value. If any such
indication is identified, the asset’s recoverable amount is estimated, and
an impairment test is performed. For a description of the principles for
such calculations, please refer to Note 9 to the consolidated accounts in
Vattenfall’s 2019 Annual and Sustainability Report. During 2020 a
change has been implemented relating to cash generating units within
business area Wind whereby cash generating units now consists of
onshore respective offshore wind power plants in the respective
countries where Vattenfall operates within the business area.
Impairment losses 2020
During the period impairment losses of SEK 12,980 million have been
charged against operating profit. Of this amount, SEK 11,337 million
pertains to the Moorburg power plant in business area Heat. In business
area Wind, impairment losses of SEK 1,609 million were recognised in
units in Sweden, Denmark and UK. The remaining amount pertains to
smaller impairments.
In addition to the above, deferred tax assets in Germany were written
down by SEK 401 million as poorer market conditions have led to greater
uncertainty as to whether these can be utilised, resulting in a higher tax
expense during the period.
No previously recognised impairment losses have been reversed in the
income statement.
NOTE 6 | Effects of COVID-19
Overall effect on operations
Fundamentally the impact of the general societal shutdown on
Vattenfall’s operations is not significant. Vattenfall has not utilised
government support for short-term work and employee furloughs in any
market. All plants have continued to deliver according to plan.
Expected credit losses
In addition to what is described in Note 1 about risks and uncertainties,
Vattenfall has in earlier reports 2020 increased its provision for expected
credit losses, as the assessment was that slightly more customers than
previously were expected to encounter payment difficulties. The financial
effect on the group amounted in Q3 to SEK 50 million. This provision has
now been released as no general increase in customers having payment
difficulties was observed. For a description of the accounting policy for
provisions to loss reserves, see Note 23 to the consolidated accounts in
Vattenfall’s 2019 Annual and Sustainability Report.
.
30. 30
VATTENFALL YEAR-END REPORT 2020
The Parent Company Vattenfall AB
Accounting policies
The Parent Company Vattenfall AB’s accounts are prepared in
accordance with the Swedish Annual Accounts Act and recommendation
RFR 2 – Accounting for Legal Entities, issued by the Swedish Financial
Reporting Board. The accounting policies used in this interim report are
the same as those described in Vattenfall’s 2019 Annual and
Sustainability Report, Note 3 to the Parent Company accounts,
Accounting policies. New accounting policies applicable from 1 January
2020 has had no significant effect on the Parent Company’s financial
statements.
January – December 2020
A condensed income statement and balance sheet for the Parent
Company are presented below.
• Net sales amounted to SEK 41,969 million (49,807).
• Profit before appropriations and income taxes was SEK 11,162
million (21,088).
• Lower prices on electricity had a negative effect on earnings,
unrealized changes in fair value of energy derivatives impacted
positively. Dividend received from subsidiaries amounted to SEK
703 million (8,226). Lower financial expenses due to exchange rate
effects impacted earnings positively.
• The balance sheet total was SEK 305,916 million (31 December
2019: 282,662).
• Investments during the period amounted to SEK 3,006 million
(11,917), Whereof SEK 526 million of this year’s amount pertains to
group internal asset transactions and SEK 776 million pertains to
group internal share transactions, SEK 10,500 of last year’s amount
pertains to group internal share transactions.
• Cash and cash equivalents, and short-term investments amounted
to SEK 53,043 million (31 December 2019: 28,573).
• Dividend paid to the owner of SEK 3,623 million (2,000)
Presentation of Parent Company income statements
See Note 1 to the consolidated accounts, Accounting policies, risks and
uncertainties.
Risks and uncertainties
See Note 1 to the consolidated accounts, Accounting policies, risks and
uncertainties.
Other
Significant related-party transactions are described in Note 44 to the
consolidated accounts, Related party disclosures, in Vattenfall’s 2019
Annual and Sustainability Report. No material changes have taken place
in relations or transactions with related parties compared with the
description in Vattenfall’s 2019 Annual and Sustainability Report.
31. 31
VATTENFALL YEAR-END REPORT 2020
Parent Company income statement
Full year Full year
Amounts in SEK million 2020 2019
Net sales 41 969 49 807
Cost of purchases - 23 800 - 28 256
Other external expenses - 4 744 - 3 697
Personnel expenses - 2 116 - 2 083
Other operating incomes and expenses, net 170 160
Operating profit before depreciation, amortisation and impairment losses (EBITDA) 11 479 15 931
Depreciation, amortisation and impairments - 596 - 525
Operating profit (EBIT) 10 883 15 406
Result from participations in subsidiaries 408 8 226
Result from participations in associated companies — 1
Other financial income 2 593 1 592
Other financial expenses - 2 722 - 4 137
Profit before appropriations and income taxes 11 162 21 088
Appropriations - 394 498
Profit before income taxes 10 768 21 586
Income taxes - 2 243 - 2 890
Profit for the period 8 525 18 696
32. 32
VATTENFALL YEAR-END REPORT 2020
Parent Company balance sheet
31 Dec 31 Dec
Amounts in SEK million 2020 2019
Assets
Non-current assets
Intangible assets: non-current 356 333
Property, plant and equipment 6 618 5 273
Shares and participations 161 474 160 465
Deferred tax assets 313 762
Other non-current receivables 69 078 66 195
Total non-current assets 237 839 233 028
Current assets
Inventories 411 383
Intangible assets: current 38 168
Current receivables 14 585 20 510
Short-term investments 29 301 21 702
Cash and cash equivalents 23 742 6 871
Total current assets 68 077 49 634
Total assets 305 916 282 662
Equity, provisions and liabilities
Equity
Restricted equity
Share capital (131,700,000 shares with a share quota value of SEK 50) 6 585 6 585
Revaluation reserve 37 989 37 989
Other reserves 1 492 1 480
Non-restricted equity
Retained earnings 61 540 46 479
Profit for the period 8 525 18 696
Total equity 116 131 111 229
Untaxed reserves 13 342 11 598
Provisions 5 138 5 219
Non-current liabilities
Hybrid capital 19 305 20 167
Other interest-bearing liabilities 35 506 40 494
Other noninterest-bearing liabilities 12 762 12 148
Total non-current liabilities 67 573 72 809
Current liabilities
Other interest-bearing liabilities 95 706 70 892
Current tax liabilities 122 249
Other noninterest-bearing liabilities 7 904 10 666
Total current liabilities 103 732 81 807
Total equity, provisions and liabilities 305 916 282 662
33. 33
VATTENFALL YEAR-END REPORT 2020
Definitions and calculations of key ratios
Alternative Performance Measures
In order to ensure a fair presentation of the Group’s operations, the
Vattenfall Group uses a number of Alternative Performance Measures
that are not defined in IFRS or in the Swedish Annual Accounts Act. The
Alternative Performance Measures that Vattenfall uses are described
below, including their definitions and how they are calculated. The
Alternative Performance Measures used are unchanged compared with
earlier periods.
Definition
EBIT: Operating profit (Earnings Before Interest and Tax)
EBITDA: Operating profit before depreciation, amortisation and impairment losses (Earnings Before Interest, Tax,
Depreciation and Amortisation)
Items affecting comparability: Capital gains and capital losses from shares and other non-current assets, impairment losses and reversed
impairment losses and other material items that are of an infrequent nature. Also included here are, for trading
activities, unrealised changes in the fair value of energy derivatives, which according to IFRS 9 cannot be
recognised using hedge accounting and unrealised changes in the fair value of inventories. See Consolidated
income statement for a specification of items affecting comparability.
Underlying EBITDA: Underlying operating profit before depreciation, amortisation and impairment losses. This measure is intended to
provide a better view on the operating result by excluding items affecting comparability that are of an infrequent
nature, while also excluding non-cash depreciation and amortisation.
Underlying operating profit: Operating profit (EBIT) excluding items affecting comparability. This measure is intended to provide a better view
on the operating result by excluding items affecting comparability that are of an infrequent nature.
FFO: Funds From Operations, see Consolidated statement of cash flow
Free cash flow: Cash flow from operating activities less maintenance investments
Interest-bearing liabilities See Consolidated balance sheet - Supplementary Information
Net debt: See Consolidated balance sheet - Supplementary Information
Adjusted net debt: See Consolidated balance sheet - Supplementary Information
Capital employed: Total assets less financial assets, noninterest-bearing liabilities and certain other interest-bearing provisions not
included in adjusted net debt. see Consolidated balance sheet - Supplementary Information
Other definitions Definition
Hybrid Capital: Perpetual subordinated securities, junior to all Vattenfall’s unsubordinated debt instruments.
LTIF: Lost Time Injury Frequency (LTIF) is expressed in terms of the number of lost time work injuries (per 1 million
hours worked), i.e., work-related accidents resulting in absence longer than one day, and accidents resulting in
fatality.
CALCULATION OF EBITDA, UNDERLYING EBITDA AND UNDERLYING EBIT
Full year Full year Oct-Dec Oct-Dec
Amounts in SEK million 2020 2019 2020 2019
Operating profit (EBIT) 15 276 22 141 5 246 2 427
Depreciation, amortisation and impairment losses - 31 231 - 20 304 - 6 875 - 6 417
Operating profit before depreciation, amortisation and impairment losses (EBITDA) 46 507 42 445 12 121 8 844
Items affecting comparability excl. impairment losses and reversed impairment losses - 2 466 1 495 294 4 321
Underlying operating profit before depreciation, amortisation and impairment losses 44 041 43 940 12 415 13 165
Operating profit (EBIT) 15 276 22 141 5 246 2 427
Items affecting comparability 10 514 2 954 2 741 5 780
Underlying operating profit 25 790 25 095 7 987 8 207
34. 34
VATTENFALL YEAR-END REPORT 2020
The key ratios are presented as percentages (%) or times (x).
KEY RATIOS BASED ON CONTINUING OPERATIONS AND LAST 12-MONTH VALUES JANUARY 2020– DECEMBER 2020
Operating margin, % = 100 x
EBIT 15 276
= 9.6
Net sales 158 847
Operating margin excl. items
= 100 x
Underlying EBIT 25 790
= 16.2
affecting comparability, % Net sales 158 847
Pre-tax profit margin, % = 100 x
Profit before income taxes 12 006
= 7.6
Net sales 158 847
Pre-tax profit margin excl. items
= 100 x
Profit before income taxes excl. items affecting comparability 22 521
= 14.2
affecting comparability, % Net sales 158 847
Return on equity, % = 100 x
Profit for the period attributable to owner of the Parent Company 6 489
= 6.7
Average equity for the period attributable to owner of the 97 556
Parent Company excl. the Reserve for cash flow hedges
Return on capital employed, % = 100 x
EBIT 15 276
= 5.8
Capital employed, average 265 639
Return on capital employed excl.
= 100 x
Underlying EBIT 25 790
= 9.7
items affecting comparability, % Capital employed, average 265 639
EBIT + financial income excl. return from the Swedish Nuclear
EBIT interest cover, (x) =
Waste Fund 15 834
= 4.3
Financial expenses excl. discounting effects attributable to 3 721
provisions
Underlying EBIT + financial income excl. Return
EBIT interest cover excl. Items = from the Swedish Nuclear Waste Fund 26 348 = 7.1
affecting comparability, (x) Financial expenses excl. discounting effects attributable to 3 721
provisions
FFO + financial expenses excl.
FFO interest cover, (x) =
discounting effects attributable to provisions 38 745
= 10.4
Financial expenses excl. discounting effects attributable to 3 721
provisions
FFO + financial items net excl. discounting effects attributable
FFO interest cover, net, (x) =
to provisions and return from the Swedish Nuclear Waste Fund 38 187
= 12.1
Financial items net excl. discounting effects attributable to 3 163
provisions and return from the Swedish Nuclear Waste Fund
35. 35
VATTENFALL YEAR-END REPORT 2020
Cash flow from operating activities less maintenance
investments + financial expenses excl. Discounting
Cash flow interest cover after
=
effects attributable to provisions and interest components
related to pension costs 32 336
= 10.2
maintenance investments, (x) Financial expenses excl. discounting effects attributable to 3 183
provisions and interest components related to pension costs
FFO/gross debt, % = 100 x
FFO 35 024
= 33.4
Interest-bearing liabilities 104 775
FFO/net debt, % = 100 x
FFO 35 024
= 72.7
Net debt 48 178
FFO/adjusted net debt, % = 100 x
FFO 35 024
= 28.8
Adjusted net debt 121 480
EBITDA/net financial
=
EBITDA 46 507
= 14.7
items, (x) Financial items net excl. discounting effects attributable to 3 163
provisions and return from the Swedish Nuclear Waste Fund
EBITDA excl. items affecting
=
EBITDA excl. items affecting comparability 44 041
= 13.9
comparability/net financial Financial items net excl. discounting effects attributable to 3 163
items, (x) provisions and return from the Swedish Nuclear Waste Fund
KEY RATIOS BASED ON THE BALANCE SHEET PER 31 DECEMBER 2020
Equity/total assets, % = 100 x
Equity 111 192
= 24.0
Balance sheet total 463 248
Gross debt/equity, % = 100 x
Interest-bearing liabilities 104 775
= 94.2
Equity 111 192
Net debt/equity, % = 100 x
Net debt 48 178
= 43.3
Equity 111 192
Gross debt/gross debt
= 100 x
Interest-bearing liabilities 104 775
= 48.5
equity, % Interest-bearing liabilities + equity 215 967
Net debt/net debt plus
= 100 x
Net debt 48 178
= 30.2
equity, % Net debt + equity 159 370
Net debt/EBITDA, (x) =
Net debt 48 178
= 1.0
EBITDA 46 507
Adjusted net debt/
=
Adjusted net debt 121 480
= 2.6
EBITDA, (x) EBITDA 46 507
36. 36
VATTENFALL YEAR-END REPORT 2020
This is information is such that Vattenfall AB is obliged to make public in accordance with the EU Market Abuse Regulation. The
information was submitted for publication, through the agency of the contact persons set out above, at 08.00 CET on 4 February
2021. This report has been prepared in both Swedish and English versions. In the event of discrepancies between the two versions,
the Swedish version shall govern.
Dividend
In accordance with Vattenfall’s dividend policy, the Board of
Directors proposes a dividend of SEK 4,000 million,
corresponding to 62% of profit for the year attributable to
owners of the Parent Company.
Annual General Meeting
The Annual General Meeting will be held on 28 April 2021, in
Solna. The Annual General Meeting is open to the general
public. The Annual Report (in both Swedish and English
versions) is expected to be published on www.vattenfall.se
and www.vattenfall.com, respectively, on 29 March 2021.
Year-end report signature
Solna, 3 February 2021
Vattenfall AB (publ) The Board of Directors
This year-end report has not been reviewed by the
company’s auditor.
Financial calendar
Annual General Meeting, 28 April 2021
Interim report January-March, 29 April 2021
Interim report January-June, 20 July 2021
Interim report January-September, 28 October 2021
Contact information
Vattenfall AB (publ)
SE-169 92 Stockholm
Corporate identity number 556036-2138
T +46-8-739 50 00
www.vattenfall.com
www.vattenfall.se
Anna Borg
President and CEO
T +46-8-739 64 28
Kerstin Ahlfont
CFO
T +46-8-739 51 67
Johan Sahlqvist
Head of Investor Relations
T +46-8-739 72 51
Vattenfall’s press office
T +46-8-739 50 10
press@vattenfall.com