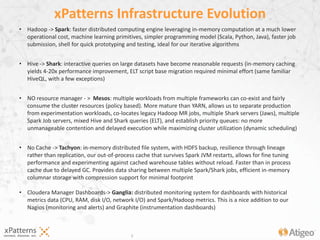
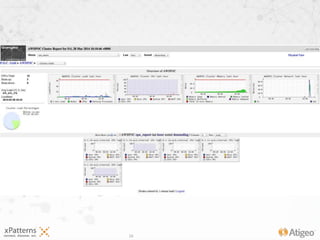
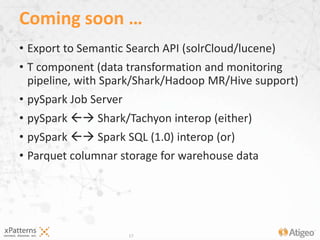
xPatterns is a big data analytics platform as a service that enables a rapid development of enterprise-grade analytical applications. It provides tools, api sets and a management console for building an ELT pipeline with data monitoring and quality gates, a data warehouse for ad-hoc and scheduled querying, analysis, model building and experimentation, tools for exporting data to NoSql and solrCloud cluster for real-time access through low-latency/high-throughput apis as well as dashboard and visualization api/tools leveraging the available data and models. In this presentation we will showcase one of the analytical applications build on top of xPatterns for our largest customer for that runs xPatterns in production on top a data warehouse consisting of several hundreds TB of medical, pharmacy and lab data records consisting of tens of billions of records. We will showcase the xPatterns components in the form of APIs and tools employed throughout the entire lifecycle of this application. The core of the presentation is the evolution of the infrastructure from the Hadoop/Hive stack to the new BDAS Spark, Shark, Mesos and Tachyon, with lessons learned and demos.
5. 5
• Hadoop -> Spark: faster distributed computing engine leveraging in-memory computation at a much lower
operational cost, machine learning primitives, simpler programming model (Scala, Python, Java), faster job
submission, shell for quick prototyping and testing, ideal for our iterative algorithms
• Hive -> Shark: interactive queries on large datasets have become reasonable requests (in-memory caching
yields 4-20x performance improvement, ELT script base migration required minimal effort (same familiar
HiveQL, with a few exceptions)
• NO resource manager - > Mesos: multiple workloads from multiple frameworks can co-exist and fairly
consume the cluster resources (policy based). More mature than YARN, allows us to separate production
from experimentation workloads, co-locates legacy Hadoop MR jobs, multiple Shark servers (Jaws), multiple
Spark Job servers, mixed Hive and Shark queries (ELT), and establish priority queues: no more
unmanageable contention and delayed execution while maximizing cluster utilization (dynamic scheduling)
• No Cache -> Tachyon: in-memory distributed file system, with HDFS backup, resilience through lineage
rather than replication, our out-of-process cache that survives Spark JVM restarts, allows for fine tuning
performance and experimenting against cached warehouse tables without reload. Faster than in process
cache due to delayed GC. Provides data sharing between multiple Spark/Shark jobs, efficient in-memory
columnar storage with compression support for minimal footprint
• Cloudera Manager Dashboards-> Ganglia: distributed monitoring system for dashboards with historical
metrics data (CPU, RAM, disk I/O, network I/O) and Spark/Hadoop metrics. This is a nice addition to our
Nagios (monitoring and alerts) and Graphite (instrumentation dashboards)
xPatterns Infrastructure Evolution
6. 6
• 20 billion healthcare records, 200 TB of compressed hdfs data
• Processing pipeline, a mixture of custom MR and mostly Hive scripts, converted to Spark and
Shark, with performance gains of 3-4x (for disk intensive operations) to 60x for queries on
cached tables (Spark cache or Tachyon which is slightly faster with added resilience benefits)
• Daily processing reduced from 14 hours to 1.5hours!
• Shark 0.8.1 does not support: map join auto-conversion, automatic calculation of number of
reducers, reducer or map out phase disk spills, skew joins etc … we have to either manually
fine tune the cluster and the query based on the specific dataset, or we are better off with
Hive under these circumstances … so we use Mesos to manage Hadoop and Spark under the
same cluster, mixing Hive and Shark workloads (demo)
• 0.9.0 fixes many of the problems, but still requires patches!
• Tested against multiple cluster configurations of the same cost, using 3 types of instances:
m1.xlarge (4c x 15GB), m2.4xlarge (8c x 68.4GB) and cc2.8xlarge (32c x 60.8GB).
• Jaws config settings explained: set mapreduce.job.reduces=…, set
shark.column.compress=true, spark.default.parallelism=384,
spark.storage.memoryFraction=0.3, spark.shuffle.memoryFraction=0.6,
spark.shuffle.consolidateFiles=true, spark.shuffle.spill=false|true, spark.mesos.coarse=false,
spark.scheduler.mode=FAIR
ELT processing and data quality pipeline
7. 7
• Jaws: a highly scalable and resilient restful (http) interface on top of a managed Shark session
that can concurrently and asynchronously submit Shark queries, return persisted results
(automatically limited in size or paged), execution logs and job information (Cassandra or hdfs
persisted).
• Jaws can be load balanced for higher availability and scalability and it fuels a web-based GUI
that is integrated in the xPatterns Management Console (Warehouse Explorer)
• Jaws exposes configuration options for fine-tuning Spark & Shark performance and running
against a stand-alone Spark deployment, with or without Tachyon as in-memory distributed
file system on top of HDFS, and with or without Mesos as resource manager
• Provides different deployment recipes for all combinations of Spark, Mesos and Tachyon
• Shark editor provides analysts, data scientists with a view into the warehouse through a
metadata explorer, provides a query editor with intelligent features like auto-complete, a
results viewer, logs viewer and historical queries for asynchronously retrieving persisted
results, logs and query information for both running and historical queries
Jaws REST SharkServer & GUI
9. 9
Export to NoSql API
• Datasets in the warehouse need to be exposed to high-throughput low-latency real-time
APIs. Each application requires extra processing performed on top of the core datasets,
hence additional transformations are executed for building data marts inside the
warehouse
• Exporter tool builds the efficient data model and runs an export of data from a Shark/Hive
table to a Cassandra Column Family, through a custom Spark job with configurable
throughput (configurable Spark processors against a Cassandra ring) (instrumentation
dashboard embedded, logs, progress and instrumentation events pushed though SSE)
• Data Modeling is driven by the read access patterns provided by an application engineer
building dashboards and visualizations: lookup key, columns (record fields to read), paging,
sorting, filtering
• The end result of a job run is a REST API endpoint (instrumented, monitored, resilient, geo-
replicated) that uses the underlying generated Cassandra data model and fuels the data in
the dashboards
• Configuration API provided for creating export jobs and executing them (ad-hoc or
scheduled).
11. 11
Referral Provider Network
• One of the many applications that we built for our largest healthcare customers using
the xPatterns APIs and tools on the new upgraded infrastructure: ELT Pipeline, Jaws,
Export to NoSql API. The dashboard for the RPN application was built using D3.js and
angular against the generic api published by the export tool.
• The application allows for building a graph of downstream and upstream referred and
referring providers, grouped by specialty, with computed aggregates like patient counts,
claim counts and total charged amounts. RPN is used for both fraud detection and for
aiding a clinic buying decision, by following the busiest graph paths.
• The dataset behind the app consists of 8 billion medical records, from which we
extracted 1.7 million providers (Shark warehouse) and built 53 million relationships in
the graph (persisted in Cassandra)
• While we demo the graph building we will also look at the Graphite instrumentation
dashboard for analyzing the runtime performance of the geo-replicated Cassandra read
operations (latency in the 20-50ms range)
the logical architecture diagram with the 3 logical layers of xPatterns: Infrastructure, Analytics and Visualization and the roles: ELT Engineer, Data Scientist, Application Engineer.xPatterns is a big data analytics platform as a service that enables a rapid development of enterprise-grade analytical applications. It provides tools, api sets and a management console for building an ELT pipeline with data monitoring and quality gates, a data warehouse for ad-hoc and scheduled querying, analysis, model building and experimentation, tools for exporting data to NoSql and solrCloud cluster for real-time access through low-latency/high-throughput apis as well as dashboard and visualization api/tools leveraging the available data and models. In this presentation we will showcase one of the analytical applications build on top of xPatterns for our largest customer for that runs xPatterns in production on top a data warehouse consisting of several hundreds TB of medical, pharmacy and lab data records consisting of tens of billions of records. We will showcase the xPatterns components in the form of APIs and tools employed throughout the entire lifecycle of this application.”
physical architecture diagram for our largest customer deployment, demonstrating the enterprise-grade attributes of the platform: scalability, high availability, performance, resilience, manageability while providing means for geo-failover (warehouse), geo-replication (real-time DB), data and system monitoring, instrumentation, backup & restoreThis is not our complete reference architecture, as it is missing solrCloud clusters (semantic search and dynamic ontologies), ZooKeeper clusters (distributed locks, synchronization, metadata and configuration management, cluster management), real time model scoring services, real time analytics stack (Kafka, Storm, node.js/spray/akka),
Ganglia allows us to not necessarily include Cloudera Manager in our management console and use any Hadoopdistro for HDFS and leftover MR and Hive … Hadoop -> Spark: faster distributed computing engine leveraging in-memory computation at a much lower operational cost, machine learning primitives, simpler programming model (Scala, Python, Java), faster job submission, shell for quick prototyping and testing, ideal for our iterative algorithmsHive -> Shark: interactive queries on large datasets have become reasonable requests (in-memory caching yields 4-20x performance improvement, ELT script base migration required minimal effort (same familiar HiveQL, with a few exceptions)NO resource manager - > Mesos: multiple workloads from multiple frameworks can co-exist and fairly consume the cluster resources (policy based). More mature than YARN, allows us to separate production from experimentation workloads, co-locates Spark (ingestion pipeline & export to NoSql jobs), legacy Hadoop MR jobs, multiple Shark servers (Jaws), multiple Spark Job servers, mixed Hive and Shark queries (ELT), and establish priority queues: no more unmanageable contention and delayed execution while maximizing cluster utilizationNo Cache -> Tachyon: in-memory distributed file system, with HDFS backup, resilience through lineage rather than replication, our out-of-process cache that survives Spark JVM restarts, allows for fine tuning performance and experimenting against cached warehouse tables without reload. Faster than in process cache due to delayed GC. Provides data sharing between multiple Spark/Shark jobs, efficient in-memory columnar storage with compression support for minimal footprintCloudera Manager -> Ganglia: distributed monitoring system with a web interface for dashboards with historical metrics data (CPU, RAM, disk I/O, network I/O). This is a nice addition to our Nagios (monitoring and alerts) and Graphite (instrumentation dashboards)
We converted the data ingestion tool to Spark so we can completely replace Hadoop and Hive in the future and for the faster job submission. We are converting all of our MR jobs to Spark jobs, for both ingestion and exports to CassandraDifferent dataset require different cluster configurations, biggest problem of Spark 0.8.1 is that intermediate output and reducer input is not spilled to disk, causing OOM frequently (0.9.0 solves the reducer part).
Jaws: a highly scalable and resilient restful (http) interface on top of a managed Shark session that can concurrently and asynchronously submit Shark queries, return persisted results (automatically limited in size), execution logs and job information (Cassandra or hdfs persisted).Jaws can be load balanced for higher availability and scalability and it fuels a web-based GUI called Shark Editor that is integrated in the xPatterns Management ConsoleJaws exposes configuration options for fine-tuning Spark & Shark performance and running against a stand-alone Spark deployment, with or without Tachyon as in-memory distributed file system on top of HDFS, and with or without Mesos as resource manager Provides different deployment recipes for all combinations of Spark, Mesos and TachyonShark editor provides analysts, data scientists with a view into the warehouse through a metadata explorer, provides a query editor with intelligent features like auto-complete, a results viewer, logs viewer and historical queries for asynchronously retrieving persisted results, logs and query information for both running and historical queries (DEMO)
Datasets in the warehouse need to be exposed to high-throughput low-latency real-time APIs. Each application requires extra processing performed on top of the core datasets, hence additional transformations are executed for building data marts inside the warehousePre-optimization Shark/Hive queries required for building an efficient data model for Cassandra persistence: minimal number of column families, wide rows (50-100 MB compressed). Resulting data model is efficient for both read (dashboard/API) and write (export/updates) requestsExporter tool builds the efficient data model and runs an export of data from a Shark/Hive table to a Cassandra Column Family, through a custom Spark job with configurable throughput (configurable Spark processors against a Cassandra ring)Data Modeling is driven by the read access patterns: lookup key, columns (record fields to read), paging, sorting, filtering.The data access patterns is used for automatically publishing a REST api that uses the underlying generated Cassandra data model and it fuels the data in the dashboardsExecution logs behind workflows, progress report and instrumentation events for the dashboard are pushed to the browser through SSE (Zookeeper watchers used for synchronization)
Referral Provider Network: one of the 6 applications that we built for our healthcare customer using the xPatterns APIs and tools on the new beyond Hadoop infrastructure: ELT Pipeline, Export to NoSQL API. The dashboard for the RPN application was built using D3.js and angular against the generic api published by the export tool. The application allows for building a graph of downstream and upstream referred and referring providers, grouped by specialty and with computed aggregates like patient counts, claim counts and total charged amounts. RPN is used for both fraud detection and for aiding a clinic buying decision, by following the busiest graph paths.The dataset behind the app consists of 8 billion medical records, from which we extracted 1.7 million providers (Shark warehouse) and built 53 million relationships in the graph (persisted in Cassandra)While we demo the graph building we will also look at the Graphite instrumentation dashboard for analyzing the runtime performance of the geo-replicated Cassandra read operations during the demo
Instrumentation dashboard showcasing the read latency measured during peak (40ms average, 60peak)