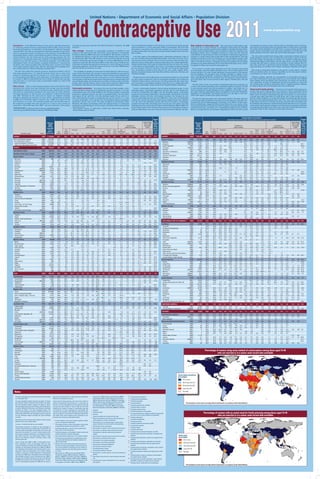
World Contraceptive Use 2011
                                                                                                                                                           United Nations • Department of Economic and Social Affairs • Population Division


                                                                                                                                                                                                                                                                                                                                                                                                                                                                                                            www.unpopulation.org


Introduction  At the 2005 World Summit, Governments committed themselves                                                of  women  by  age  group  obtained  from  World Population Prospects: The 2008                                                       level of contraceptive prevalence, with only 22 per cent of women of reproductive age                     Main methods of contraception used Nine out of every 10 contraceptive users                                  contraceptive use, there are more countries where at least 30 per cent of contracep-
to “achieving universal access to reproductive health by 2015, as set out at the                                        Revision. 3                                                                                                                           who are married or in a union using some method of contraception. Over half of the                        in  the  world  rely  on  modern  methods  of  contraception.  Short-acting  and  reversible                 tive users rely on the pill than there are countries where a similar share is accounted 
International  Conference  on  Population  and  Development”  (General  Assembly                                                                                                                                                                              48 countries in sub-Saharan Africa with data available have a level of contraceptive                      methods are more commonly used than other methods in developed countries where-                              for by either female sterilization or the IUD. That is, in many countries, the pill is more 
resolution 60/1). This wall chart presents the latest data available on key dimen-                                      Data coverage Information  on  contraceptive  prevalence  is  available  for  most                                                    prevalence below 20 per cent and they are located mainly in Western Africa and in the                     as longer-acting and highly effective clinical methods are used more frequently in the                       popular  among  contraceptive  users  than  female  sterilization  or  the  IUD  even  if  the 
sions  of  reproductive  health,  including  two  of  the  indicators  for  the  Millennium                             countries  of  the  world.  As  this  wall  chart  shows,  recent  estimates  of  contraceptive                                       Horn of Africa.                                                                                           developing  countries.  Thus,  in  developed  countries  as  a  whole,  the  most  commonly                  global prevalence of the pill is lower than that of female sterilization or the IUD.
Development Goals, namely, contraceptive prevalence relative to the use of any                                          prevalence referring to 2000 or later years are available for 148 countries or areas. For                                                                                                                                                       used methods are the pill (used by 18 per cent of women of reproductive age who are 
                                                                                                                        an additional 40 countries or areas, the most recent estimates refer to earlier dates,                                                   In  all  other  regions  of  the  developing  world,  contraceptive  prevalence  is  high:  61         married or in a union) and the male condom (with 18 per cent prevalence). Those two                             The male condom ranked fourth among modern contraceptive methods in terms of 
method  (indicator  5.3)  and  unmet  need  for  family  planning  (indicator  5.6).  The                                                                                                                                                                                                                                                                                                                                                                                            global prevalence, with 8 per cent of couples where the woman is aged 15 to 49 rely-
                                                                                                                        the earliest being 1984. Those 188 countries or areas account for 99.9 per cent of all                                                per cent in Northern Africa (excluding Sudan), 66 per cent in Asia, and 73 per cent in                    methods accounted for half of all contraceptive use in the developed countries, while 
importance  of  reproductive  health  was  validated  at  the  2010  high-level  plenary                                                                                                                                                                                                                                                                                                                                                                                             ing on this method. The prevalence of condom use is highest in Hong Kong, Special 
                                                                                                                        women of reproductive age who were married or in a union in 2009. Moreover, the 148                                                   Latin America and the Caribbean. Only six of the 47 countries of Asia with data avail-                    less than one out of every four users in developed countries relied on female sterili-
meeting  of  the  sixty-fifth  session  of  the  General  Assembly  on  the  Millennium                                                                                                                                                                                                                                                                                 zation or the IUD. By contrast, in developing countries the methods with the highest                         Administrative Region of China (50 per cent) and Japan (41 per cent). Most of the other 
Development  Goals,  and  Governments  committed  themselves  to  “ensuring  that                                       countries or areas with data referring to 2000 or a later date account for 96 per cent                                                able have levels of contraceptive prevalence below 30 per cent, namely, Afghanistan,                                                                                                                                   countries  with  high  levels  of  condom  use  are  located  in  Europe,  although  there  are 
                                                                                                                        of all women of reproductive age who are married or in a union. Among the countries                                                   Pakistan, Saudi Arabia, Timor-Leste, the United Arab Emirates and Yemen. No country                       prevalence were female sterilization (21 per cent) and the IUD (15 per cent), account-
all women, men and young people have information about, access to and choice                                                                                                                                                                                                                                                                                            ing together for 58 per cent of overall contraceptive use.                                                   also a few in Asia and in Latin America and the Caribbean. Condom prevalence levels 
of the widest possible range of safe, effective, affordable and acceptable meth-                                        lacking data altogether, only Croatia, Cyprus and Fiji have more than 100,000 women                                                   in Latin America and the Caribbean has a level of contraceptive prevalence below 30                                                                                                                                    range from 30 per cent to 40 per cent in Greece, the Russian Federation and Uruguay.
ods of family planning” (General Assembly resolution 65/1).                                                             aged 15 to 49 who are married or in a union.                                                                                          per cent. However, 10 of the 37 countries in that major area having the required data                        For  the  world  as  a  whole,  female  sterilization  is  the  most  commonly  used  method 
                                                                                                                                                                                                                                                              have  contraceptive  prevalence  levels  below  50  per  cent,  namely,  Anguilla,  Belize,               of contraception, being the method selected by 19 per cent of women aged 15 to 49                              Other modern contraceptive methods are also popular in certain regions. In Eastern 
   The  wall  chart  shows  that  universal  access  to  reproductive  health  is  still  far                              The availability of estimates of unmet need for family planning is still far from uni-                                             Dominica, Guatemala, Guyana, Haiti, Saint Kitts and Nevis, Saint Lucia, Suriname, and                                                                                                                                  Africa  and  Southern  Africa,  for  instance,  injectables  are  the  most  popular  methods, 
                                                                                                                                                                                                                                                                                                                                                                        who are married or in a union. Female sterilization is most prevalent in Latin America 
from  being  attained  since,  in  at  least  46  countries,  20  per  cent  or  more  of  the                          versal. As this chart shows, 107 countries or areas have estimates of unmet need for                                                  Trinidad and Tobago.                                                                                                                                                                                                   accounting for over 40 per cent of contraceptive use.
                                                                                                                                                                                                                                                                                                                                                                        and  the  Caribbean.  The  prevalence  level  of  female  sterilization  is  highest—47  per 
women of reproductive age who are married or in a union have an unmet need                                              family planning referring to 1987 or later years. Those countries account for 86 per cent                                                                                                                                                       cent—in the Dominican Republic. In Colombia, El Salvador, Panama and Puerto Rico, 
for contraception. Nevertheless, at the global level, contraceptive use continues                                       of all women of reproductive age who are married or in a union. Countries lacking the                                                    Northern America has the highest level of contraceptive prevalence in the world (78                    levels range between 30 per cent and 40 per cent. The prevalence of female steriliza-                           Traditional  methods,  generally  not  recommended  as  contraceptives  because  of 
to increase. In 2009, an estimated 63 per cent of women of reproductive age who                                         data necessary to estimate the unmet need for family planning are located mainly in the                                               per cent). Europe as whole has a level of contraceptive prevalence not far below that                     tion is over 25 per cent in a few countries in other regions, including China, India and                     their lower effectiveness in preventing pregnancy, are still commonly used in Middle 
were married or in a union were using a contraceptive method, for a total of 739                                        more developed regions and include several countries in Europe as well as Australia,                                                  of Northern America (73 per cent), but four of the 36 countries with data in that major                   Thailand.                                                                                                    Africa, Western Africa and Western Asia, where 65 per cent, 40 per cent and 35 per 
million worldwide.                                                                                                      Canada, Japan and New Zealand. There are also several countries in Western Asia,                                                      area have levels of contraceptive prevalence below 50 per cent, namely, Bosnia and                                                                                                                                     cent, respectively, of women of reproductive age who are married or in a union and 
                                                                                                                        the Caribbean, South America and Oceania lacking the required information.                                                            Herzegovina, Montenegro, Serbia and the former Yugoslav Republic of Macedonia.                               The IUD, used by 14 per cent of women of reproductive age who are married or in                           are currently using a method of contraception rely on a traditional method. In Albania, 
Data sources          Data on contraceptive prevalence and unmet need for family                                                                                                                                                                                                                                                                                        a union, is the second most widely used contraceptive method in the world. The IUD                           for instance, 84 per cent of contraceptive users rely on withdrawal.
planning  at  the  country  level  were  obtained  from  surveys  covering  nationally                                  Contraceptive prevalence According to the most recent data available, contra-                                                            Trends in contraceptive prevalence contrast among development groups. In more                          is most commonly used in Asia and its prevalence is highest—over 40 per cent—in 
representative samples of women of reproductive age. Detailed data on levels                                                                                                                                                                                                                                                                                            China, the Democratic People’s Republic of Korea, Uzbekistan and Viet Nam. In addi-                          Unmet need for family planning The level of unmet need for family planning var-
                                                                                                                        ceptive prevalence among women of reproductive age who are married or in a union                                                      developed  regions,  contraceptive  prevalence  has  been  high  for  many  decades  and                                                                                                                               ies from 2 per cent in France to 46 per cent in Samoa. In Africa, nearly half of the 44 
and  trends  of  contraceptive  prevalence  and  unmet  need  for  family  planning,                                    varies between 3 per cent in Chad and 88 per cent in Norway. Globally, contraceptive                                                  its  level  has  changed  little  since  2000.  In  the  less  developed  regions,  contraceptive         tion, levels of IUD use range between 30 per cent and 40 per cent in Israel, Kazakhstan, 
                                                                                                                                                                                                                                                                                                                                                                        Kyrgyzstan and Turkmenistan. The prevalence of IUD use is also high in a few coun-                           countries with the required data have unmet need levels ranging from 20 per cent to 
including  information  on  data  sources,  are  presented  in  World Contraceptive                                     prevalence is estimated at 63 per cent and it is somewhat higher in the more devel-                                                   prevalence has increased substantially in the past decade. Among 39 per cent of the                                                                                                                                    30 per cent of all women of reproductive age who are married or in a union and over 
Use 2010. 1  Estimates  for  the  world  and  its  regions  are  weighted  averages                                     oped  regions  (72  per  cent)  than  in  the  less  developed  regions  (61  per  cent),  but  in                                    developing  countries  with  data,  contraceptive  prevalence  has  increased  by  more                   tries in other regions, including Cuba, Egypt and Estonia.
                                                                                                                                                                                                                                                                                                                                                                                                                                                                                     a  quarter  have  unmet  need  levels  of  at  least  30  per  cent.  In  Asia,  Europe  and  Latin 
derived  by  weighting  the  indicators  for  each  country,  extrapolated  as  needed                                  both a high proportion of women of reproductive age who are married or in a union                                                     than half a percentage point per year since 2000 and in 16 per cent of the developing                                                                                                                                  America and the Caribbean, by contrast, the majority of countries with the necessary 
                                                                                                                                                                                                                                                                                                                                                                           The pill is the third most widely used contraceptive method in the world, with 9 per 
to  2009,  by  the  estimated  number  of  women  who,  in  2009,  were  aged  15  to  49                               are using contraception. In the majority of the less developed regions contraceptive                                                  countries the increase has averaged at least one percentage point per year. However,                                                                                                                                   data have unmet need levels below 20 per cent. Thus, 72 per cent of the 25 countries 
                                                                                                                                                                                                                                                                                                                                                                        cent of women aged 15 to 49 who are married or in a union relying on it. Use of the con-
and  married  or  in  a  union.  The  estimated  weights  were  derived  from  data  on                                 prevalence  is  50  per  cent  or  more.  The  major  exceptions  are  sub-Saharan  Africa,                                           in  61  per  cent  of  the  developing  countries  with  data  the  increase  in  contraceptive           traceptive pill has the widest geographic distribution of any method. The pill’s preva-                      in Asia, 93 per cent of the 14 in Europe, and 79 per cent of the 19 in Latin America and 
the  proportion  of  women  who  were  married  or  in  a  union  in  each  country  as                                 Melanesia,  Micronesia  and  Polynesia,  where  the  estimated  levels  of  contraceptive                                             prevalence has been half a percentage point or less per year, and in 26 per cent of the                   lence is relatively high, ranging from 30 per cent to 40 per cent, in one country in Asia,                   the Caribbean with estimates of unmet need have levels below 20 per cent. In general, 
presented  in  World Marriage Data 2008 2   and  from  estimates  of  the  number                                       prevalence are still below 40 per cent. As a region, sub-Saharan Africa has the lowest                                                developing countries contraceptive prevalence declined between 2000 and 2009. This                        five in Europe and three in Latin America and the Caribbean. Countries with the highest                      unmet need for family planning is lowest in countries where contraceptive prevalence 
                                                                                                                                                                                                                                                              group includes several of the countries whose most recent contraceptive prevalence                        prevalence of pill use—over 40 per cent—include Algeria, Belgium, France, Germany,                           is already high (above 60 per cent). That is, the unmet need for family planning must be 
1
  World Contraceptive Use 2010 (United Nations publication, POP/DB/CP/Rev2010).                                            orld Population Prospects: The 2008 Revision. CD-ROM Edition (United  Nations  publication, 
                                                                                                                        3
                                                                                                                         W                                                                                                                                                                                                                                                                                                                                                           interpreted in light of other indicators of contraceptive prevalence.  
2 
  World Marriage Data 2008 (United Nations publication, POP/DB/Mar/Rev2008).                                                Extended Dataset, Sales No. 09.XII.6).                                                                                            levels are below 20 per cent, such as Burundi, the Central African Republic and Togo.                     Morocco, Portugal, Réunion and Zimbabwe. Regarding the share of the pill in overall 


                                                                                                                                                                   Contraceptive prevalence b                                                                                                                                                                                                                                                                              Contraceptive prevalence b
                                                                                                                                         (percentage using contraception among women who are married or in uniona)                                                                                      Need                                                                                                                                   (percentage using contraception among women who are married or in uniona)                                                                   Need
                                                                                                                                                                                                                                                                                                         for                                                                                                                                                                                                                                                                                for
                                                                                                                                                                                                                                                                                        Annual change,                                                                                                                                                                                                                                                                   Annual change,
                                                                    Women                                                                                                                                                                                                                              family                                                                  Women                                                                                                                                                                                                      family
                                                                                                                                                                                                                                                                                         1997 to 2009                                                                                                                                                                                                                                                                     1997 to 2009
                                                                     aged                                                                                                                                                                                                                               plan-                                                                   aged                                                                                                                                                                                                       plan-
                                                                                                                                                    Prevalence of                                                                              Prevalence of                              (percentage                                                                                                                                                     Prevalence of                                                                 Prevalence of                      (percentage
                                                                     15-49,                                                                                                                                                                                                                             ning                                                                    15-49,                                                                                                                                                                                                     ning
                                                                                                                                                   modern methods                                                                           traditional methods                            points)                                                                                                                                                       modern methods                                                              traditional methods                     points)
                                                                    married                                                                                                                                                                                                                     (percent-                                                                      married                                                                                                                                                                                              (percent-
                                                                      or in                                Any         Sterilization                                                     Vaginal          Other              Any                                          Other          Any    age with                                                                         or in                           Any       Sterilization                                                    Vaginal     Other           Any                                   Other          Any    age with
                                                                    union a,             Any              modern                                                                   Male   barrier        modern           traditional                          With-   traditional Any  modern   unmet                                                                         union a,         Any             modern                                                                Male   barrier   modern        traditional                  With-    traditional Any  modern   unmet
                 Country or area                       Year(s)     (thousands)          method            method     Female      Male       Pill   Injectable Implant    IUD      condom methodsc        methodsd           method           Rhythme          drawal    methodsf method methods need) g                           Country or area                   Year(s)   (thousands)      method           method   Female         Male      Pill   Injectable Implant    IUD   condom methodsc   methodsd        method         Rhythme    drawal     methodsf method methods need) g

     WORLD                                                2009      1,178,863            62.7             56.1       18.9         2.4       8.8      3.5      0.3       14.3        7.6        0.2        0.0                6.6              2.9              3.1       0.6            0.2      0.1    11.2          EUROPE                                          2009       102,392        72.6             58.7     3.1           2.5     21.4       0.3       0.1      12.4   17.1      1.5      0.1           13.9             5.2        8.0       0.7          0.1      0.5       ..
     More developed regions                              2009         162,540            72.4             61.3        8.2         5.5      18.4      0.6       0.2       9.2      17.8         1.1        0.3               11.0              3.8              6.7       0.5            0.2      0.4      ..          Eastern Europe                                  2009        45,333        74.9             54.3     0.9           0.2     11.6       0.3       0.0      16.3   22.2      2.8      0.0           20.7             9.1       10.4       1.2          0.4      0.9       ..
     Less developed regions                              2009       1,016,322            61.2             55.2       20.6         1.9       7.3      4.0       0.4      15.1       5.9         0.1        0.0                5.9              2.8              2.5       0.6            0.2      0.1    11.4
                                                                                                                                                                                                                                                                                                                       Belarus                                     2005/06         1,647        72.6             56.0     2.4           0.0     10.4       0.0       0.0      25.7   17.5      0.0      0.0           16.6             5.5        9.6       1.5 ap
                                                                                                                                                                                                                                                                                                                                                                                                                                                                                                                                                                          1.3     0.8       ..
      Least developed countries                          2009         142,282            31.4             25.0        3.0         0.5      10.7      7.3       0.5       0.7       2.3         0.0        0.0                6.4              3.4              1.7       1.3            0.4      0.5    24.2
                                                                                                                                                                                                                                                                                                                       Bulgaria                                    1997/98         1,276        63.4 i, n
                                                                                                                                                                                                                                                                                                                                                                                                                 39.6      ..            ..     10.7        ..        ..      10.6   16.7      1.2      0.4 ad, ae
                                                                                                                                                                                                                                                                                                                                                                                                                                                                                                                      23.8              ..       19.6       4.2 ar
                                                                                                                                                                                                                                                                                                                                                                                                                                                                                                                                                                           ..      ..     29.7    n, aa

      Other less developed countries                     2009         874,041            66.0             60.2       23.5         2.1       6.7      3.4       0.3      17.4       6.5         0.1        0.0                5.9              2.7              2.6       0.5            0.2      0.1     9.3
                                                                                                                                                                                                                                                                                                                       Czech Republic                                1997          1,382        72.0 n
                                                                                                                                                                                                                                                                                                                                                                                                                 62.6l
                                                                                                                                                                                                                                                                                                                                                                                                                          7.2           5.1     23.1        ..        ..      13.9   12.7      0.7      0.0            9.5             1.7        7.3       0.5            ..      ..     10.8    n, o, aa


     AFRICA                                               2009         155,541           28.6             22.4        1.6         0.0       7.8      6.4       0.4       4.4        1.8        0.0        0.0                6.2              3.1              1.4       1.8            0.2      0.3    22.7           Hungary                                     1992/93         1,467        80.6 i, n
                                                                                                                                                                                                                                                                                                                                                                                                                 71.3     5.0            ..     39.4        ..        ..      18.2    8.1      0.6      0.0            9.3             2.6        6.5       0.2            ..      ..      7.0   n, o, aa


                                                                                                                                                                                                                                                                                                                       Poland                                        1991          5,921        72.7 i, n
                                                                                                                                                                                                                                                                                                                                                                                                                 28.0     0.0           0.0      3.4        ..        ..       8.4   13.4      2.8      0.0           44.7            28.4       16.3       0.0            ..      ..       ..
 Sub-Saharan Africa                                      2009          128,163           21.8             15.7        1.6         0.0       4.3      6.8       0.4       0.5        2.0        0.0        0.0                6.2              3.2              1.3       1.7            0.2      0.3    24.9
                                                                                                                                                                                                                                                                                                                       Republic of Moldova                           2005            686        67.8             42.6     4.7           0.0      3.6        ..        ..      25.2    7.4       ..      1.7 az
                                                                                                                                                                                                                                                                                                                                                                                                                                                                                                                      25.2             3.5       19.6       2.2 ap, aq
                                                                                                                                                                                                                                                                                                                                                                                                                                                                                                                                                                          0.6     0.0      6.7
 Northern Africa (excl. Sudan)                           2009           27,378           60.5             54.0        1.6         0.0      24.1      4.4       0.3      22.3        1.2        0.1        0.0                6.5              2.5              1.8       2.2            0.2      0.3     9.6           Romania                                       2004          3,315        70.3 n
                                                                                                                                                                                                                                                                                                                                                                                                                 38.2     2.8            ..     14.1        ..        ..       6.7   12.1      1.8      0.7           32.1             6.6       25.5       0.0           0.6     0.8     11.9    n


                                                                                                                                                                                                                                                                                                                       Russian Federation                            2007         22,315        79.5 m, n
                                                                                                                                                                                                                                                                                                                                                                                                                 65.0      ..            ..     14.1        ..        ..      20.4   30.3       ..      5.2 af, ah
                                                                                                                                                                                                                                                                                                                                                                                                                                                                                                                      14.6            14.5       13.6       2.9 ao
                                                                                                                                                                                                                                                                                                                                                                                                                                                                                                                                                                          0.5     1.0       ..
 Eastern Africa                                          2009           46,707           28.4             22.9        1.9         0.0       6.3    11.9        0.9       0.5        1.3        0.0        0.0                5.6              2.6              1.3       1.6            0.8      0.8    27.6           Slovakia                                      1997            709        79.8 n
                                                                                                                                                                                                                                                                                                                                                                                                                 65.6     4.7            ..     22.3        ..        ..      12.8   25.8       ..      0.0           14.2              ..         ..        ..            ..      ..       ..
      Burundi                                        2005/06               999            9.1              7.5        0.2         0.0       1.8     5.0        0.0       0.1        0.3        0.0        0.0                1.6              1.0             0.2        0.4            -0.7    -0.3    29.0   h, n
                                                                                                                                                                                                                                                                                                                       Ukraine                                       2007          7,130        66.7 l
                                                                                                                                                                                                                                                                                                                                                                                                                 47.5     0.6           0.0      4.8       0.0       0.0      17.7   23.8      0.5      0.0           19.1             7.2       10.3       1.6 aq
                                                                                                                                                                                                                                                                                                                                                                                                                                                                                                                                                                         -0.1     0.7     10.3
      Comoros                                          2000                 78           25.7             19.3        0.7         0.0       8.3     8.5        0.7       0.4        0.7        0.0        0.0                6.4              2.9             1.2        2.3   ap
                                                                                                                                                                                                                                                                                          ..      ..    34.6   h

                                                                                                                                                                                                                                                                                                                      Northern Europe                                 2009        12,693        80.1             77.2     6.1          12.3     22.0       1.2       0.7      11.9   20.9      1.0      1.1             2.9            1.2        1.5       0.1          0.3      0.4       ..
      Djibouti                                         2006                 94           17.8             17.1        0.4         0.0      13.6     2.5        0.0       0.4        0.2        0.0        0.0                0.7               ..              ..         ..             1.0     1.3      ..
      Eritrea                                          2002                615            8.0              5.1        0.2         0.0       1.4     2.6        0.0       0.4        0.6        0.0        0.0                2.9              0.7             0.1        2.1   ap
                                                                                                                                                                                                                                                                                          ..      ..    27.0           Denmark                                       1988            658        78.0 i, n
                                                                                                                                                                                                                                                                                                                                                                                                                 72.0     5.0           5.0     26.0        ..        ..      11.0   22.0      3.0      0.0            6.0             2.0        4.0       0.0            ..      ..   ..
      Ethiopia                                         2005             10,851           14.7             13.7   l
                                                                                                                      0.2         0.0       3.1     9.9        0.2       0.2        0.2        0.0        0.0                1.0   l
                                                                                                                                                                                                                                              0.6             0.3        0.2   ap
                                                                                                                                                                                                                                                                                         0.7     0.8    33.8           Estonia                                       1994            186        70.3 i, n, q
                                                                                                                                                                                                                                                                                                                                                                                                                 56.4      ..            ..      3.9        ..        ..      35.9   16.1      0.6      0.0           13.8             8.1        4.5       1.2            ..      ..   ..
      Kenya                                          2008/09             5,745           45.5             38.9        4.8         0.0       7.2    21.6        1.9       1.6        1.8        0.0        0.0                6.6              4.7             0.7        1.2   ap, aq
                                                                                                                                                                                                                                                                                         0.7     0.8    25.6           Finland                                       1989            761        77.4 n
                                                                                                                                                                                                                                                                                                                                                                                                                 75.4    14.9 ac
                                                                                                                                                                                                                                                                                                                                                                                                                                        1.1     11.3       1.9        ..      25.8   20.1      0.3      0.0            2.1             0.7        0.6       0.8            ..      ..   ..
      Madagascar                                     2008/09             2,914           39.9             28.2        1.1         0.1       6.0    17.9        1.5       0.4        1.1        0.0        0.0               11.7              9.7             0.8        1.2   ap, aq
                                                                                                                                                                                                                                                                                         2.3     1.8    18.9           Ireland                                     2004/05           504        64.8 m, n
                                                                                                                                                                                                                                                                                                                                                                                                                 61.4      ..            ..     17.2        ..        ..       8.4   23.3      0.1     12.4 au
                                                                                                                                                                                                                                                                                                                                                                                                                                                                                                                       5.4             3.3        2.1       0.0          -1.2    -0.6   ..
      Malawi                                           2006              2,182           41.0             38.4        4.4         0.1       2.4    29.0        0.7       0.3        1.5        0.1        0.0                2.6              0.7             0.8        1.0   ap
                                                                                                                                                                                                                                                                                         1.2     1.4    27.6   h       Latvia                                        1995            266        67.8 i, n
                                                                                                                                                                                                                                                                                                                                                                                                                 55.5      ..           2.1     11.3       0.1        ..      28.0   13.6      0.4      0.0           12.3             7.1        4.5       0.7            ..      .. 16.8        n, o, aa


      Mauritius                                        2002                219           75.8   i
                                                                                                          39.3        8.9         0.1      16.0     3.7        0.1       1.4        8.9        0.2        0.0               36.5             10.1            26.4        0.0             0.0    -0.3     3.5   n       Lithuania                                   1994/95           582        50.7 i, n
                                                                                                                                                                                                                                                                                                                                                                                                                 33.2      ..            ..      3.6       0.2        ..      15.2   14.2      0.0      0.0           17.5            10.1        6.5       0.9            ..      .. 18.0        n, o, aa


      Mozambique                                     2003/04             3,431           16.5             11.8        0.9         0.0       4.9     4.8         ..       0.1        1.1        0.0        0.0                4.7              3.1             0.2        1.4   aq
                                                                                                                                                                                                                                                                                         0.7     0.4    18.4           Norway                                        2005            573        88.4 n
                                                                                                                                                                                                                                                                                                                                                                                                                 82.2     7.7            ..     31.0        ..       3.3      23.3   12.8      4.1      0.0            6.3  ar, as
                                                                                                                                                                                                                                                                                                                                                                                                                                                                                                                                        ..         ..        ..           0.2     0.3   ..
      Réunion                                          1997                 85           66.6   l, n
                                                                                                          63.5        3.2         0.0      42.6     0.0        0.0      13.0        3.2        0.2        1.3   i
                                                                                                                                                                                                                             3.1              1.5             1.6        0.0              ..      ..      ..           Sweden                                        1996          1,068        75.2 n, p
                                                                                                                                                                                                                                                                                                                                                                                                                 64.8      ..            ..     27.4       0.0       0.0      16.2   16.4      0.7      4.1 ad, ae
                                                                                                                                                                                                                                                                                                                                                                                                                                                                                                                      10.4             2.6        7.8       0.0            ..      ..   ..
      Rwanda                                         2007/08             1,194           36.4             26.1        0.7         0.1       6.4    15.2        1.6       0.2        1.9        0.0        0.0               10.3              6.3             3.0        1.0   ap, aq
                                                                                                                                                                                                                                                                                         2.6     2.4    37.9   h       United Kingdom                              2008/09         8,188        84.0 m, n, y
                                                                                                                                                                                                                                                                                                                                                                                                                 84.0     8.0          21.0     28.0       2.0       1.0      10.0   27.0      1.0      2.0 ak
                                                                                                                                                                                                                                                                                                                                                                                                                                                                                                                       8.0             2.0        6.0       0.0           0.4     0.4   ..
      Somalia                                        2005/06             1,246           14.6              1.2        0.0         0.0       0.8     0.2        0.0       0.1        0.0        0.0        0.0               13.4              0.4             0.3       12.8   ap
                                                                                                                                                                                                                                                                                         0.6     0.0      ..          Southern Europe                                 2009        21,451        63.8             46.3     4.6           2.4     16.1       0.1       0.0       5.7   17.0      0.2      0.0           17.6             2.5       14.4       0.7          -0.3    -0.1 11.8
      Uganda                                           2006              3,834           23.7             17.9        2.4         0.1       2.9    10.2        0.3       0.2        1.7        0.0        0.0                5.8              2.8             2.1        0.9   aq
                                                                                                                                                                                                                                                                                         0.2     0.5    40.6           Albania                                     2008/09           580        69.3             10.2     3.0            ..      1.6       0.7        ..       0.9    4.0       ..      0.1 av
                                                                                                                                                                                                                                                                                                                                                                                                                                                                                                                      59.1             0.8       57.9       0.4 ap
                                                                                                                                                                                                                                                                                                                                                                                                                                                                                                                                                                          1.3    -0.6 12.8
      United Republic of Tanzania                      2010              6,827           34.4   j
                                                                                                          26.1   l
                                                                                                                      3.5         0.0       6.7    10.6        2.3       0.6        2.3        0.0        0.0                8.3   l
                                                                                                                                                                                                                                              3.1             2.9        2.2   ap
                                                                                                                                                                                                                                                                                         0.8     0.7    21.8   h
                                                                                                                                                                                                                                                                                                                       Bosnia and Herzegovina                      2005/06           604        35.7             11.2     0.1           0.0      3.4       0.0       0.0       3.6    4.1      0.0      0.1 ai
                                                                                                                                                                                                                                                                                                                                                                                                                                                                                                                      24.5             2.7       21.4       0.4 ap
                                                                                                                                                                                                                                                                                                                                                                                                                                                                                                                                                                         -1.3    -0.5   ..
      Zambia                                           2007              1,662           40.8             26.5   l
                                                                                                                      1.9         0.0      11.0     8.5        0.4       0.1        4.7        0.0        0.1   ai
                                                                                                                                                                                                                            14.3              1.2             5.6        7.5   ap, aq
                                                                                                                                                                                                                                                                                         1.6     0.8    26.5           Greece                                        2001          1,548        76.2 n
                                                                                                                                                                                                                                                                                                                                                                                                                 45.9      ..            ..      4.8        ..        ..       3.6   33.9       ..      3.6 i
                                                                                                                                                                                                                                                                                                                                                                                                                                                                                                                      30.3              ..       28.8       1.5 i
                                                                                                                                                                                                                                                                                                                                                                                                                                                                                                                                                                          0.8     0.9   ..
      Zimbabwe                                       2005/06             1,775           60.2             57.9        2.0         0.1      43.0     9.9        1.2       0.3        1.4        0.0        0.0                2.3              0.2             1.2        0.9   ap, aq
                                                                                                                                                                                                                                                                                         0.6     0.7    12.8           Italy                                       1995/96         7,357        62.7 i, n
                                                                                                                                                                                                                                                                                                                                                                                                                 40.6     6.0 ac
                                                                                                                                                                                                                                                                                                                                                                                                                                        0.1     14.2       0.1        ..       5.8   14.2      0.2      0.0           22.1             3.7       18.2       0.2            ..      .. 11.8        n, o, aa


 Middle Africa                                            2009          19,429           18.6              6.6        0.5         0.0       1.5      0.9       0.2       0.2        3.3        0.0        0.0               12.0              8.9              1.8       1.3            -0.6     0.1    22.6           Malta                                         1993             58        85.8 m, n
                                                                                                                                                                                                                                                                                                                                                                                                                 46.0     2.2           2.2     15.8        ..        ..       2.9   21.9      1.0      0.0             ..            19.4       40.6       8.1 am
                                                                                                                                                                                                                                                                                                                                                                                                                                                                                                                                                                           ..      ..   ..
      Angola                                           2001              2,443            6.2              4.5        0.1         0.0       2.2     1.4        0.0       0.4        0.3        0.1        0.1   ai
                                                                                                                                                                                                                             1.7              1.2              0.1       0.4   ap
                                                                                                                                                                                                                                                                                          ..      ..      ..           Montenegro                                  2005/06            88        39.4             17.2l
                                                                                                                                                                                                                                                                                                                                                                                                                          0.1           0.0      2.4       0.0       0.0       9.7    4.3      0.5      0.1 ai
                                                                                                                                                                                                                                                                                                                                                                                                                                                                                                                      22.2  l
                                                                                                                                                                                                                                                                                                                                                                                                                                                                                                                                       3.9       17.7       0.5 ap
                                                                                                                                                                                                                                                                                                                                                                                                                                                                                                                                                                         -1.5     0.2   ..
      Cameroon                                         2006              2,971           29.2             12.0        0.4         0.0       1.9     2.3        0.6       0.3        6.5        0.0        0.1   ai
                                                                                                                                                                                                                            17.2             13.1              0.6       3.5   ap
                                                                                                                                                                                                                                                                                         0.4     0.3    20.2   h       Portugal                                    2005/06         1,693        86.8 l, n
                                                                                                                                                                                                                                                                                                                                                                                                                 82.5     5.1            ..     58.9        ..        ..       7.3   11.2       ..       ..            5.6             2.1        3.5        ..           0.6     0.8   ..
      Central African Republic                         2006                691           19.0              8.6        0.3         0.1       4.4     0.2        0.0       0.1        3.5        0.0        0.0               10.5              6.8              0.4       3.3   ap
                                                                                                                                                                                                                                                                                        -1.0     0.2    16.2   h       Serbia                                        2005          1,403        41.2             18.6     0.2           0.0      3.4       0.0       0.0       6.0    8.4      0.4      0.2 ai
                                                                                                                                                                                                                                                                                                                                                                                                                                                                                                                      22.6             8.0       14.0       0.5 ap
                                                                                                                                                                                                                                                                                                                                                                                                                                                                                                                                                                         -1.9    -1.5   ..
      Chad                                             2004              1,651            2.8              1.7        0.2          ..       0.5     0.5         ..       0.0        0.4         ..        0.1   av
                                                                                                                                                                                                                             1.1              1.1              0.0       0.0            -0.6     0.0    20.7           Slovenia                                    1994/95           271        78.9 i, n
                                                                                                                                                                                                                                                                                                                                                                                                                 63.2     6.0           0.1     23.2       0.3        ..      22.9    8.1      2.6      0.0           15.7             7.5        8.0       0.2            ..      ..  9.2       n, o, aa


      Congo                                            2005                458           44.3             12.7        0.2          ..       2.3     1.0         ..       0.1        8.9         ..        0.1   av
                                                                                                                                                                                                                            31.6             23.8              5.3       2.5   ap
                                                                                                                                                                                                                                                                                          ..      ..    16.2           Spain                                         2006          6,015        65.7             62.3     5.6           7.9     17.2       0.2        ..       6.4   24.8      0.2      0.0            3.5             0.3        1.9       1.3          -0.6    -0.4 11.8        h


      Dem. Rep. of the Congo                           2007              8,898           20.6              5.8   l
                                                                                                                      0.8          ..       1.0     0.4         ..       0.2        3.4         ..        0.1   av
                                                                                                                                                                                                                            14.9             11.0              3.1       0.8   aq
                                                                                                                                                                                                                                                                                        -1.2     0.2    24.4           TFYR Macedonia                              2005/06           305        13.5              9.8     0.7            ..      2.5        ..        ..       0.4    4.5      1.4      0.3 aw
                                                                                                                                                                                                                                                                                                                                                                                                                                                                                                                       3.7             0.5        0.7       2.6 ap
                                                                                                                                                                                                                                                                                                                                                                                                                                                                                                                                                                         -0.6     0.1   ..
      Equatorial Guinea                                2000                 82           10.1              6.1        0.5         0.1       1.5     2.3        0.1       0.7        0.4        0.3        0.2   ai
                                                                                                                                                                                                                             4.0              2.0              0.6       1.4   ap
                                                                                                                                                                                                                                                                                          ..      ..      ..          Western Europe                                  2009        22,915        71.9             68.6     4.6           1.7     45.5       0.0       0.0      11.4    4.8      0.6      0.0             3.2            2.1        0.8       0.3          -0.4    -0.2       ..
      Gabon                                            2000                166           32.7             11.8        1.0          ..       4.8     0.5         ..        ..        5.1         ..        0.3   ag, ax
                                                                                                                                                                                                                            21.0             15.8              1.8       3.4   ap, aq
                                                                                                                                                                                                                                                                                          ..      ..    28.0           Austria                                     1995/96         1,092        50.9 i, n
                                                                                                                                                                                                                                                                                                                                                                                                                 46.8      ..           0.5     30.8       0.3        ..       7.3    7.2      0.7      0.0             4.1            2.5        0.7       0.9            ..      ..      ..
      Sao Tome and Principe                          2008/09                22           38.4             33.1   l
                                                                                                                      1.2         0.0      15.1    11.5        0.0       0.4        5.0        0.1        0.0                5.3              2.8              1.2       1.3   ap, aq
                                                                                                                                                                                                                                                                                         1.0     0.6    37.2           Belgium                                       2004          1,207        74.6 l, n, s
                                                                                                                                                                                                                                                                                                                                                                                                                 72.9      ..            ..     44.8        ..        ..       9.7     ..       ..     18.4 bb
                                                                                                                                                                                                                                                                                                                                                                                                                                                                                                                        1.5 ar, as
                                                                                                                                                                                                                                                                                                                                                                                                                                                                                                                                        ..         ..        ..          -0.1    -0.1     3.4    h, n, o, v, aa


 Northern Africa                                          2009          33,849           50.4             44.8        1.4         0.0      20.3      3.6       0.2      18.1        1.1        0.1        0.0                5.6              2.0              1.5       2.1            0.2      0.2    13.5           France                                      2004/05         7,320        76.6             74.8      ..            ..     41.5        ..        ..      22.7    6.8      0.6      3.2 ac, au
                                                                                                                                                                                                                                                                                                                                                                                                                                                                                                                        1.7            0.3        1.0       0.4          -0.6    -0.2     1.7    aa


      Algeria                                          2006              5,236           61.4             52.0        1.1          ..      45.9       ..        ..       2.3        2.3         ..        0.3   ah, aw
                                                                                                                                                                                                                             9.4              4.1              3.3       2.0   an
                                                                                                                                                                                                                                                                                        -0.3     0.2      ..           Germany                                       1992          9,835        70.1 n
                                                                                                                                                                                                                                                                                                                                                                                                                 65.6     5.5           0.5     52.6       0.0        ..       5.3    1.1      0.6      0.0             4.5            3.7        0.5       0.3            ..      ..      ..
      Egypt                                            2008             13,828           60.3             57.6        1.0         0.0      11.9      7.4       0.5      36.1        0.7        0.0        0.0                2.7              0.4              0.2       2.0   an
                                                                                                                                                                                                                                                                                         0.5     0.4     9.2           Netherlands                                   2008          2,196        69.0 n
                                                                                                                                                                                                                                                                                                                                                                                                                 67.0     3.0           7.0     40.0        ..        ..       8.0    9.0       ..      0.0             2.0             ..         ..        ..           0.0    -0.1      ..
      Libyan Arab Jamahiriya                           1995                475           45.2             25.7         ..          ..       9.6       ..        ..      11.2         ..         ..        4.9   ay
                                                                                                                                                                                                                            19.6   bc
                                                                                                                                                                                                                                               ..               ..        ..              ..      ..      ..           Switzerland                                 1994/95         1,029        82.0 n
                                                                                                                                                                                                                                                                                                                                                                                                                 77.5    13.8     ac
                                                                                                                                                                                                                                                                                                                                                                                                                                        8.3     34.1       0.3        ..       6.0   14.2      0.9      0.0             4.5            2.3        2.2       0.0            ..      ..      ..
      Morocco                                        2003/04             4,432           63.0             52.0        2.7         0.0      40.1      2.1       0.0       5.4        1.5        0.1        0.0               11.0              3.8              4.4       2.9   ap, aq
                                                                                                                                                                                                                                                                                         0.3     0.2    10.0          LATIN AMERICA AND THE CARIBBEAN                 2009        93,724        72.9             67.0    25.9           2.3     16.4       5.4       0.1       7.0    9.6      0.3      0.0             6.0            3.0        2.6       0.4          0.2      0.4     9.9
      Sudan                                            2006              5,931            7.6              5.7        0.3         0.0       4.3      0.5        ..       0.3        0.3        0.0        0.0                1.9              0.2              0.1       1.6   ap
                                                                                                                                                                                                                                                                                         0.1     0.0    26.0   h, x


      Tunisia                                          2006              1,614           60.2             51.5        5.6          ..      14.5      1.4       0.3      27.8        1.3        0.3        0.3   i
                                                                                                                                                                                                                             8.7   i
                                                                                                                                                                                                                                              8.0              0.6       0.1            -0.6    -0.6    12.1   h      Caribbean                                       2009          6,506       61.6             57.0    22.5           0.4       9.2      5.1       0.6      11.3    7.7      0.1      0.1             4.7            1.8        1.9       0.9          0.2      0.1 20.3
 Southern Africa                                          2009            5,890          58.4             58.1       13.0         0.6      11.0    26.9        0.0       1.1        5.5        0.0        0.0                0.3              0.0              0.1       0.2            0.4      0.5    15.5           Anguilla                                      2003              1        43.0 l, n, r
                                                                                                                                                                                                                                                                                                                                                                                                                 40.8     2.6           0.0     17.6       1.7       0.0       2.6   15.0      0.4      0.9            2.6             0.9        1.7       0.0            ..      ..       ..
                                                                                                                                                                                                                                                                                                                       Antigua and Barbuda                           1988              9        52.6 n
                                                                                                                                                                                                                                                                                                                                                                                                                 50.6    11.4           0.0     26.2       3.2        ..       1.1    5.5      3.2      0.0            2.0             0.5        1.1       0.4            ..      ..       ..
      Botswana                                         2000                159           44.4             42.1        1.2         0.2      14.3     8.1        0.4       1.7      15.5         0.1        0.6                2.3              0.2              0.0       2.1   am
                                                                                                                                                                                                                                                                                         ..       ..    26.9   h

                                                                                                                                                                                                                                                                                                                       Bahamas                                       1988             24        61.7 n
                                                                                                                                                                                                                                                                                                                                                                                                                 60.1    16.4           0.0     31.5       4.8        ..       3.7    2.3      1.4      0.0            1.6  ar, as
                                                                                                                                                                                                                                                                                                                                                                                                                                                                                                                                        ..         ..        ..            ..      ..       ..
      Lesotho                                          2009                281           47.0   j
                                                                                                          45.6        2.4         0.0      12.5    19.3        0.1       1.9       9.4         0.0        0.1                1.4              0.1              0.7       0.6            1.8      1.8    31.0   h

                                                                                                                                                                                                                                                                                                                       Barbados                                      1988             38        55.0 n
                                                                                                                                                                                                                                                                                                                                                                                                                 53.3    10.0           0.3     27.0       0.9        ..       5.2    7.4      2.6      0.0            1.7             0.7        1.0       0.0            ..      ..       ..
      Namibia                                        2006/07               191           55.1             53.5       10.3         0.4       8.6    21.8        0.2       1.4      10.6         0.1        0.1   ai
                                                                                                                                                                                                                             1.6              0.4              0.3       0.9   aq
                                                                                                                                                                                                                                                                                        1.3      1.2    20.6
                                                                                                                                                                                                                                                                                                                       Cuba                                          2006          1,928        72.6             71.6    19.0           0.0      5.5       0.9       0.1      35.2   10.6      0.1      0.2 ai
                                                                                                                                                                                                                                                                                                                                                                                                                                                                                                                       1.0             0.5        0.3       0.2 ap
                                                                                                                                                                                                                                                                                                                                                                                                                                                                                                                                                                         -0.1    -0.1       ..
      South Africa                                   2003/04             4,864           59.9             59.8       14.3         0.7      10.9    28.4        0.0       1.0       4.6         0.0        0.0                0.0              0.0              0.0       0.0   ap
                                                                                                                                                                                                                                                                                        0.3      0.3    13.8
                                                                                                                                                                                                                                                                                                                       Dominica                                      1987              8        49.8 n
                                                                                                                                                                                                                                                                                                                                                                                                                 47.9    11.9           0.0     17.2      11.2        ..       1.6    6.0      0.0      0.0            1.9  ar, as
                                                                                                                                                                                                                                                                                                                                                                                                                                                                                                                                        ..         ..        ..            ..      ..       ..
      Swaziland                                      2006/07               118           50.6             46.8        5.8         0.2       9.9    17.2        0.1       1.4      12.2         0.0        0.1   ai
                                                                                                                                                                                                                             3.8              0.3              2.2       1.3   ap, aq
                                                                                                                                                                                                                                                                                        2.5      2.3    24.0
                                                                                                                                                                                                                                                                                                                       Dominican Republic                            2007          1,579        72.9             69.5    47.4           0.0     13.4       4.2       0.6       2.1    1.9       ..      0.0            3.4             1.3        1.5       0.6 ap, aq
                                                                                                                                                                                                                                                                                                                                                                                                                                                                                                                                                                          0.9     0.8     11.4
 Western Africa                                           2009           49,666          14.4              8.7        0.4         0.0       2.7      2.8       0.2       0.7        1.9        0.0        0.0                5.7              2.2              1.3       2.2            0.0      0.1    24.2           Grenada                                       1990             10        54.3 n
                                                                                                                                                                                                                                                                                                                                                                                                                 52.1     1.0           0.0     15.1       9.0        ..       3.0   21.9      2.1      0.0            2.1  i
                                                                                                                                                                                                                                                                                                                                                                                                                                                                                                                                        ..         ..        ..            ..      ..       ..
      Benin                                              2006            1,318           17.0              5.9   l
                                                                                                                      0.3         0.0       1.5     1.8        0.5       0.6        1.1        0.0        0.0               11.1   l
                                                                                                                                                                                                                                              6.9              3.6       0.5   ap, aq
                                                                                                                                                                                                                                                                                        -0.1     0.0    29.9           Haiti                                       2005/06         1,479        32.0             23.6     2.1            ..      3.3      11.0       1.6        ..    5.3       ..      0.2 ax
                                                                                                                                                                                                                                                                                                                                                                                                                                                                                                                       8.4             2.4        4.2       1.8 ap, aq
                                                                                                                                                                                                                                                                                                                                                                                                                                                                                                                                                                          0.4     0.1     37.5
      Burkina Faso                                       2006            2,553           17.4             13.3        0.1         0.0       4.6     5.0        2.0       0.1        1.4        0.1        0.0                4.1              2.9              0.1       1.1   ap
                                                                                                                                                                                                                                                                                         0.6     0.8    28.8   h
                                                                                                                                                                                                                                                                                                                       Jamaica                                     2002/03           365        69.0             66.2    12.0           0.0     18.0      11.0       0.0       1.0   24.0      0.0      0.2 ak
                                                                                                                                                                                                                                                                                                                                                                                                                                                                                                                       2.8             0.0        2.0       0.8           0.2     0.2     11.7    n


      Cape Verde                                         2005               55           61.3             57.1       14.8          ..      21.4    11.3         ..       2.2        6.1         ..        1.3   av
                                                                                                                                                                                                                             4.2              1.9              2.2       0.1   ap
                                                                                                                                                                                                                                                                                         0.7     0.9    16.7           Montserrat                                    1984              1        52.6 n
                                                                                                                                                                                                                                                                                                                                                                                                                 52.2      ..            ..     30.6       3.2       0.0      11.0    3.4      2.4      1.6 ad, ae
                                                                                                                                                                                                                                                                                                                                                                                                                                                                                                                       0.3  ar, as
                                                                                                                                                                                                                                                                                                                                                                                                                                                                                                                                        ..         ..        ..            ..      ..       ..
      Côte d’Ivoire                                      2006            2,823           12.9              8.0         ..          ..       5.5     1.1         ..        ..        1.0         ..        0.5   at
                                                                                                                                                                                                                             4.9              3.0               ..       1.9   ap
                                                                                                                                                                                                                                                                                        -0.2     0.1    27.7   h
                                                                                                                                                                                                                                                                                                                       Puerto Rico                                   2002            532        84.1 n
                                                                                                                                                                                                                                                                                                                                                                                                                 72.2    38.5           5.3     15.5       2.7       0.0       1.2    8.8      0.2      0.0           12.0             8.2        2.1       1.7 i
                                                                                                                                                                                                                                                                                                                                                                                                                                                                                                                                                                          0.2     0.2      4.0   h, n


      Gambia                                             2001              240           17.5   l
                                                                                                          12.7        0.7          ..       6.5     3.5         ..       1.4        0.5        0.1        0.0                2.4              2.1              0.2       0.1   aq
                                                                                                                                                                                                                                                                                         0.1     0.1      ..           Saint Kitts and Nevis                         1984              2        40.6 n
                                                                                                                                                                                                                                                                                                                                                                                                                 37.0      ..            ..     19.7       2.3       0.0       3.8    5.6      3.0      2.6 ad, ae
                                                                                                                                                                                                                                                                                                                                                                                                                                                                                                                       3.6  ar, as
                                                                                                                                                                                                                                                                                                                                                                                                                                                                                                                                        ..         ..        ..            ..      ..       ..
      Ghana                                              2008            3,530           23.5             16.6   l
                                                                                                                      1.6         0.0       4.7     6.2        0.9       0.2        2.4        0.3        0.1   ai
                                                                                                                                                                                                                             6.9              4.7              1.4       0.8   aq
                                                                                                                                                                                                                                                                                         0.1     0.2    35.3           Saint Lucia                                   1988             15        47.3 n
                                                                                                                                                                                                                                                                                                                                                                                                                 45.9     7.7           0.0     18.5       7.5        ..       4.6    5.9      1.7      0.0            1.4  ar, as
                                                                                                                                                                                                                                                                                                                                                                                                                                                                                                                                        ..         ..        ..            ..      ..       ..
      Guinea                                             2005            1,610            9.1              4.0        0.2         0.0       1.6     1.0        0.0       0.1        1.1        0.0        0.0                5.1              1.0              0.0       4.1   ap
                                                                                                                                                                                                                                                                                         0.3     0.0    21.2           Saint Vincent and the Grenadines              1988             13        58.3 n
                                                                                                                                                                                                                                                                                                                                                                                                                 55.9    13.4            ..     24.5       6.8       0.0       2.6    7.5       ..      1.1 ad, ah
                                                                                                                                                                                                                                                                                                                                                                                                                                                                                                                       2.4  am, ar
                                                                                                                                                                                                                                                                                                                                                                                                                                                                                                                                        ..        1.7        ..            ..      ..       ..
      Guinea-Bissau                                      2006              229           10.3              6.1        0.3         0.0       1.3     0.7        0.1       2.9        0.7        0.0        0.1   ai
                                                                                                                                                                                                                             4.2              0.3              0.0       3.9   ap
                                                                                                                                                                                                                                                                                         0.3     0.3      ..           Trinidad and Tobago                           2006            210        42.5             37.7     8.4           0.1     10.9       2.4       0.3       2.5   13.0      0.1      0.0            4.8             1.7        1.8       1.4 ap
                                                                                                                                                                                                                                                                                                                                                                                                                                                                                                                                                                          0.5     0.5     16.1    h


      Liberia                                            2007              579           11.4             10.3        0.6         0.0       3.8     4.1        0.0       0.2        1.6         ..        0.0                1.2              1.0              0.2       0.0             0.2     0.2    35.6           United States Virgin Islands                  2002             11        78.4 n
                                                                                                                                                                                                                                                                                                                                                                                                                 72.6    19.2           2.1     18.8       5.2       0.0       1.4   25.3      0.5      0.0            5.8             3.7        0.5       1.6            ..      ..       ..
      Mali                                               2006            2,447            8.2              6.3        0.3         0.0       2.9     2.5        0.1       0.1        0.4        0.0        0.0                1.9              0.8              0.0       1.1   ap, aq
                                                                                                                                                                                                                                                                                         0.0     0.1    31.2          Central America                                 2009        25,032        68.2             63.0    33.7           0.7       5.9      6.9       0.0       9.6    5.7      0.3      0.0             5.2            2.6        2.1       0.5          0.0      0.3 13.2
      Mauritania                                         2007              460            9.3              8.0        0.1         0.0       5.7     1.0        0.0       0.3        0.4        0.1        0.4   i
                                                                                                                                                                                                                             1.3              0.2   i
                                                                                                                                                                                                                                                               1.0       0.1   i, ap
                                                                                                                                                                                                                                                                                         0.2     0.4    31.6   h

                                                                                                                                                                                                                                                                                                                       Belize                                        2006             48        34.3             31.2     8.9           0.1     10.8       5.0       0.1       2.1    4.1      0.1      0.0             3.2            1.7        0.3       1.2 ap
                                                                                                                                                                                                                                                                                                                                                                                                                                                                                                                                                                         -2.1    -1.7     20.8    h, n

      Niger                                              2006            2,511           11.2              5.0        0.3         0.0       3.0     1.5        0.0       0.1        0.0        0.0        0.0                6.2              0.1              0.0       6.1   ap, aq
                                                                                                                                                                                                                                                                                        -0.3     0.1    15.8
                                                                                                                                                                                                                                                                                                                       Costa Rica                                    1999            504        80.0 n
                                                                                                                                                                                                                                                                                                                                                                                                                 71.5    21.4           0.5     25.6       5.9       0.0       6.9   10.9      0.3      0.0             8.5            6.5        1.8       0.2            ..      ..      5.0   h, n

      Nigeria                                            2008           24,943           14.6              8.1        0.4         0.0       1.7     2.6        0.0       1.0        2.4        0.0        0.0                6.5              2.1              2.0       2.5   ap, aq
                                                                                                                                                                                                                                                                                          ..      ..    20.2
                                                                                                                                                                                                                                                                                                                       El Salvador                                   2008            866        72.5 n
                                                                                                                                                                                                                                                                                                                                                                                                                 65.9    32.1           0.3      5.5      22.5       0.1       0.8    4.6       ..      0.0             6.6            3.7        2.6       0.3 ap
                                                                                                                                                                                                                                                                                                                                                                                                                                                                                                                                                                          1.1     1.0      8.9   h, n

      Senegal                                            2005            1,833           11.8             10.0        0.5         0.0       3.6     3.2        0.6       0.5        1.5        0.1        0.0                1.8              0.6              0.1       1.1   ap, aq
                                                                                                                                                                                                                                                                                         0.1     0.2    31.6
                                                                                                                                                                                                                                                                                                                       Guatemala                                     2002          1,800        43.3             34.4l
                                                                                                                                                                                                                                                                                                                                                                                                                         16.8           1.0      3.4       9.0       0.1       1.9    2.3      0.1      0.0             8.8            6.3        2.3       0.2 ap, aq
                                                                                                                                                                                                                                                                                                                                                                                                                                                                                                                                                                          0.4     0.3     27.6
      Sierra Leone                                       2008              951            8.2              6.0        0.0         0.0       2.3     2.9        0.0       0.2        0.6        0.0        0.0                2.1              0.2              0.0       1.9   ap, aq
                                                                                                                                                                                                                                                                                         0.4     0.2    27.6
                                                                                                                                                                                                                                                                                                                       Honduras                                    2005/06         1,025        65.2             56.1    21.2           0.3     11.3      13.8       0.0       6.6    2.9      0.0      0.0             9.1            3.1        5.8       0.2 ap
                                                                                                                                                                                                                                                                                                                                                                                                                                                                                                                                                                          0.6     0.8     16.9
      Togo                                               2006              989           16.8             11.1        0.3         0.0       2.0     3.3        1.0       0.4        3.8        0.1        0.1   ai
                                                                                                                                                                                                                             5.7              4.9              0.3       0.5   ap
                                                                                                                                                                                                                                                                                        -1.0     0.2    32.3   h

                                                                                                                                                                                                                                                                                                                       Mexico                                        2006         17,910        70.9             66.5      ..            ..      4.7       5.0        ..      11.6    6.4      0.4     38.4 ad, ae
                                                                                                                                                                                                                                                                                                                                                                                                                                                                                                                        4.4             ..         ..        ..          -0.1     0.2     12.0    n


     ASIA                                                 2009         780,102           66.2             60.2       23.4         2.2       6.0      3.2       0.4      17.9        6.9        0.1        0.0                6.0              2.7              2.8       0.4            0.2      0.1     9.3           Nicaragua                                   2006/07           847        72.4             68.8    24.3           0.4     13.5      23.4       0.0       3.4    3.8      0.0      0.0             3.7            1.7        1.0       1.0 ap
                                                                                                                                                                                                                                                                                                                                                                                                                                                                                                                                                                          0.7     0.8      7.5   n


                                                                                                                                                                                                                                                                                                                       Panama                                      1984/85           302        58.2 n
                                                                                                                                                                                                                                                                                                                                                                                                                 54.2    32.4           0.4     11.8       0.8        ..       6.0    1.6      1.2      0.0             4.0            2.3        1.4       0.3            ..      ..       ..
     Central Asia                                         2009          11,607           56.8             51.5        1.4         0.1       3.6      1.6       0.0      41.5        3.0        0.2        0.1                5.3              1.4              1.2       2.7            -0.6    -0.2    11.8
                                                                                                                                                                                                                                                                                                                      South America                                   2009        62,186        76.1             69.6    23.1           3.1     21.4       4.8       0.1       5.5   11.4      0.2      0.0             6.4            3.2        2.9       0.3          0.3      0.5     7.5
      Kazakhstan                                       2006              2,876           50.7             48.7        0.5         0.0       6.7      0.3       0.0      36.2        4.8        0.1        0.1   ai
                                                                                                                                                                                                                             2.0              0.5              0.4       1.1   ap
                                                                                                                                                                                                                                                                                        -1.5    -0.4     8.7   h


      Kyrgyzstan                                     2005/06               892           47.8             45.5        0.9         0.0       5.1      1.2       0.0      32.0        5.8        0.3        0.1   ai
                                                                                                                                                                                                                             2.3              0.7              0.5       1.1   ap
                                                                                                                                                                                                                                                                                        -0.9    -0.2    11.6   h       Argentina                                     2001          5,059        65.3 m, n
                                                                                                                                                                                                                                                                                                                                                                                                                 63.8      ..            ..     30.4        ..        ..       9.5   22.3      1.6      0.0           13.3             9.1         ..       4.2            ..      ..   ..
      Tajikistan                                       2007              1,146           37.1             31.7         ..          ..       2.6      0.7       0.0      25.9        1.3        0.9        0.3   ad, ae
                                                                                                                                                                                                                             5.5              1.9              0.7       2.9   am, ao
                                                                                                                                                                                                                                                                                         0.4     0.5      ..           Bolivia (Plurinational State of)              2008          1,460        60.5             33.8     6.5           0.1      3.3      11.3       0.0       8.4    4.0      0.1      0.0           26.7            20.8        4.9       1.0 ap, aq
                                                                                                                                                                                                                                                                                                                                                                                                                                                                                                                                                                          0.8     0.7 20.2
      Turkmenistan                                     2000                748           61.8             45.2        1.8         0.0       1.2      1.0       0.0      39.0        2.0        0.0        0.2   i
                                                                                                                                                                                                                            16.6              2.1              5.3       9.2   ap
                                                                                                                                                                                                                                                                                          ..      ..    10.1           Brazil                                        2006         32,774        80.3             77.1    29.1           5.1     24.7       4.0       0.1       1.9   12.2      0.0      0.0            3.2             1.1        2.1       0.0           0.2     0.5 6.0
      Uzbekistan                                       2006              5,275           64.9             59.3        2.1         0.1       2.3      2.7       0.1      49.7        2.1        0.1        0.1   ai
                                                                                                                                                                                                                             5.6              1.7              1.1       2.8   ap
                                                                                                                                                                                                                                                                                        -0.3    -0.4    13.7   h       Chile                                         2006          2,358        64.2 n, o, ab
                                                                                                                                                                                                                                                                                                                                                                                                                   ..     7.1            ..     29.1        ..        ..      18.9    9.1       ..       ..             ..              ..         ..        ..           0.4     0.7   ..
                                                                                                                                                                                                                                                                                                                       Colombia                                    2004/05         6,194        78.2             67.6    31.2           1.8      9.7       5.8       0.3      11.2    7.1      0.5      0.0           10.6             3.8        5.7       1.2 ap, aq
                                                                                                                                                                                                                                                                                                                                                                                                                                                                                                                                                                          0.1     0.5 5.8
 Eastern Asia                                             2009         298,614            82.8            81.3       26.4          4.6      1.3      0.1       0.4      37.8      10.6         0.2        0.0                1.4              0.7              0.7       0.1            -0.2    -0.2     2.3           Ecuador                                       2004          1,988        72.7             58.7    24.2           0.0     13.3       5.9       0.0      10.1    4.3      0.2      0.7           14.0             7.5        5.7       0.8           0.6     0.6 7.4        n


      China                                              2006         263,886            84.6             84.0       28.7         4.5       1.2     0.0        0.3      40.6       8.5         0.2        0.0                0.6              0.3             0.3         ..            -0.2    -0.2     2.3   h, n
                                                                                                                                                                                                                                                                                                                       Guyana                                        2009            133        42.5 j
                                                                                                                                                                                                                                                                                                                                                                                                                 39.8     5.3           0.0      9.2       4.8       0.2       7.3   12.9      0.0      0.0            2.7             0.7        1.4       0.6 ap, aq
                                                                                                                                                                                                                                                                                                                                                                                                                                                                                                                                                                          0.6     0.4   ..
      China, Hong Kong SAR                               2007           1,074            79.5             75.4        7.1         0.6       6.7     1.2         ..       9.3      50.3         0.2        0.0                4.1              2.3             1.8        0.0            -0.7    -0.6      ..           Paraguay                                      2008            896        79.4 n
                                                                                                                                                                                                                                                                                                                                                                                                                 70.1l
                                                                                                                                                                                                                                                                                                                                                                                                                          9.9           0.2     18.0      16.5        ..      12.3   13.2      0.1      0.0            9.3  l
                                                                                                                                                                                                                                                                                                                                                                                                                                                                                                                                       4.5        4.3       0.6 ap
                                                                                                                                                                                                                                                                                                                                                                                                                                                                                                                                                                          1.5     2.0 4.7        n


      Dem. People’s Rep. of Korea                        2002           3,275            68.6             58.2        4.4         0.8       3.7     0.0        0.0      42.8       5.8         0.7   i
                                                                                                                                                                                                          0.0               10.4   ar, as
                                                                                                                                                                                                                                               ..              ..         ..             0.1     0.1      ..           Peru                                          2009          4,176        73.2     l
                                                                                                                                                                                                                                                                                                                                                                                                                 49.9l
                                                                                                                                                                                                                                                                                                                                                                                                                          9.4           0.4      7.6      18.1       0.0       3.8   10.0      0.3      0.0           23.3            15.6        6.5       1.2 ap, aq
                                                                                                                                                                                                                                                                                                                                                                                                                                                                                                                                                                          0.5     0.0 7.2
      Japan                                              2005          14,500            54.3   m, n
                                                                                                          44.4        1.5         0.4       1.0      ..         ..       0.9      40.7          ..        0.0               16.8              3.4            11.8        1.6            -0.2    -0.4      ..           Suriname                                      2006             83        45.6             45.0     9.1           0.1     27.3       3.1       0.0       1.5    3.9      0.0      0.0            0.6             0.3        0.1       0.2           0.4     0.5   ..
      Mongolia                                           2005             453            66.0             60.6        2.4         0.1      11.5    11.1        0.8      28.9       5.3         0.2        0.3   ai
                                                                                                                                                                                                                             5.4              4.7             0.1        0.7   ap
                                                                                                                                                                                                                                                                                        -0.2     0.7     4.6   h, n
                                                                                                                                                                                                                                                                                                                       Uruguay                                       2004            484        77.0 n, o, p
                                                                                                                                                                                                                                                                                                                                                                                                                 74.8k
                                                                                                                                                                                                                                                                                                                                                                                                                          5.4           0.8     23.9        ..        ..      12.3   30.8       ..      1.6 af, ah
                                                                                                                                                                                                                                                                                                                                                                                                                                                                                                                       2.2  k
                                                                                                                                                                                                                                                                                                                                                                                                                                                                                                                                       1.5        0.7       0.0          -0.1     0.1   ..
      Republic of Korea                                  2009           7,679            80.0   n
                                                                                                          70.1   k
                                                                                                                      5.9        16.8       2.0      ..         ..      12.8      24.3         0.9        7.4   ai
                                                                                                                                                                                                                             9.9              9.9              ..         ..             0.1     0.2      ..           Venezuela (Bolivarian Rep. of)                1998          3,260        70.3             61.7      ..            ..     21.1        ..        ..       9.5    3.4       ..     27.7 ad, ae
                                                                                                                                                                                                                                                                                                                                                                                                                                                                                                                       8.6             3.6        4.5       0.5            ..      .. 18.9        n


     Southern Asia                                        2009         326,149           53.9             45.8       28.9         1.0       6.9      1.6       0.1       2.0        5.1        0.0        0.0                8.1              4.4              3.3       0.4            0.8      0.6    14.6          NORTHERN AMERICA                                2009        42,569        78.1             72.9    22.3          13.7     16.8       1.4       0.6       4.8   12.0      0.5      0.8             5.2            1.1        4.2       0.0          0.4      0.4     6.6
      Afghanistan                                      2006             4,522            18.6   m, n
                                                                                                          15.5        0.7          ..       8.1     5.4         ..       1.0        2.2         ..        0.0                4.3              0.5             0.6        3.2   ap
                                                                                                                                                                                                                                                                                         2.0     1.3      ..           Canada                                        2002          4,460        74.0 m, n
                                                                                                                                                                                                                                                                                                                                                                                                                 72.0    11.0 aj
                                                                                                                                                                                                                                                                                                                                                                                                                                       22.0     21.0       1.0        ..       1.0   15.0      1.0      0.0             9.0            3.0        6.0       0.0          -0.3    -0.1      ..
      Bangladesh                                       2007            34,086            55.8             47.5   l
                                                                                                                      5.0         0.7      28.5     7.0        0.7       0.9        4.5         ..        0.0                8.3              4.9             2.9        0.6             0.2     0.5    16.8           United States of America                    2006/08        38,147        78.6 n
                                                                                                                                                                                                                                                                                                                                                                                                                 73.0    23.6          12.7     16.3       1.4       0.7       5.3   11.7       ..      1.3 ba
                                                                                                                                                                                                                                                                                                                                                                                                                                                                                                                        5.6            1.2        4.5       0.0           0.5     0.5     6.6    n


      Bhutan                                           2000                82            30.7             30.7        3.1        13.6       3.4     5.9        0.0       3.4        1.2         ..        0.0                 ..               ..              ..         ..              ..      ..      ..
      India                                          2005/06          219,989            56.3             48.5   l
                                                                                                                     37.3         1.0       3.1     0.1        0.0       1.7        5.2        0.0        0.0                7.8       l
                                                                                                                                                                                                                                              4.9             2.5        0.3   aq
                                                                                                                                                                                                                                                                                         1.0     0.7    12.8          OCEANIA                                         2009          4,534       59.8             56.7    13.9           9.8     17.3       3.7       0.5       1.1    9.8      0.5      0.1             3.1            1.5        0.5       1.1          0.1      0.1       ..
      Iran (Islamic Republic of)                       2002            12,016            73.3   n
                                                                                                          58.9       15.2         2.3      25.1     2.3        0.4       7.6        6.0         ..        0.0               14.3              1.7            11.4        1.2            -0.1     0.3      ..          Australia/New Zealand                           2009          2,996       71.6             71.1    15.4          14.6     22.8       1.2       0.6       1.3   14.2      0.8      0.1             0.5            0.3        0.2       0.0          0.1      0.2       ..
      Maldives                                         2009                57            34.7   j
                                                                                                          27.0       10.1         0.5       4.6     1.2        0.5       0.8        9.3        0.0        0.0                7.8              3.4             4.2        0.1   aq
                                                                                                                                                                                                                                                                                        -0.7    -0.7      ..
                                                                                                                                                                                                                                                                                                                       Australia                                   2001/02         2,306        70.8 m, n
                                                                                                                                                                                                                                                                                                                                                                                                                 70.8    15.9          13.7     23.8       1.1       0.8       0.8   15.2      0.8      0.1 ai
                                                                                                                                                                                                                                                                                                                                                                                                                                                                                                                        6.3            3.1        3.2       0.0 ao
                                                                                                                                                                                                                                                                                                                                                                                                                                                                                                                                                                         0.1      0.2       ..
      Nepal                                            2006             5,457            48.0             44.2       18.0         6.3       3.5    10.1        0.8       0.7        4.8        0.0        0.0                3.7              1.2             2.6        0.0   aq
                                                                                                                                                                                                                                                                                         1.2     0.8    24.6
                                                                                                                                                                                                                                                                                                                       New Zealand                                   1995            549        75.0 i, n
                                                                                                                                                                                                                                                                                                                                                                                                                 72.3    14.6          19.5     20.7       1.8        ..       3.4   11.5      0.8      0.0             2.7            1.6        1.0       0.1 am
                                                                                                                                                                                                                                                                                                                                                                                                                                                                                                                                                                          ..       ..       ..
      Pakistan                                       2007/08           27,475            27.0             19.3        6.5          ..       1.9     2.7         ..       2.5        5.4         ..        0.3 i, ad, ag
                                                                                                                                                                                                                             7.7              1.4             6.0        0.3   i
                                                                                                                                                                                                                                                                                          ..      ..    24.9   h


      Sri Lanka                                      2006/07            3,447            68.0   j, z
                                                                                                          52.7       16.9         0.7       7.9    15.0        0.3       6.3        5.5        0.0        0.0               15.3              9.6             5.5        0.2   ap, aq
                                                                                                                                                                                                                                                                                        -0.2     0.3     7.3   z      Melanesia/Micronesia/Polynesia                  2009         1,538        36.7             28.6    11.1           0.3       6.6      8.6       0.1       0.7    1.3      0.0      0.0             8.0            3.7        1.1       3.2          0.6      0.5       ..
     South-Eastern Asia                                   2009         106,793           62.2             54.7        7.2         0.3      15.6    17.7        1.3       9.9        2.8        0.0        0.0                7.5              3.3              3.3       0.8            0.6      0.6    11.0           Cook Islands                                  1999              2        43.2 n
                                                                                                                                                                                                                                                                                                                                                                                                                 38.2     4.4 i
                                                                                                                                                                                                                                                                                                                                                                                                                                        0.6i
                                                                                                                                                                                                                                                                                                                                                                                                                                                15.2      16.3        ..       1.4    0.3      0.0      0.0            4.9             0.3        1.1       3.5           ..       ..   ..
                                                                                                                                                                                                                                                                                                                       Guam                                          2002             24        66.6 n
                                                                                                                                                                                                                                                                                                                                                                                                                 58.3    18.2           3.9     24.0       4.6       0.0       0.7    6.9      0.0      0.0            8.3             2.5        2.1 i
                                                                                                                                                                                                                                                                                                                                                                                                                                                                                                                                                            3.7 i
                                                                                                                                                                                                                                                                                                                                                                                                                                                                                                                                                                          ..       ..   ..
      Cambodia                                         2005              2,126           40.0             27.1   l
                                                                                                                      1.7         0.1      12.6     7.9        0.2       1.8       2.9         0.0        0.0               12.9       l
                                                                                                                                                                                                                                              4.5              8.3       0.2   ap, aq
                                                                                                                                                                                                                                                                                        1.8      1.0    25.1
                                                                                                                                                                                                                                                                                                                       Kiribati                                      2000             10        36.1 n
                                                                                                                                                                                                                                                                                                                                                                                                                 31.1     1.4           1.0      6.5      14.4       6.3       0.9    0.4      0.1      0.0            5.0             2.9        1.0       1.1           ..       ..   ..
      Indonesia                                        2007             45,382           61.4             57.4   l
                                                                                                                      3.0         0.2      13.2    31.8        2.8       4.9       1.3         0.0        0.0                4.0              1.5              2.1       0.4   ap, aq
                                                                                                                                                                                                                                                                                        0.7      0.4     9.1
                                                                                                                                                                                                                                                                                                                       Marshall Islands                              2007              9        44.6             42.4    25.0           0.2      2.7       9.2       3.8        ..    1.4       ..      0.0            2.2             1.4        0.6       0.2 aq
                                                                                                                                                                                                                                                                                                                                                                                                                                                                                                                                                                         0.6      0.8 8.1
      Lao People’s Dem. Republic                       2000                822           32.2             28.9   l
                                                                                                                      4.7         0.0      12.9     7.6        0.1       3.0       0.5         0.0        0.0                3.2              2.2              0.7       0.3   aq
                                                                                                                                                                                                                                                                                        0.6      0.6    27.0   h

                                                                                                                                                                                                                                                                                                                       Nauru                                         2007              1        35.6 j
                                                                                                                                                                                                                                                                                                                                                                                                                 23.0    13.3           0.2      0.6       2.3        ..       3.8    2.8       ..      0.0           12.6             4.7        4.5       3.3 ap, aq
                                                                                                                                                                                                                                                                                                                                                                                                                                                                                                                                                                          ..       ..   ..
      Malaysia                                         1994              3,021           54.5   w
                                                                                                          29.8         ..          ..      13.4      ..         ..       3.9       5.3          ..        7.2   ad, ae
                                                                                                                                                                                                                            24.6              8.8              6.9       8.9   am
                                                                                                                                                                                                                                                                                         ..       ..      ..
                                                                                                                                                                                                                                                                                                                       Palau                                         2003              3        32.8 n
                                                                                                                                                                                                                                                                                                                                                                                                                 29.7     1.3           0.0     16.9       4.4       5.6       0.9    0.6      0.0      0.0            3.1             0.6        0.0       2.5           ..       ..   ..
      Myanmar                                          2007              8,114           41.0             38.4        4.4         1.0      10.8    19.7         ..       1.8       0.7         0.0        0.0                2.6              1.2              0.7       0.6            0.6      0.7    19.1   h, n

                                                                                                                                                                                                                                                                                                                       Papua New Guinea                              2006          1,115        35.7               ..      ..            ..       ..        ..        ..        ..     ..       ..       ..             ..              ..         ..        ..          0.7      0.5   ..
      Philippines                                      2008             14,573           50.7             33.6   l
                                                                                                                      9.2         0.0      15.7     2.6        0.0       3.7       2.3         0.0        0.0               17.1   l
                                                                                                                                                                                                                                              6.4              9.8       0.8   ap, aq
                                                                                                                                                                                                                                                                                        0.4      0.2    22.3
                                                                                                                                                                                                                                                                                                                       Samoa                                         2009             21        28.7             26.6     6.7           0.0      5.8      13.7       0.0       0.2    0.2      0.0      0.0            2.1             1.2        0.6       0.3 ap, aq
                                                                                                                                                                                                                                                                                                                                                                                                                                                                                                                                                                         0.4      0.3 45.6
      Singapore                                        1997                644           62.0   n
                                                                                                          55.0         ..          ..      10.0      ..         ..       5.0      22.0          ..       18.0   ad, ae
                                                                                                                                                                                                                             7.0   ar, as
                                                                                                                                                                                                                                               ..               ..        ..             ..       ..      ..
                                                                                                                                                                                                                                                                                                                       Solomon Islands                             2006/07            81        34.6             27.3    13.3           0.3      1.3       8.8       0.0       2.1    1.5      0.0      0.0            7.3             4.7        2.2       0.4 ap, aq
                                                                                                                                                                                                                                                                                                                                                                                                                                                                                                                                                                          ..       .. 11.1
      Thailand                                         2006             12,104           81.1             79.8       26.6         0.9      36.7    12.4        0.8       1.2       1.2         0.0        0.0                1.3              0.9               ..       0.4            0.5      0.6     3.1   n

                                                                                                                                                                                                                                                                                                                       Tuvalu                                        2007              2        30.5             22.4     8.5           0.0      2.2       8.4       1.5       1.3    0.5      0.0      0.0            8.1             5.9        1.2       1.0 aq
                                                                                                                                                                                                                                                                                                                                                                                                                                                                                                                                                                          ..       .. 24.2
      Timor-Leste                                    2009/10               149           22.3   j
                                                                                                          20.8        0.8         0.0       1.7    15.9        0.8       1.3       0.2         0.0        0.0                1.6              0.9              0.4       0.3   ap
                                                                                                                                                                                                                                                                                        1.0      0.9     3.8   h

                                                                                                                                                                                                                                                                                                                       Vanuatu                                       2007             36        38.4             36.8     5.8           0.3     15.7      10.6       0.2       2.5    1.1      0.4      0.2 ai
                                                                                                                                                                                                                                                                                                                                                                                                                                                                                                                       1.6             0.8        0.2       0.6 ap
                                                                                                                                                                                                                                                                                                                                                                                                                                                                                                                                                                         0.0      0.3   ..
      Viet Nam                                         2007             15,494           79.0             68.2        4.4         0.3      10.4     0.9        0.1      43.7       8.3         0.0        0.0               10.8              7.2              3.3       0.3            0.6      1.5     4.8   h


     Western Asia                                         2009          36,939           55.1             35.8        4.4         0.1       8.9      1.2       0.0      14.2        6.8        0.2        0.0               19.3              2.3            14.5        2.5            0.5      0.6    13.5
      Armenia                                          2005                549           53.1             19.1        0.6         0.0      0.8       0.0       0.0       9.4       8.1         0.2        0.0               34.0              3.8            27.7        2.5   ap, aq
                                                                                                                                                                                                                                                                                        -0.8    -0.1    13.3
      Azerbaijan                                       2006              1,589           51.1             13.2        0.4         0.0      1.1       0.0       0.0       9.2       2.2         0.2        0.0               37.9              4.0            32.5        1.4   ap
                                                                                                                                                                                                                                                                                        -0.4    -0.3    22.7                                                                                   Percentage of women using some method of contraception among those aged 15-49
      Bahrain                                          1995                 75           61.8   t
                                                                                                          30.6        6.2          ..     10.9       0.0        ..       2.9       9.6         0.0        1.1   ad
                                                                                                                                                                                                                            31.2              3.2            26.3        1.7   an
                                                                                                                                                                                                                                                                                          ..      ..      ..                                                                                               who are married or in a union: most recent data available
      Georgia                                          2005                636           47.3   n
                                                                                                          26.6        2.2         0.0      3.2       0.0        ..      11.6       8.7         0.9        0.0               20.7              9.5            11.2        0.0             0.8     0.8    16.3   n


      Iraq                                             2006              4,099           49.8             32.9        2.6          ..     14.6       2.0        ..      12.2       1.1          ..        0.3   av
                                                                                                                                                                                                                            17.0              2.1             7.5        7.4   ap
                                                                                                                                                                                                                                                                                         0.7     0.8      ..
      Israel                                         1987/88               560           68.0   n, u
                                                                                                          51.9         ..          ..     13.0        ..        ..      30.0       4.0         4.0        0.9   ad, ae
                                                                                                                                                                                                                            16.0              4.0            11.0        1.0              ..      ..      ..
      Jordan                                           2009                965           59.3             40.5        2.6         0.0      8.2       0.7       0.1      22.6       6.3         0.0        0.1   ai
                                                                                                                                                                                                                            18.8              4.0            12.8        2.0   ap, aq
                                                                                                                                                                                                                                                                                         0.5     0.2    11.2
      Kuwait                                           1999                269           52.0   l, n, t
                                                                                                          39.3        4.1          ..     23.4        ..        ..       8.8       2.9         0.1        0.0               12.9              4.1             5.7        3.1   an
                                                                                                                                                                                                                                                                                          ..      ..      ..
      Lebanon                                          2004                572           58.0             34.0         ..          ..       ..        ..        ..        ..        ..          ..         ..               24.0               ..              ..         ..            -0.5    -0.7      ..
      Occupied Palestinian Territory                   2006                524           50.2             38.9         ..          ..      7.0        ..        ..      24.8        ..          ..        7.1   bb
                                                                                                                                                                                                                            11.3   bc
                                                                                                                                                                                                                                               ..              ..         ..            -0.1     0.2      ..
      Oman                                             2000                259           31.7             24.6        5.4         0.0      4.5       8.0        ..       3.3       3.3         0.1        0.0                7.1              1.4             3.9        1.8   an
                                                                                                                                                                                                                                                                                          ..      ..      ..
      Qatar                                            1998                 73           43.2   t
                                                                                                          32.3        4.1          ..     15.8        ..        ..       9.0       2.9          ..        0.5   ah, aw
                                                                                                                                                                                                                            10.9              2.3             6.8        1.8   an
                                                                                                                                                                                                                                                                                          ..      ..      ..
      Saudi Arabia                                     2007              3,578           23.8   n, t
                                                                                                            ..         ..          ..       ..        ..        ..        ..        ..          ..         ..                 ..               ..              ..         ..             0.3     0.3      ..
      Syrian Arab Republic                             2006              2,954           58.3             42.6        1.2         0.0     12.9       0.9       0.0      25.7       1.6         0.2        0.0               15.7              9.2             1.7        4.8   ap
                                                                                                                                                                                                                                                                                         1.4     0.9      ..
      Turkey                                           2008             13,916           73.0             46.0        8.3         0.1      5.3       0.9       0.0      16.9      14.3         0.1        0.0               27.0              0.6            26.2        0.2   ap, aq
                                                                                                                                                                                                                                                                                         0.7     0.7     6.2                                    Contraceptive prevalence
      United Arab Emirates                             1995                278           27.5   t
                                                                                                          23.6        4.2         0.1     12.0       1.4        ..       3.7       2.0         0.2        0.0                4.0              1.6             1.4        1.0   an
                                                                                                                                                                                                                                                                                          ..       ..     ..                                    (percentage)
      Yemen                                            2006              3,114           27.7             19.2        2.3         0.0      9.0       3.5       0.0       4.0       0.4         0.0        0.0                8.4              1.1             0.5        6.8   ap
                                                                                                                                                                                                                                                                                         0.6      0.8   38.6   h
                                                                                                                                                                                                                                                                                                                                                         70 or more
                                                                                                                                                                                                                                                                                                                                                         50 to less than 70
                                                                                                                                                                                                                                                                                                                                                         20 to less than 50
                                                                                                                                                                                                                                                                                                                                                         Less than 20

      Notes                                                                                                                                                                                                                                                                                                                                              No data

                                                                                                                                                                                                                                                 	ad
       The data presented in this chart are the most recent available          the most recent observation or, when data were available for                       Côte d’Ivoire; 1999 for Belize and Kazakhstan; 2000/01                                    I
                                                                                                                                                                                                                                                              ncluding male sterilization.
       as of December 2010.                                                    2010, linear interpolation was used.                                               for Mauritania; 2001 for China, Myanmar and Tunisia;                           	ae
                                                                                                                                                                                                                                                            I
                                                                                                                                                                                                                                                              ncluding female sterilization.
       The more developed regions comprise all regions of Europe                                                                                                  2002 for Burundi and Viet Nam; 2002/03 for El Salvador;                        	 af
                                                                                                                                                                                                                                                            I
                                                                                                                                                                                                                                                              ncluding injectables.
                                                                               Unmet need for family planning is the ratio of the number of 
       plus  Northern  America,  Australia,  New  Zealand  and  Japan.                                                                                            2003 for Burkina Faso, Mongolia and Timor-Leste; 2004                          	ag
                                                                               women  of  reproductive  age  married  or  in  a  union  who  are                                                                                                            I
                                                                                                                                                                                                                                                              ncluding implants.                                                                             The boundaries on this map do not imply official endorsement or acceptance by the United Nations.
       The  less  developed  regions  comprise  all  regions  of  Africa,                                                                                         for Cameroon and Malawi; 2004/05 for Lesotho and 
                                                                               fecund, not using contraception and who report that they do                                                                                                       	ah
                                                                                                                                                                                                                                                            I
                                                                                                                                                                                                                                                              ncluding vaginal barrier methods.
       Asia (excluding Japan) and Latin America and the Caribbean,                                                                                                the United Republic of Tanzania; 2005 for Lao People’s 
                                                                               not  want  any  more  children  or  wish  to  delay  the  next  child                                                                                             	 ai
                                                                                                                                                                                                                                                            I
                                                                                                                                                                                                                                                              ncluding female condoms.
       as well as Melanesia, Micronesia and Polynesia. Developed               divided  by  the  number  of  women  of  reproductive  age  who                    Democratic Republic and Rwanda; 2006/07 for Pakistan.
                                                                                                                                                                                                                                                 	 aj
       countries  are  those  in  the  more  developed  regions.  The                                                                                       	 i                                                                                             E
                                                                                                                                                                                                                                                              xcluding hysterectomies.
                                                                               are  married  or  in  a  union,  expressed  as  a  percentage.  The                  djusted.
                                                                                                                                                                   A                                                                             	ak
       group of least developed countries includes 49 countries as             numerator also includes, unless otherwise indicated, women                   	 j                                                                                             I
                                                                                                                                                                                                                                                              ncluding emergency contraception.
       of December 2010. Other less developed countries comprise               who are pregnant or in the period of postpartum amenorrhea                   	 k
                                                                                                                                                                    reliminary data.
                                                                                                                                                                   P                                                                             	 al
                                                                                                                                                                                                                                                            I
                                                                                                                                                                                                                                                              t is assumed that other traditional methods represent 50                                                                       Percentage of women with an unmet need for family planning among those aged 15-49
                                                                                                                                                                    stimate.
                                                                                                                                                                   E
       the  less  developed  regions  excluding  the  least  developed         and  whose  most  recent  pregnancy  was  unwanted  or  mis-                 	 l
                                                                                                                                                                     igures by method do not add up to the total.
                                                                                                                                                                   F                                                                             a
                                                                                                                                                                                                                                                 	m
                                                                                                                                                                                                                                                            per cent or more of other methods (not specified).                                                                                             who are married or in a union: most recent data available
       countries.                                                              timed but was not due to contraceptive failure.                              	m                                                                                                ncluding abstinence.
                                                                                                                                                                                                                                                            I
                                                                                                                                                                    igures by method do not add up to the total because 
                                                                                                                                                                   F                                                                             	an
       Sub-Saharan Africa includes all the regions of Africa except                                                                                                                                                                                         I
                                                                                                                                                                                                                                                              ncluding breastfeeding.
                                                                               	 a
                                                                                          union involves a man and a woman regularly cohabit-
                                                                                       A                                                                           some methods are used in combination.                                         	ao
       Northern Africa, but includes Sudan.                                                                                                                 	 n                                                                                             I
                                                                                                                                                                                                                                                              ncluding douching.
                                                                                       ing in a marriage-like relationship.                                         ata pertain to a non-standard age or marital status 
                                                                                                                                                                   D                                                                             	ap
                                                                               	   b                                                                               group or definition of unmet need for family planning.                                   I
                                                                                                                                                                                                                                                              ncluding lactational amenorrhea (LAM).
       Two dots (..) indicate that data are not available.                               ercentage of women using contraception among those 
                                                                                       P                                                                                                                                                         	aq
                                                                                                                                                            	 o
                                                                                                                                                                    ata pertain to men and women.
                                                                                                                                                                   D                                                                                        I
                                                                                                                                                                                                                                                              ncluding folk methods.
       Contraceptive  prevalence  is  defined  as  the  percentage  of                 of reproductive age who are married or in a union.                                                                                                        	 ar
                                                                               	   c                                                                        	 p
                                                                                                                                                                    ata pertain to methods used at last sexual intercourse.
                                                                                                                                                                   D                                                                                        I
                                                                                                                                                                                                                                                              ncluding rhythm.
       women of reproductive age (usually aged 15 to 49) who are                         ncluding diaphragms, cervical caps and spermicidal 
                                                                                       I                                                                                                                                                         	as
                                                                                       foams, jelly, cream and sponges.                                     	 q
                                                                                                                                                                    ata pertain to methods used during the last month.
                                                                                                                                                                   D                                                                                        I
                                                                                                                                                                                                                                                              ncluding withdrawal.
       currently using contraception among those in the same age                                                                                                                                                                                 	 at
       group who are married or in a union. A union involves a man 
                                                                               	   d
                                                                                         ncluding emergency contraception, female condom and 
                                                                                       I                                                                    	 r
                                                                                                                                                                    ata pertain to methods used during the last two 
                                                                                                                                                                   D                                                                                        I
                                                                                                                                                                                                                                                              ncluding male and female sterilization and IUD.
                                                                                                                                                                                                                                                 	au
       and a woman regularly cohabiting in a marriage-like relation-                   modern methods not reported separately.                                     months.                                                                                  I
                                                                                                                                                                                                                                                              ncluding male and female sterilization, injectables and 
       ship.  When  more  than  one  contraceptive  method  is  used,          	   e
                                                                                         lso called periodic abstinence or the calendar method.
                                                                                       A                                                                    	 s
                                                                                                                                                                    ata pertain to methods used during the last 12 months.
                                                                                                                                                                   D                                                                                        implants.                                                                               Unmet need
       only  the  most  effective  method  is  recorded,  unless  a  note      	   f                                                                        	 t
                                                                                                                                                                                                                                                 	av
                                                                                                                                                                                                                                                            I
                                                                                                                                                                                                                                                              ncluding male sterilization, implants and vaginal barrier                             (percentage)
                                                                                         ncluding prolonged abstinence, breastfeeding, douch-
                                                                                       I                                                                            ata pertain to nationals of the country.
                                                                                                                                                                   D
       indicates otherwise.                                                            ing, various folk methods and traditional methods not                	 u                                                                                             methods.                                                                                      30 or more
                                                                                                                                                                    ata pertain to the Jewish population.
                                                                                                                                                                   D                                                                             a
                                                                                                                                                                                                                                                 	w
       Annual  change  from  2000  to  2009  in  contraceptive  preva-                 reported separately.                                                 	 v                                                                                               ncluding male sterilization, injectables and implants.
                                                                                                                                                                                                                                                            I
                                                                                                                                                                    ata pertain to the Flemish population.
                                                                                                                                                                   D                                                                             	ax                                                                                                      20 to less than 30
       lence,  expressed  in  terms  of  percentage  points  per  year, 
                                                                               	   g
                                                                                         omen with unmet need are those who were fecund 
                                                                                       W                                                                    	w                                                                                              I
                                                                                                                                                                                                                                                              ncluding male sterilization, IUD and vaginal barrier 
                                                                                                                                                                    ata pertain to Peninsular Malaysia.
                                                                                                                                                                   D
       has  been  estimated  by  dividing  the  difference  between  the               but were not using contraception at the time of the sur-             	 x                                                                                             methods.                                                                                      10 to less than 20
                                                                                                                                                                    ata pertain to Northern Sudan.
                                                                                                                                                                   D                                                                             	ay
       estimates of contraceptive prevalence for 2000 and 2009 by                      vey, and yet reported not wanting any more children or               	 y                                                                                             I
                                                                                                                                                                                                                                                              ncluding female sterilization, injectables, male condoms 
       nine. Estimates of this indicator were obtained only for coun-                  wanting to delay the next child. Data pertain to women                     Excluding Northern Ireland.                                                               and vaginal barrier methods.                                                                  Less than 10
                                                                                                                                                            	 z	
       tries  with  at  least  two  observations,  one  of  which  referred            in a union.                                                                 E
                                                                                                                                                                     xcluding the Northern Province.                                             	az
                                                                                                                                                                                                                                                            I
                                                                                                                                                                                                                                                              ncluding injectables, implants and vaginal barrier meth-
                                                                                                                                                            	aa                                                                                                                                                                                           No data
       to 2001 or a later year. To obtain estimates of contraceptive           	   h
                                                                                         ata pertain to a different year, specifically 1987 for 
                                                                                       D                                                                            ata  pertain  to  unmet  need  for  only  for  the  purpose  of 
                                                                                                                                                                   D                                                                                        ods.
       prevalence for 2000, linear interpolation was used when the                     Trinidad and Tobago; 1988 for Botswana; 1991/92 for                         limiting.                                                                     	ba
                                                                                                                                                                                                                                                            I
                                                                                                                                                                                                                                                              ncluding female condoms, emergency contraception 
       data available referred to years bracketing the year 2000. If                   Belgium; 1992/93 for Costa Rica and Sudan; 1994/95 for 
                                                                                                                                                            	ab
                                                                                                                                                                    ata pertain only to the four most commonly used meth-
                                                                                                                                                                   D                                                                                        and vaginal barrier methods.
       the two points available referred to later years, the estimate                  the Central African Republic; 1995 for Spain; 1995/96 for                   ods.                                                                          	bb
                                                                                                                                                                                                                                                            I
                                                                                                                                                                                                                                                              ncluding male and female sterilization, male condoms, 
       for 2000 was set equal to the earliest observation. The esti-                   Puerto Rico; 1996 for the Comoros and Uzbekistan; 1997               	ac
                                                                                                                                                                    ncluding some cases of sterilization for non-contracep-
                                                                                                                                                                   I                                                                                        injectables, implants and vaginal barrier methods.
       mate of contraceptive prevalence for 2009 was set equal to                      for Kyrgyzstan and Yemen; 1998 for Togo; 1998/99 for                        tive reasons.                                                                 	bc
                                                                                                                                                                                                                                                            I
                                                                                                                                                                                                                                                              ncluding rhythm, withdrawal and breastfeeding.
                                                                                                                                                                                                                                                                                                                                                             The boundaries on this map do not imply official endorsement or acceptance by the United Nations.
Percentage of women using any modern method of contraception among those aged 15-49                                                                          Change in donor assistance for family planning programmes per woman aged 15-49,
                                who are married or in a union: most recent data available                                                                                                            married or in a union: 1998 to 2008*


                                                                                                                                                                                                                                                           Change in donor assistance for family planning programmes
                                                                                                                                                                                                                                                           (percentage)
                                                                                                    Contraceptive prevalence                           * Note: Donor assistance in 2008 is adjusted for inflation using 1998 prices.
                                                                                                    (percentage)                                                                                                                                                 Per capita donor assistance increased
The boundaries on this map do not imply official endorsement or acceptance by the United Nations.         70 or more                                   The boundaries on this map do not imply official endorsement or acceptance by the United Nations.         Per capita donor assistance declined (by less than 50 per cent)
                                                                                                          50 to less than 70                                                                                                                                     Per capita donor assistance declined (by 50 per cent or more)
                                                                                                          20 to less than 50                                                                                                                                     No data available or not applicable
                                                                                                          Less than 20
                                                                                                          No data


                                                                                                                 Contraceptive prevalence by method for each of the major areas


                            Female sterilization                                                                    IUD                                                                        Pill                                                                         Injectable or implant


                             Male sterilization                                                            Male condom                                      Vaginal barrier methods or other modern methods                                                                  Traditional methods


                                                                                                                                                                                                                                             World
                                                                                                                                                                                                                                       Contraceptive Use
                                                                                                                                                                                                                                                                  2011


                                                                                                          Copyright United Nations, 2011
                                                                                                          All rights reserved

                                                                                                          ST/ESA/SER.A/301
                                                                                                          Sales No. E.11.XIII.2

                                                                                                          Enquiries should be directed to:                            USD 10
                                                                                                          Director, Population Division                               ISBN 978-92-1-151478-0
                                                                                                          Department of Economic and Social Affairs
                                                                                                          United Nations, New York, NY 10017, U.S.A.

                                                                                                          Fax number: +1 212 963-2147

                                                                                                          Printed in the United States of America

                                                                                                          11-22431—April 2011—3,185                                                                                                                                 United Nations

World Contraceptive Use 2011 Wall Chart

  • 1.
    World Contraceptive Use2011 United Nations • Department of Economic and Social Affairs • Population Division www.unpopulation.org Introduction  At the 2005 World Summit, Governments committed themselves  of  women  by  age  group  obtained  from  World Population Prospects: The 2008 level of contraceptive prevalence, with only 22 per cent of women of reproductive age  Main methods of contraception used Nine out of every 10 contraceptive users  contraceptive use, there are more countries where at least 30 per cent of contracep- to “achieving universal access to reproductive health by 2015, as set out at the  Revision. 3 who are married or in a union using some method of contraception. Over half of the  in  the  world  rely  on  modern  methods  of  contraception.  Short-acting  and  reversible  tive users rely on the pill than there are countries where a similar share is accounted  International  Conference  on  Population  and  Development”  (General  Assembly  48 countries in sub-Saharan Africa with data available have a level of contraceptive  methods are more commonly used than other methods in developed countries where- for by either female sterilization or the IUD. That is, in many countries, the pill is more  resolution 60/1). This wall chart presents the latest data available on key dimen- Data coverage Information  on  contraceptive  prevalence  is  available  for  most  prevalence below 20 per cent and they are located mainly in Western Africa and in the  as longer-acting and highly effective clinical methods are used more frequently in the  popular  among  contraceptive  users  than  female  sterilization  or  the  IUD  even  if  the  sions  of  reproductive  health,  including  two  of  the  indicators  for  the  Millennium  countries  of  the  world.  As  this  wall  chart  shows,  recent  estimates  of  contraceptive  Horn of Africa. developing  countries.  Thus,  in  developed  countries  as  a  whole,  the  most  commonly  global prevalence of the pill is lower than that of female sterilization or the IUD. Development Goals, namely, contraceptive prevalence relative to the use of any  prevalence referring to 2000 or later years are available for 148 countries or areas. For  used methods are the pill (used by 18 per cent of women of reproductive age who are  an additional 40 countries or areas, the most recent estimates refer to earlier dates,  In  all  other  regions  of  the  developing  world,  contraceptive  prevalence  is  high:  61  married or in a union) and the male condom (with 18 per cent prevalence). Those two  The male condom ranked fourth among modern contraceptive methods in terms of  method  (indicator  5.3)  and  unmet  need  for  family  planning  (indicator  5.6).  The  global prevalence, with 8 per cent of couples where the woman is aged 15 to 49 rely- the earliest being 1984. Those 188 countries or areas account for 99.9 per cent of all  per cent in Northern Africa (excluding Sudan), 66 per cent in Asia, and 73 per cent in  methods accounted for half of all contraceptive use in the developed countries, while  importance  of  reproductive  health  was  validated  at  the  2010  high-level  plenary  ing on this method. The prevalence of condom use is highest in Hong Kong, Special  women of reproductive age who were married or in a union in 2009. Moreover, the 148  Latin America and the Caribbean. Only six of the 47 countries of Asia with data avail- less than one out of every four users in developed countries relied on female sterili- meeting  of  the  sixty-fifth  session  of  the  General  Assembly  on  the  Millennium  zation or the IUD. By contrast, in developing countries the methods with the highest  Administrative Region of China (50 per cent) and Japan (41 per cent). Most of the other  Development  Goals,  and  Governments  committed  themselves  to  “ensuring  that  countries or areas with data referring to 2000 or a later date account for 96 per cent  able have levels of contraceptive prevalence below 30 per cent, namely, Afghanistan,  countries  with  high  levels  of  condom  use  are  located  in  Europe,  although  there  are  of all women of reproductive age who are married or in a union. Among the countries  Pakistan, Saudi Arabia, Timor-Leste, the United Arab Emirates and Yemen. No country  prevalence were female sterilization (21 per cent) and the IUD (15 per cent), account- all women, men and young people have information about, access to and choice  ing together for 58 per cent of overall contraceptive use. also a few in Asia and in Latin America and the Caribbean. Condom prevalence levels  of the widest possible range of safe, effective, affordable and acceptable meth- lacking data altogether, only Croatia, Cyprus and Fiji have more than 100,000 women  in Latin America and the Caribbean has a level of contraceptive prevalence below 30  range from 30 per cent to 40 per cent in Greece, the Russian Federation and Uruguay. ods of family planning” (General Assembly resolution 65/1). aged 15 to 49 who are married or in a union. per cent. However, 10 of the 37 countries in that major area having the required data  For  the  world  as  a  whole,  female  sterilization  is  the  most  commonly  used  method  have  contraceptive  prevalence  levels  below  50  per  cent,  namely,  Anguilla,  Belize,  of contraception, being the method selected by 19 per cent of women aged 15 to 49  Other modern contraceptive methods are also popular in certain regions. In Eastern  The  wall  chart  shows  that  universal  access  to  reproductive  health  is  still  far  The availability of estimates of unmet need for family planning is still far from uni- Dominica, Guatemala, Guyana, Haiti, Saint Kitts and Nevis, Saint Lucia, Suriname, and  Africa  and  Southern  Africa,  for  instance,  injectables  are  the  most  popular  methods,  who are married or in a union. Female sterilization is most prevalent in Latin America  from  being  attained  since,  in  at  least  46  countries,  20  per  cent  or  more  of  the  versal. As this chart shows, 107 countries or areas have estimates of unmet need for  Trinidad and Tobago. accounting for over 40 per cent of contraceptive use. and  the  Caribbean.  The  prevalence  level  of  female  sterilization  is  highest—47  per  women of reproductive age who are married or in a union have an unmet need  family planning referring to 1987 or later years. Those countries account for 86 per cent  cent—in the Dominican Republic. In Colombia, El Salvador, Panama and Puerto Rico,  for contraception. Nevertheless, at the global level, contraceptive use continues  of all women of reproductive age who are married or in a union. Countries lacking the  Northern America has the highest level of contraceptive prevalence in the world (78  levels range between 30 per cent and 40 per cent. The prevalence of female steriliza- Traditional  methods,  generally  not  recommended  as  contraceptives  because  of  to increase. In 2009, an estimated 63 per cent of women of reproductive age who  data necessary to estimate the unmet need for family planning are located mainly in the  per cent). Europe as whole has a level of contraceptive prevalence not far below that  tion is over 25 per cent in a few countries in other regions, including China, India and  their lower effectiveness in preventing pregnancy, are still commonly used in Middle  were married or in a union were using a contraceptive method, for a total of 739  more developed regions and include several countries in Europe as well as Australia,  of Northern America (73 per cent), but four of the 36 countries with data in that major  Thailand. Africa, Western Africa and Western Asia, where 65 per cent, 40 per cent and 35 per  million worldwide. Canada, Japan and New Zealand. There are also several countries in Western Asia,  area have levels of contraceptive prevalence below 50 per cent, namely, Bosnia and  cent, respectively, of women of reproductive age who are married or in a union and  the Caribbean, South America and Oceania lacking the required information.  Herzegovina, Montenegro, Serbia and the former Yugoslav Republic of Macedonia.  The IUD, used by 14 per cent of women of reproductive age who are married or in  are currently using a method of contraception rely on a traditional method. In Albania,  Data sources Data on contraceptive prevalence and unmet need for family  a union, is the second most widely used contraceptive method in the world. The IUD  for instance, 84 per cent of contraceptive users rely on withdrawal. planning  at  the  country  level  were  obtained  from  surveys  covering  nationally  Contraceptive prevalence According to the most recent data available, contra- Trends in contraceptive prevalence contrast among development groups. In more  is most commonly used in Asia and its prevalence is highest—over 40 per cent—in  representative samples of women of reproductive age. Detailed data on levels  China, the Democratic People’s Republic of Korea, Uzbekistan and Viet Nam. In addi- Unmet need for family planning The level of unmet need for family planning var- ceptive prevalence among women of reproductive age who are married or in a union  developed  regions,  contraceptive  prevalence  has  been  high  for  many  decades  and  ies from 2 per cent in France to 46 per cent in Samoa. In Africa, nearly half of the 44  and  trends  of  contraceptive  prevalence  and  unmet  need  for  family  planning,  varies between 3 per cent in Chad and 88 per cent in Norway. Globally, contraceptive  its  level  has  changed  little  since  2000.  In  the  less  developed  regions,  contraceptive  tion, levels of IUD use range between 30 per cent and 40 per cent in Israel, Kazakhstan,  Kyrgyzstan and Turkmenistan. The prevalence of IUD use is also high in a few coun- countries with the required data have unmet need levels ranging from 20 per cent to  including  information  on  data  sources,  are  presented  in  World Contraceptive prevalence is estimated at 63 per cent and it is somewhat higher in the more devel- prevalence has increased substantially in the past decade. Among 39 per cent of the  30 per cent of all women of reproductive age who are married or in a union and over  Use 2010. 1  Estimates  for  the  world  and  its  regions  are  weighted  averages  oped  regions  (72  per  cent)  than  in  the  less  developed  regions  (61  per  cent),  but  in  developing  countries  with  data,  contraceptive  prevalence  has  increased  by  more  tries in other regions, including Cuba, Egypt and Estonia. a  quarter  have  unmet  need  levels  of  at  least  30  per  cent.  In  Asia,  Europe  and  Latin  derived  by  weighting  the  indicators  for  each  country,  extrapolated  as  needed  both a high proportion of women of reproductive age who are married or in a union  than half a percentage point per year since 2000 and in 16 per cent of the developing  America and the Caribbean, by contrast, the majority of countries with the necessary  The pill is the third most widely used contraceptive method in the world, with 9 per  to  2009,  by  the  estimated  number  of  women  who,  in  2009,  were  aged  15  to  49  are using contraception. In the majority of the less developed regions contraceptive  countries the increase has averaged at least one percentage point per year. However,  data have unmet need levels below 20 per cent. Thus, 72 per cent of the 25 countries  cent of women aged 15 to 49 who are married or in a union relying on it. Use of the con- and  married  or  in  a  union.  The  estimated  weights  were  derived  from  data  on  prevalence  is  50  per  cent  or  more.  The  major  exceptions  are  sub-Saharan  Africa,  in  61  per  cent  of  the  developing  countries  with  data  the  increase  in  contraceptive  traceptive pill has the widest geographic distribution of any method. The pill’s preva- in Asia, 93 per cent of the 14 in Europe, and 79 per cent of the 19 in Latin America and  the  proportion  of  women  who  were  married  or  in  a  union  in  each  country  as  Melanesia,  Micronesia  and  Polynesia,  where  the  estimated  levels  of  contraceptive  prevalence has been half a percentage point or less per year, and in 26 per cent of the  lence is relatively high, ranging from 30 per cent to 40 per cent, in one country in Asia,  the Caribbean with estimates of unmet need have levels below 20 per cent. In general,  presented  in  World Marriage Data 2008 2   and  from  estimates  of  the  number  prevalence are still below 40 per cent. As a region, sub-Saharan Africa has the lowest  developing countries contraceptive prevalence declined between 2000 and 2009. This  five in Europe and three in Latin America and the Caribbean. Countries with the highest  unmet need for family planning is lowest in countries where contraceptive prevalence  group includes several of the countries whose most recent contraceptive prevalence  prevalence of pill use—over 40 per cent—include Algeria, Belgium, France, Germany,  is already high (above 60 per cent). That is, the unmet need for family planning must be  1  World Contraceptive Use 2010 (United Nations publication, POP/DB/CP/Rev2010).    orld Population Prospects: The 2008 Revision. CD-ROM Edition (United  Nations  publication,  3 W interpreted in light of other indicators of contraceptive prevalence.   2  World Marriage Data 2008 (United Nations publication, POP/DB/Mar/Rev2008). Extended Dataset, Sales No. 09.XII.6).  levels are below 20 per cent, such as Burundi, the Central African Republic and Togo. Morocco, Portugal, Réunion and Zimbabwe. Regarding the share of the pill in overall  Contraceptive prevalence b Contraceptive prevalence b (percentage using contraception among women who are married or in uniona) Need (percentage using contraception among women who are married or in uniona) Need for for Annual change, Annual change, Women family Women family 1997 to 2009 1997 to 2009 aged plan- aged plan- Prevalence of Prevalence of (percentage Prevalence of Prevalence of (percentage 15-49, ning 15-49, ning modern methods traditional methods points) modern methods traditional methods points) married (percent- married (percent- or in Any Sterilization Vaginal Other Any Other Any age with or in Any Sterilization Vaginal Other Any Other Any age with union a, Any modern Male barrier modern traditional With- traditional Any modern unmet union a, Any modern Male barrier modern traditional With- traditional Any modern unmet Country or area Year(s) (thousands) method method Female Male Pill Injectable Implant IUD condom methodsc methodsd method Rhythme drawal methodsf method methods need) g Country or area Year(s) (thousands) method method Female Male Pill Injectable Implant IUD condom methodsc methodsd method Rhythme drawal methodsf method methods need) g WORLD 2009 1,178,863 62.7 56.1 18.9 2.4 8.8 3.5 0.3 14.3 7.6 0.2 0.0 6.6 2.9 3.1 0.6 0.2 0.1 11.2 EUROPE 2009 102,392 72.6 58.7 3.1 2.5 21.4 0.3 0.1 12.4 17.1 1.5 0.1 13.9 5.2 8.0 0.7 0.1 0.5 .. More developed regions 2009 162,540 72.4 61.3 8.2 5.5 18.4 0.6 0.2 9.2 17.8 1.1 0.3 11.0 3.8 6.7 0.5 0.2 0.4 .. Eastern Europe 2009 45,333 74.9 54.3 0.9 0.2 11.6 0.3 0.0 16.3 22.2 2.8 0.0 20.7 9.1 10.4 1.2 0.4 0.9 .. Less developed regions 2009 1,016,322 61.2 55.2 20.6 1.9 7.3 4.0 0.4 15.1 5.9 0.1 0.0 5.9 2.8 2.5 0.6 0.2 0.1 11.4 Belarus 2005/06 1,647 72.6 56.0 2.4 0.0 10.4 0.0 0.0 25.7 17.5 0.0 0.0 16.6 5.5 9.6 1.5 ap 1.3 0.8 .. Least developed countries 2009 142,282 31.4 25.0 3.0 0.5 10.7 7.3 0.5 0.7 2.3 0.0 0.0 6.4 3.4 1.7 1.3 0.4 0.5 24.2 Bulgaria 1997/98 1,276 63.4 i, n 39.6 .. .. 10.7 .. .. 10.6 16.7 1.2 0.4 ad, ae 23.8 .. 19.6 4.2 ar .. .. 29.7 n, aa Other less developed countries 2009 874,041 66.0 60.2 23.5 2.1 6.7 3.4 0.3 17.4 6.5 0.1 0.0 5.9 2.7 2.6 0.5 0.2 0.1 9.3 Czech Republic 1997 1,382 72.0 n 62.6l 7.2 5.1 23.1 .. .. 13.9 12.7 0.7 0.0 9.5 1.7 7.3 0.5 .. .. 10.8 n, o, aa AFRICA 2009 155,541 28.6 22.4 1.6 0.0 7.8 6.4 0.4 4.4 1.8 0.0 0.0 6.2 3.1 1.4 1.8 0.2 0.3 22.7 Hungary 1992/93 1,467 80.6 i, n 71.3 5.0 .. 39.4 .. .. 18.2 8.1 0.6 0.0 9.3 2.6 6.5 0.2 .. .. 7.0 n, o, aa Poland 1991 5,921 72.7 i, n 28.0 0.0 0.0 3.4 .. .. 8.4 13.4 2.8 0.0 44.7 28.4 16.3 0.0 .. .. .. Sub-Saharan Africa 2009 128,163 21.8 15.7 1.6 0.0 4.3 6.8 0.4 0.5 2.0 0.0 0.0 6.2 3.2 1.3 1.7 0.2 0.3 24.9 Republic of Moldova 2005 686 67.8 42.6 4.7 0.0 3.6 .. .. 25.2 7.4 .. 1.7 az 25.2 3.5 19.6 2.2 ap, aq 0.6 0.0 6.7 Northern Africa (excl. Sudan) 2009 27,378 60.5 54.0 1.6 0.0 24.1 4.4 0.3 22.3 1.2 0.1 0.0 6.5 2.5 1.8 2.2 0.2 0.3 9.6 Romania 2004 3,315 70.3 n 38.2 2.8 .. 14.1 .. .. 6.7 12.1 1.8 0.7 32.1 6.6 25.5 0.0 0.6 0.8 11.9 n Russian Federation 2007 22,315 79.5 m, n 65.0 .. .. 14.1 .. .. 20.4 30.3 .. 5.2 af, ah 14.6 14.5 13.6 2.9 ao 0.5 1.0 .. Eastern Africa 2009 46,707 28.4 22.9 1.9 0.0 6.3 11.9 0.9 0.5 1.3 0.0 0.0 5.6 2.6 1.3 1.6 0.8 0.8 27.6 Slovakia 1997 709 79.8 n 65.6 4.7 .. 22.3 .. .. 12.8 25.8 .. 0.0 14.2 .. .. .. .. .. .. Burundi 2005/06 999 9.1 7.5 0.2 0.0 1.8 5.0 0.0 0.1 0.3 0.0 0.0 1.6 1.0 0.2 0.4 -0.7 -0.3 29.0 h, n Ukraine 2007 7,130 66.7 l 47.5 0.6 0.0 4.8 0.0 0.0 17.7 23.8 0.5 0.0 19.1 7.2 10.3 1.6 aq -0.1 0.7 10.3 Comoros 2000 78 25.7 19.3 0.7 0.0 8.3 8.5 0.7 0.4 0.7 0.0 0.0 6.4 2.9 1.2 2.3 ap .. .. 34.6 h Northern Europe 2009 12,693 80.1 77.2 6.1 12.3 22.0 1.2 0.7 11.9 20.9 1.0 1.1 2.9 1.2 1.5 0.1 0.3 0.4 .. Djibouti 2006 94 17.8 17.1 0.4 0.0 13.6 2.5 0.0 0.4 0.2 0.0 0.0 0.7 .. .. .. 1.0 1.3 .. Eritrea 2002 615 8.0 5.1 0.2 0.0 1.4 2.6 0.0 0.4 0.6 0.0 0.0 2.9 0.7 0.1 2.1 ap .. .. 27.0 Denmark 1988 658 78.0 i, n 72.0 5.0 5.0 26.0 .. .. 11.0 22.0 3.0 0.0 6.0 2.0 4.0 0.0 .. .. .. Ethiopia 2005 10,851 14.7 13.7 l 0.2 0.0 3.1 9.9 0.2 0.2 0.2 0.0 0.0 1.0 l 0.6 0.3 0.2 ap 0.7 0.8 33.8 Estonia 1994 186 70.3 i, n, q 56.4 .. .. 3.9 .. .. 35.9 16.1 0.6 0.0 13.8 8.1 4.5 1.2 .. .. .. Kenya 2008/09 5,745 45.5 38.9 4.8 0.0 7.2 21.6 1.9 1.6 1.8 0.0 0.0 6.6 4.7 0.7 1.2 ap, aq 0.7 0.8 25.6 Finland 1989 761 77.4 n 75.4 14.9 ac 1.1 11.3 1.9 .. 25.8 20.1 0.3 0.0 2.1 0.7 0.6 0.8 .. .. .. Madagascar 2008/09 2,914 39.9 28.2 1.1 0.1 6.0 17.9 1.5 0.4 1.1 0.0 0.0 11.7 9.7 0.8 1.2 ap, aq 2.3 1.8 18.9 Ireland 2004/05 504 64.8 m, n 61.4 .. .. 17.2 .. .. 8.4 23.3 0.1 12.4 au 5.4 3.3 2.1 0.0 -1.2 -0.6 .. Malawi 2006 2,182 41.0 38.4 4.4 0.1 2.4 29.0 0.7 0.3 1.5 0.1 0.0 2.6 0.7 0.8 1.0 ap 1.2 1.4 27.6 h Latvia 1995 266 67.8 i, n 55.5 .. 2.1 11.3 0.1 .. 28.0 13.6 0.4 0.0 12.3 7.1 4.5 0.7 .. .. 16.8 n, o, aa Mauritius 2002 219 75.8 i 39.3 8.9 0.1 16.0 3.7 0.1 1.4 8.9 0.2 0.0 36.5 10.1 26.4 0.0 0.0 -0.3 3.5 n Lithuania 1994/95 582 50.7 i, n 33.2 .. .. 3.6 0.2 .. 15.2 14.2 0.0 0.0 17.5 10.1 6.5 0.9 .. .. 18.0 n, o, aa Mozambique 2003/04 3,431 16.5 11.8 0.9 0.0 4.9 4.8 .. 0.1 1.1 0.0 0.0 4.7 3.1 0.2 1.4 aq 0.7 0.4 18.4 Norway 2005 573 88.4 n 82.2 7.7 .. 31.0 .. 3.3 23.3 12.8 4.1 0.0 6.3 ar, as .. .. .. 0.2 0.3 .. Réunion 1997 85 66.6 l, n 63.5 3.2 0.0 42.6 0.0 0.0 13.0 3.2 0.2 1.3 i 3.1 1.5 1.6 0.0 .. .. .. Sweden 1996 1,068 75.2 n, p 64.8 .. .. 27.4 0.0 0.0 16.2 16.4 0.7 4.1 ad, ae 10.4 2.6 7.8 0.0 .. .. .. Rwanda 2007/08 1,194 36.4 26.1 0.7 0.1 6.4 15.2 1.6 0.2 1.9 0.0 0.0 10.3 6.3 3.0 1.0 ap, aq 2.6 2.4 37.9 h United Kingdom 2008/09 8,188 84.0 m, n, y 84.0 8.0 21.0 28.0 2.0 1.0 10.0 27.0 1.0 2.0 ak 8.0 2.0 6.0 0.0 0.4 0.4 .. Somalia 2005/06 1,246 14.6 1.2 0.0 0.0 0.8 0.2 0.0 0.1 0.0 0.0 0.0 13.4 0.4 0.3 12.8 ap 0.6 0.0 .. Southern Europe 2009 21,451 63.8 46.3 4.6 2.4 16.1 0.1 0.0 5.7 17.0 0.2 0.0 17.6 2.5 14.4 0.7 -0.3 -0.1 11.8 Uganda 2006 3,834 23.7 17.9 2.4 0.1 2.9 10.2 0.3 0.2 1.7 0.0 0.0 5.8 2.8 2.1 0.9 aq 0.2 0.5 40.6 Albania 2008/09 580 69.3 10.2 3.0 .. 1.6 0.7 .. 0.9 4.0 .. 0.1 av 59.1 0.8 57.9 0.4 ap 1.3 -0.6 12.8 United Republic of Tanzania 2010 6,827 34.4 j 26.1 l 3.5 0.0 6.7 10.6 2.3 0.6 2.3 0.0 0.0 8.3 l 3.1 2.9 2.2 ap 0.8 0.7 21.8 h Bosnia and Herzegovina 2005/06 604 35.7 11.2 0.1 0.0 3.4 0.0 0.0 3.6 4.1 0.0 0.1 ai 24.5 2.7 21.4 0.4 ap -1.3 -0.5 .. Zambia 2007 1,662 40.8 26.5 l 1.9 0.0 11.0 8.5 0.4 0.1 4.7 0.0 0.1 ai 14.3 1.2 5.6 7.5 ap, aq 1.6 0.8 26.5 Greece 2001 1,548 76.2 n 45.9 .. .. 4.8 .. .. 3.6 33.9 .. 3.6 i 30.3 .. 28.8 1.5 i 0.8 0.9 .. Zimbabwe 2005/06 1,775 60.2 57.9 2.0 0.1 43.0 9.9 1.2 0.3 1.4 0.0 0.0 2.3 0.2 1.2 0.9 ap, aq 0.6 0.7 12.8 Italy 1995/96 7,357 62.7 i, n 40.6 6.0 ac 0.1 14.2 0.1 .. 5.8 14.2 0.2 0.0 22.1 3.7 18.2 0.2 .. .. 11.8 n, o, aa Middle Africa 2009 19,429 18.6 6.6 0.5 0.0 1.5 0.9 0.2 0.2 3.3 0.0 0.0 12.0 8.9 1.8 1.3 -0.6 0.1 22.6 Malta 1993 58 85.8 m, n 46.0 2.2 2.2 15.8 .. .. 2.9 21.9 1.0 0.0 .. 19.4 40.6 8.1 am .. .. .. Angola 2001 2,443 6.2 4.5 0.1 0.0 2.2 1.4 0.0 0.4 0.3 0.1 0.1 ai 1.7 1.2 0.1 0.4 ap .. .. .. Montenegro 2005/06 88 39.4 17.2l 0.1 0.0 2.4 0.0 0.0 9.7 4.3 0.5 0.1 ai 22.2 l 3.9 17.7 0.5 ap -1.5 0.2 .. Cameroon 2006 2,971 29.2 12.0 0.4 0.0 1.9 2.3 0.6 0.3 6.5 0.0 0.1 ai 17.2 13.1 0.6 3.5 ap 0.4 0.3 20.2 h Portugal 2005/06 1,693 86.8 l, n 82.5 5.1 .. 58.9 .. .. 7.3 11.2 .. .. 5.6 2.1 3.5 .. 0.6 0.8 .. Central African Republic 2006 691 19.0 8.6 0.3 0.1 4.4 0.2 0.0 0.1 3.5 0.0 0.0 10.5 6.8 0.4 3.3 ap -1.0 0.2 16.2 h Serbia 2005 1,403 41.2 18.6 0.2 0.0 3.4 0.0 0.0 6.0 8.4 0.4 0.2 ai 22.6 8.0 14.0 0.5 ap -1.9 -1.5 .. Chad 2004 1,651 2.8 1.7 0.2 .. 0.5 0.5 .. 0.0 0.4 .. 0.1 av 1.1 1.1 0.0 0.0 -0.6 0.0 20.7 Slovenia 1994/95 271 78.9 i, n 63.2 6.0 0.1 23.2 0.3 .. 22.9 8.1 2.6 0.0 15.7 7.5 8.0 0.2 .. .. 9.2 n, o, aa Congo 2005 458 44.3 12.7 0.2 .. 2.3 1.0 .. 0.1 8.9 .. 0.1 av 31.6 23.8 5.3 2.5 ap .. .. 16.2 Spain 2006 6,015 65.7 62.3 5.6 7.9 17.2 0.2 .. 6.4 24.8 0.2 0.0 3.5 0.3 1.9 1.3 -0.6 -0.4 11.8 h Dem. Rep. of the Congo 2007 8,898 20.6 5.8 l 0.8 .. 1.0 0.4 .. 0.2 3.4 .. 0.1 av 14.9 11.0 3.1 0.8 aq -1.2 0.2 24.4 TFYR Macedonia 2005/06 305 13.5 9.8 0.7 .. 2.5 .. .. 0.4 4.5 1.4 0.3 aw 3.7 0.5 0.7 2.6 ap -0.6 0.1 .. Equatorial Guinea 2000 82 10.1 6.1 0.5 0.1 1.5 2.3 0.1 0.7 0.4 0.3 0.2 ai 4.0 2.0 0.6 1.4 ap .. .. .. Western Europe 2009 22,915 71.9 68.6 4.6 1.7 45.5 0.0 0.0 11.4 4.8 0.6 0.0 3.2 2.1 0.8 0.3 -0.4 -0.2 .. Gabon 2000 166 32.7 11.8 1.0 .. 4.8 0.5 .. .. 5.1 .. 0.3 ag, ax 21.0 15.8 1.8 3.4 ap, aq .. .. 28.0 Austria 1995/96 1,092 50.9 i, n 46.8 .. 0.5 30.8 0.3 .. 7.3 7.2 0.7 0.0 4.1 2.5 0.7 0.9 .. .. .. Sao Tome and Principe 2008/09 22 38.4 33.1 l 1.2 0.0 15.1 11.5 0.0 0.4 5.0 0.1 0.0 5.3 2.8 1.2 1.3 ap, aq 1.0 0.6 37.2 Belgium 2004 1,207 74.6 l, n, s 72.9 .. .. 44.8 .. .. 9.7 .. .. 18.4 bb 1.5 ar, as .. .. .. -0.1 -0.1 3.4 h, n, o, v, aa Northern Africa 2009 33,849 50.4 44.8 1.4 0.0 20.3 3.6 0.2 18.1 1.1 0.1 0.0 5.6 2.0 1.5 2.1 0.2 0.2 13.5 France 2004/05 7,320 76.6 74.8 .. .. 41.5 .. .. 22.7 6.8 0.6 3.2 ac, au 1.7 0.3 1.0 0.4 -0.6 -0.2 1.7 aa Algeria 2006 5,236 61.4 52.0 1.1 .. 45.9 .. .. 2.3 2.3 .. 0.3 ah, aw 9.4 4.1 3.3 2.0 an -0.3 0.2 .. Germany 1992 9,835 70.1 n 65.6 5.5 0.5 52.6 0.0 .. 5.3 1.1 0.6 0.0 4.5 3.7 0.5 0.3 .. .. .. Egypt 2008 13,828 60.3 57.6 1.0 0.0 11.9 7.4 0.5 36.1 0.7 0.0 0.0 2.7 0.4 0.2 2.0 an 0.5 0.4 9.2 Netherlands 2008 2,196 69.0 n 67.0 3.0 7.0 40.0 .. .. 8.0 9.0 .. 0.0 2.0 .. .. .. 0.0 -0.1 .. Libyan Arab Jamahiriya 1995 475 45.2 25.7 .. .. 9.6 .. .. 11.2 .. .. 4.9 ay 19.6 bc .. .. .. .. .. .. Switzerland 1994/95 1,029 82.0 n 77.5 13.8 ac 8.3 34.1 0.3 .. 6.0 14.2 0.9 0.0 4.5 2.3 2.2 0.0 .. .. .. Morocco 2003/04 4,432 63.0 52.0 2.7 0.0 40.1 2.1 0.0 5.4 1.5 0.1 0.0 11.0 3.8 4.4 2.9 ap, aq 0.3 0.2 10.0 LATIN AMERICA AND THE CARIBBEAN 2009 93,724 72.9 67.0 25.9 2.3 16.4 5.4 0.1 7.0 9.6 0.3 0.0 6.0 3.0 2.6 0.4 0.2 0.4 9.9 Sudan 2006 5,931 7.6 5.7 0.3 0.0 4.3 0.5 .. 0.3 0.3 0.0 0.0 1.9 0.2 0.1 1.6 ap 0.1 0.0 26.0 h, x Tunisia 2006 1,614 60.2 51.5 5.6 .. 14.5 1.4 0.3 27.8 1.3 0.3 0.3 i 8.7 i 8.0 0.6 0.1 -0.6 -0.6 12.1 h Caribbean 2009 6,506 61.6 57.0 22.5 0.4 9.2 5.1 0.6 11.3 7.7 0.1 0.1 4.7 1.8 1.9 0.9 0.2 0.1 20.3 Southern Africa 2009 5,890 58.4 58.1 13.0 0.6 11.0 26.9 0.0 1.1 5.5 0.0 0.0 0.3 0.0 0.1 0.2 0.4 0.5 15.5 Anguilla 2003 1 43.0 l, n, r 40.8 2.6 0.0 17.6 1.7 0.0 2.6 15.0 0.4 0.9 2.6 0.9 1.7 0.0 .. .. .. Antigua and Barbuda 1988 9 52.6 n 50.6 11.4 0.0 26.2 3.2 .. 1.1 5.5 3.2 0.0 2.0 0.5 1.1 0.4 .. .. .. Botswana 2000 159 44.4 42.1 1.2 0.2 14.3 8.1 0.4 1.7 15.5 0.1 0.6 2.3 0.2 0.0 2.1 am .. .. 26.9 h Bahamas 1988 24 61.7 n 60.1 16.4 0.0 31.5 4.8 .. 3.7 2.3 1.4 0.0 1.6 ar, as .. .. .. .. .. .. Lesotho 2009 281 47.0 j 45.6 2.4 0.0 12.5 19.3 0.1 1.9 9.4 0.0 0.1 1.4 0.1 0.7 0.6 1.8 1.8 31.0 h Barbados 1988 38 55.0 n 53.3 10.0 0.3 27.0 0.9 .. 5.2 7.4 2.6 0.0 1.7 0.7 1.0 0.0 .. .. .. Namibia 2006/07 191 55.1 53.5 10.3 0.4 8.6 21.8 0.2 1.4 10.6 0.1 0.1 ai 1.6 0.4 0.3 0.9 aq 1.3 1.2 20.6 Cuba 2006 1,928 72.6 71.6 19.0 0.0 5.5 0.9 0.1 35.2 10.6 0.1 0.2 ai 1.0 0.5 0.3 0.2 ap -0.1 -0.1 .. South Africa 2003/04 4,864 59.9 59.8 14.3 0.7 10.9 28.4 0.0 1.0 4.6 0.0 0.0 0.0 0.0 0.0 0.0 ap 0.3 0.3 13.8 Dominica 1987 8 49.8 n 47.9 11.9 0.0 17.2 11.2 .. 1.6 6.0 0.0 0.0 1.9 ar, as .. .. .. .. .. .. Swaziland 2006/07 118 50.6 46.8 5.8 0.2 9.9 17.2 0.1 1.4 12.2 0.0 0.1 ai 3.8 0.3 2.2 1.3 ap, aq 2.5 2.3 24.0 Dominican Republic 2007 1,579 72.9 69.5 47.4 0.0 13.4 4.2 0.6 2.1 1.9 .. 0.0 3.4 1.3 1.5 0.6 ap, aq 0.9 0.8 11.4 Western Africa 2009 49,666 14.4 8.7 0.4 0.0 2.7 2.8 0.2 0.7 1.9 0.0 0.0 5.7 2.2 1.3 2.2 0.0 0.1 24.2 Grenada 1990 10 54.3 n 52.1 1.0 0.0 15.1 9.0 .. 3.0 21.9 2.1 0.0 2.1 i .. .. .. .. .. .. Benin 2006 1,318 17.0 5.9 l 0.3 0.0 1.5 1.8 0.5 0.6 1.1 0.0 0.0 11.1 l 6.9 3.6 0.5 ap, aq -0.1 0.0 29.9 Haiti 2005/06 1,479 32.0 23.6 2.1 .. 3.3 11.0 1.6 .. 5.3 .. 0.2 ax 8.4 2.4 4.2 1.8 ap, aq 0.4 0.1 37.5 Burkina Faso 2006 2,553 17.4 13.3 0.1 0.0 4.6 5.0 2.0 0.1 1.4 0.1 0.0 4.1 2.9 0.1 1.1 ap 0.6 0.8 28.8 h Jamaica 2002/03 365 69.0 66.2 12.0 0.0 18.0 11.0 0.0 1.0 24.0 0.0 0.2 ak 2.8 0.0 2.0 0.8 0.2 0.2 11.7 n Cape Verde 2005 55 61.3 57.1 14.8 .. 21.4 11.3 .. 2.2 6.1 .. 1.3 av 4.2 1.9 2.2 0.1 ap 0.7 0.9 16.7 Montserrat 1984 1 52.6 n 52.2 .. .. 30.6 3.2 0.0 11.0 3.4 2.4 1.6 ad, ae 0.3 ar, as .. .. .. .. .. .. Côte d’Ivoire 2006 2,823 12.9 8.0 .. .. 5.5 1.1 .. .. 1.0 .. 0.5 at 4.9 3.0 .. 1.9 ap -0.2 0.1 27.7 h Puerto Rico 2002 532 84.1 n 72.2 38.5 5.3 15.5 2.7 0.0 1.2 8.8 0.2 0.0 12.0 8.2 2.1 1.7 i 0.2 0.2 4.0 h, n Gambia 2001 240 17.5 l 12.7 0.7 .. 6.5 3.5 .. 1.4 0.5 0.1 0.0 2.4 2.1 0.2 0.1 aq 0.1 0.1 .. Saint Kitts and Nevis 1984 2 40.6 n 37.0 .. .. 19.7 2.3 0.0 3.8 5.6 3.0 2.6 ad, ae 3.6 ar, as .. .. .. .. .. .. Ghana 2008 3,530 23.5 16.6 l 1.6 0.0 4.7 6.2 0.9 0.2 2.4 0.3 0.1 ai 6.9 4.7 1.4 0.8 aq 0.1 0.2 35.3 Saint Lucia 1988 15 47.3 n 45.9 7.7 0.0 18.5 7.5 .. 4.6 5.9 1.7 0.0 1.4 ar, as .. .. .. .. .. .. Guinea 2005 1,610 9.1 4.0 0.2 0.0 1.6 1.0 0.0 0.1 1.1 0.0 0.0 5.1 1.0 0.0 4.1 ap 0.3 0.0 21.2 Saint Vincent and the Grenadines 1988 13 58.3 n 55.9 13.4 .. 24.5 6.8 0.0 2.6 7.5 .. 1.1 ad, ah 2.4 am, ar .. 1.7 .. .. .. .. Guinea-Bissau 2006 229 10.3 6.1 0.3 0.0 1.3 0.7 0.1 2.9 0.7 0.0 0.1 ai 4.2 0.3 0.0 3.9 ap 0.3 0.3 .. Trinidad and Tobago 2006 210 42.5 37.7 8.4 0.1 10.9 2.4 0.3 2.5 13.0 0.1 0.0 4.8 1.7 1.8 1.4 ap 0.5 0.5 16.1 h Liberia 2007 579 11.4 10.3 0.6 0.0 3.8 4.1 0.0 0.2 1.6 .. 0.0 1.2 1.0 0.2 0.0 0.2 0.2 35.6 United States Virgin Islands 2002 11 78.4 n 72.6 19.2 2.1 18.8 5.2 0.0 1.4 25.3 0.5 0.0 5.8 3.7 0.5 1.6 .. .. .. Mali 2006 2,447 8.2 6.3 0.3 0.0 2.9 2.5 0.1 0.1 0.4 0.0 0.0 1.9 0.8 0.0 1.1 ap, aq 0.0 0.1 31.2 Central America 2009 25,032 68.2 63.0 33.7 0.7 5.9 6.9 0.0 9.6 5.7 0.3 0.0 5.2 2.6 2.1 0.5 0.0 0.3 13.2 Mauritania 2007 460 9.3 8.0 0.1 0.0 5.7 1.0 0.0 0.3 0.4 0.1 0.4 i 1.3 0.2 i 1.0 0.1 i, ap 0.2 0.4 31.6 h Belize 2006 48 34.3 31.2 8.9 0.1 10.8 5.0 0.1 2.1 4.1 0.1 0.0 3.2 1.7 0.3 1.2 ap -2.1 -1.7 20.8 h, n Niger 2006 2,511 11.2 5.0 0.3 0.0 3.0 1.5 0.0 0.1 0.0 0.0 0.0 6.2 0.1 0.0 6.1 ap, aq -0.3 0.1 15.8 Costa Rica 1999 504 80.0 n 71.5 21.4 0.5 25.6 5.9 0.0 6.9 10.9 0.3 0.0 8.5 6.5 1.8 0.2 .. .. 5.0 h, n Nigeria 2008 24,943 14.6 8.1 0.4 0.0 1.7 2.6 0.0 1.0 2.4 0.0 0.0 6.5 2.1 2.0 2.5 ap, aq .. .. 20.2 El Salvador 2008 866 72.5 n 65.9 32.1 0.3 5.5 22.5 0.1 0.8 4.6 .. 0.0 6.6 3.7 2.6 0.3 ap 1.1 1.0 8.9 h, n Senegal 2005 1,833 11.8 10.0 0.5 0.0 3.6 3.2 0.6 0.5 1.5 0.1 0.0 1.8 0.6 0.1 1.1 ap, aq 0.1 0.2 31.6 Guatemala 2002 1,800 43.3 34.4l 16.8 1.0 3.4 9.0 0.1 1.9 2.3 0.1 0.0 8.8 6.3 2.3 0.2 ap, aq 0.4 0.3 27.6 Sierra Leone 2008 951 8.2 6.0 0.0 0.0 2.3 2.9 0.0 0.2 0.6 0.0 0.0 2.1 0.2 0.0 1.9 ap, aq 0.4 0.2 27.6 Honduras 2005/06 1,025 65.2 56.1 21.2 0.3 11.3 13.8 0.0 6.6 2.9 0.0 0.0 9.1 3.1 5.8 0.2 ap 0.6 0.8 16.9 Togo 2006 989 16.8 11.1 0.3 0.0 2.0 3.3 1.0 0.4 3.8 0.1 0.1 ai 5.7 4.9 0.3 0.5 ap -1.0 0.2 32.3 h Mexico 2006 17,910 70.9 66.5 .. .. 4.7 5.0 .. 11.6 6.4 0.4 38.4 ad, ae 4.4 .. .. .. -0.1 0.2 12.0 n ASIA 2009 780,102 66.2 60.2 23.4 2.2 6.0 3.2 0.4 17.9 6.9 0.1 0.0 6.0 2.7 2.8 0.4 0.2 0.1 9.3 Nicaragua 2006/07 847 72.4 68.8 24.3 0.4 13.5 23.4 0.0 3.4 3.8 0.0 0.0 3.7 1.7 1.0 1.0 ap 0.7 0.8 7.5 n Panama 1984/85 302 58.2 n 54.2 32.4 0.4 11.8 0.8 .. 6.0 1.6 1.2 0.0 4.0 2.3 1.4 0.3 .. .. .. Central Asia 2009 11,607 56.8 51.5 1.4 0.1 3.6 1.6 0.0 41.5 3.0 0.2 0.1 5.3 1.4 1.2 2.7 -0.6 -0.2 11.8 South America 2009 62,186 76.1 69.6 23.1 3.1 21.4 4.8 0.1 5.5 11.4 0.2 0.0 6.4 3.2 2.9 0.3 0.3 0.5 7.5 Kazakhstan 2006 2,876 50.7 48.7 0.5 0.0 6.7 0.3 0.0 36.2 4.8 0.1 0.1 ai 2.0 0.5 0.4 1.1 ap -1.5 -0.4 8.7 h Kyrgyzstan 2005/06 892 47.8 45.5 0.9 0.0 5.1 1.2 0.0 32.0 5.8 0.3 0.1 ai 2.3 0.7 0.5 1.1 ap -0.9 -0.2 11.6 h Argentina 2001 5,059 65.3 m, n 63.8 .. .. 30.4 .. .. 9.5 22.3 1.6 0.0 13.3 9.1 .. 4.2 .. .. .. Tajikistan 2007 1,146 37.1 31.7 .. .. 2.6 0.7 0.0 25.9 1.3 0.9 0.3 ad, ae 5.5 1.9 0.7 2.9 am, ao 0.4 0.5 .. Bolivia (Plurinational State of) 2008 1,460 60.5 33.8 6.5 0.1 3.3 11.3 0.0 8.4 4.0 0.1 0.0 26.7 20.8 4.9 1.0 ap, aq 0.8 0.7 20.2 Turkmenistan 2000 748 61.8 45.2 1.8 0.0 1.2 1.0 0.0 39.0 2.0 0.0 0.2 i 16.6 2.1 5.3 9.2 ap .. .. 10.1 Brazil 2006 32,774 80.3 77.1 29.1 5.1 24.7 4.0 0.1 1.9 12.2 0.0 0.0 3.2 1.1 2.1 0.0 0.2 0.5 6.0 Uzbekistan 2006 5,275 64.9 59.3 2.1 0.1 2.3 2.7 0.1 49.7 2.1 0.1 0.1 ai 5.6 1.7 1.1 2.8 ap -0.3 -0.4 13.7 h Chile 2006 2,358 64.2 n, o, ab .. 7.1 .. 29.1 .. .. 18.9 9.1 .. .. .. .. .. .. 0.4 0.7 .. Colombia 2004/05 6,194 78.2 67.6 31.2 1.8 9.7 5.8 0.3 11.2 7.1 0.5 0.0 10.6 3.8 5.7 1.2 ap, aq 0.1 0.5 5.8 Eastern Asia 2009 298,614 82.8 81.3 26.4 4.6 1.3 0.1 0.4 37.8 10.6 0.2 0.0 1.4 0.7 0.7 0.1 -0.2 -0.2 2.3 Ecuador 2004 1,988 72.7 58.7 24.2 0.0 13.3 5.9 0.0 10.1 4.3 0.2 0.7 14.0 7.5 5.7 0.8 0.6 0.6 7.4 n China 2006 263,886 84.6 84.0 28.7 4.5 1.2 0.0 0.3 40.6 8.5 0.2 0.0 0.6 0.3 0.3 .. -0.2 -0.2 2.3 h, n Guyana 2009 133 42.5 j 39.8 5.3 0.0 9.2 4.8 0.2 7.3 12.9 0.0 0.0 2.7 0.7 1.4 0.6 ap, aq 0.6 0.4 .. China, Hong Kong SAR 2007 1,074 79.5 75.4 7.1 0.6 6.7 1.2 .. 9.3 50.3 0.2 0.0 4.1 2.3 1.8 0.0 -0.7 -0.6 .. Paraguay 2008 896 79.4 n 70.1l 9.9 0.2 18.0 16.5 .. 12.3 13.2 0.1 0.0 9.3 l 4.5 4.3 0.6 ap 1.5 2.0 4.7 n Dem. People’s Rep. of Korea 2002 3,275 68.6 58.2 4.4 0.8 3.7 0.0 0.0 42.8 5.8 0.7 i 0.0 10.4 ar, as .. .. .. 0.1 0.1 .. Peru 2009 4,176 73.2 l 49.9l 9.4 0.4 7.6 18.1 0.0 3.8 10.0 0.3 0.0 23.3 15.6 6.5 1.2 ap, aq 0.5 0.0 7.2 Japan 2005 14,500 54.3 m, n 44.4 1.5 0.4 1.0 .. .. 0.9 40.7 .. 0.0 16.8 3.4 11.8 1.6 -0.2 -0.4 .. Suriname 2006 83 45.6 45.0 9.1 0.1 27.3 3.1 0.0 1.5 3.9 0.0 0.0 0.6 0.3 0.1 0.2 0.4 0.5 .. Mongolia 2005 453 66.0 60.6 2.4 0.1 11.5 11.1 0.8 28.9 5.3 0.2 0.3 ai 5.4 4.7 0.1 0.7 ap -0.2 0.7 4.6 h, n Uruguay 2004 484 77.0 n, o, p 74.8k 5.4 0.8 23.9 .. .. 12.3 30.8 .. 1.6 af, ah 2.2 k 1.5 0.7 0.0 -0.1 0.1 .. Republic of Korea 2009 7,679 80.0 n 70.1 k 5.9 16.8 2.0 .. .. 12.8 24.3 0.9 7.4 ai 9.9 9.9 .. .. 0.1 0.2 .. Venezuela (Bolivarian Rep. of) 1998 3,260 70.3 61.7 .. .. 21.1 .. .. 9.5 3.4 .. 27.7 ad, ae 8.6 3.6 4.5 0.5 .. .. 18.9 n Southern Asia 2009 326,149 53.9 45.8 28.9 1.0 6.9 1.6 0.1 2.0 5.1 0.0 0.0 8.1 4.4 3.3 0.4 0.8 0.6 14.6 NORTHERN AMERICA 2009 42,569 78.1 72.9 22.3 13.7 16.8 1.4 0.6 4.8 12.0 0.5 0.8 5.2 1.1 4.2 0.0 0.4 0.4 6.6 Afghanistan 2006 4,522 18.6 m, n 15.5 0.7 .. 8.1 5.4 .. 1.0 2.2 .. 0.0 4.3 0.5 0.6 3.2 ap 2.0 1.3 .. Canada 2002 4,460 74.0 m, n 72.0 11.0 aj 22.0 21.0 1.0 .. 1.0 15.0 1.0 0.0 9.0 3.0 6.0 0.0 -0.3 -0.1 .. Bangladesh 2007 34,086 55.8 47.5 l 5.0 0.7 28.5 7.0 0.7 0.9 4.5 .. 0.0 8.3 4.9 2.9 0.6 0.2 0.5 16.8 United States of America 2006/08 38,147 78.6 n 73.0 23.6 12.7 16.3 1.4 0.7 5.3 11.7 .. 1.3 ba 5.6 1.2 4.5 0.0 0.5 0.5 6.6 n Bhutan 2000 82 30.7 30.7 3.1 13.6 3.4 5.9 0.0 3.4 1.2 .. 0.0 .. .. .. .. .. .. .. India 2005/06 219,989 56.3 48.5 l 37.3 1.0 3.1 0.1 0.0 1.7 5.2 0.0 0.0 7.8 l 4.9 2.5 0.3 aq 1.0 0.7 12.8 OCEANIA 2009 4,534 59.8 56.7 13.9 9.8 17.3 3.7 0.5 1.1 9.8 0.5 0.1 3.1 1.5 0.5 1.1 0.1 0.1 .. Iran (Islamic Republic of) 2002 12,016 73.3 n 58.9 15.2 2.3 25.1 2.3 0.4 7.6 6.0 .. 0.0 14.3 1.7 11.4 1.2 -0.1 0.3 .. Australia/New Zealand 2009 2,996 71.6 71.1 15.4 14.6 22.8 1.2 0.6 1.3 14.2 0.8 0.1 0.5 0.3 0.2 0.0 0.1 0.2 .. Maldives 2009 57 34.7 j 27.0 10.1 0.5 4.6 1.2 0.5 0.8 9.3 0.0 0.0 7.8 3.4 4.2 0.1 aq -0.7 -0.7 .. Australia 2001/02 2,306 70.8 m, n 70.8 15.9 13.7 23.8 1.1 0.8 0.8 15.2 0.8 0.1 ai 6.3 3.1 3.2 0.0 ao 0.1 0.2 .. Nepal 2006 5,457 48.0 44.2 18.0 6.3 3.5 10.1 0.8 0.7 4.8 0.0 0.0 3.7 1.2 2.6 0.0 aq 1.2 0.8 24.6 New Zealand 1995 549 75.0 i, n 72.3 14.6 19.5 20.7 1.8 .. 3.4 11.5 0.8 0.0 2.7 1.6 1.0 0.1 am .. .. .. Pakistan 2007/08 27,475 27.0 19.3 6.5 .. 1.9 2.7 .. 2.5 5.4 .. 0.3 i, ad, ag 7.7 1.4 6.0 0.3 i .. .. 24.9 h Sri Lanka 2006/07 3,447 68.0 j, z 52.7 16.9 0.7 7.9 15.0 0.3 6.3 5.5 0.0 0.0 15.3 9.6 5.5 0.2 ap, aq -0.2 0.3 7.3 z Melanesia/Micronesia/Polynesia 2009 1,538 36.7 28.6 11.1 0.3 6.6 8.6 0.1 0.7 1.3 0.0 0.0 8.0 3.7 1.1 3.2 0.6 0.5 .. South-Eastern Asia 2009 106,793 62.2 54.7 7.2 0.3 15.6 17.7 1.3 9.9 2.8 0.0 0.0 7.5 3.3 3.3 0.8 0.6 0.6 11.0 Cook Islands 1999 2 43.2 n 38.2 4.4 i 0.6i 15.2 16.3 .. 1.4 0.3 0.0 0.0 4.9 0.3 1.1 3.5 .. .. .. Guam 2002 24 66.6 n 58.3 18.2 3.9 24.0 4.6 0.0 0.7 6.9 0.0 0.0 8.3 2.5 2.1 i 3.7 i .. .. .. Cambodia 2005 2,126 40.0 27.1 l 1.7 0.1 12.6 7.9 0.2 1.8 2.9 0.0 0.0 12.9 l 4.5 8.3 0.2 ap, aq 1.8 1.0 25.1 Kiribati 2000 10 36.1 n 31.1 1.4 1.0 6.5 14.4 6.3 0.9 0.4 0.1 0.0 5.0 2.9 1.0 1.1 .. .. .. Indonesia 2007 45,382 61.4 57.4 l 3.0 0.2 13.2 31.8 2.8 4.9 1.3 0.0 0.0 4.0 1.5 2.1 0.4 ap, aq 0.7 0.4 9.1 Marshall Islands 2007 9 44.6 42.4 25.0 0.2 2.7 9.2 3.8 .. 1.4 .. 0.0 2.2 1.4 0.6 0.2 aq 0.6 0.8 8.1 Lao People’s Dem. Republic 2000 822 32.2 28.9 l 4.7 0.0 12.9 7.6 0.1 3.0 0.5 0.0 0.0 3.2 2.2 0.7 0.3 aq 0.6 0.6 27.0 h Nauru 2007 1 35.6 j 23.0 13.3 0.2 0.6 2.3 .. 3.8 2.8 .. 0.0 12.6 4.7 4.5 3.3 ap, aq .. .. .. Malaysia 1994 3,021 54.5 w 29.8 .. .. 13.4 .. .. 3.9 5.3 .. 7.2 ad, ae 24.6 8.8 6.9 8.9 am .. .. .. Palau 2003 3 32.8 n 29.7 1.3 0.0 16.9 4.4 5.6 0.9 0.6 0.0 0.0 3.1 0.6 0.0 2.5 .. .. .. Myanmar 2007 8,114 41.0 38.4 4.4 1.0 10.8 19.7 .. 1.8 0.7 0.0 0.0 2.6 1.2 0.7 0.6 0.6 0.7 19.1 h, n Papua New Guinea 2006 1,115 35.7 .. .. .. .. .. .. .. .. .. .. .. .. .. .. 0.7 0.5 .. Philippines 2008 14,573 50.7 33.6 l 9.2 0.0 15.7 2.6 0.0 3.7 2.3 0.0 0.0 17.1 l 6.4 9.8 0.8 ap, aq 0.4 0.2 22.3 Samoa 2009 21 28.7 26.6 6.7 0.0 5.8 13.7 0.0 0.2 0.2 0.0 0.0 2.1 1.2 0.6 0.3 ap, aq 0.4 0.3 45.6 Singapore 1997 644 62.0 n 55.0 .. .. 10.0 .. .. 5.0 22.0 .. 18.0 ad, ae 7.0 ar, as .. .. .. .. .. .. Solomon Islands 2006/07 81 34.6 27.3 13.3 0.3 1.3 8.8 0.0 2.1 1.5 0.0 0.0 7.3 4.7 2.2 0.4 ap, aq .. .. 11.1 Thailand 2006 12,104 81.1 79.8 26.6 0.9 36.7 12.4 0.8 1.2 1.2 0.0 0.0 1.3 0.9 .. 0.4 0.5 0.6 3.1 n Tuvalu 2007 2 30.5 22.4 8.5 0.0 2.2 8.4 1.5 1.3 0.5 0.0 0.0 8.1 5.9 1.2 1.0 aq .. .. 24.2 Timor-Leste 2009/10 149 22.3 j 20.8 0.8 0.0 1.7 15.9 0.8 1.3 0.2 0.0 0.0 1.6 0.9 0.4 0.3 ap 1.0 0.9 3.8 h Vanuatu 2007 36 38.4 36.8 5.8 0.3 15.7 10.6 0.2 2.5 1.1 0.4 0.2 ai 1.6 0.8 0.2 0.6 ap 0.0 0.3 .. Viet Nam 2007 15,494 79.0 68.2 4.4 0.3 10.4 0.9 0.1 43.7 8.3 0.0 0.0 10.8 7.2 3.3 0.3 0.6 1.5 4.8 h Western Asia 2009 36,939 55.1 35.8 4.4 0.1 8.9 1.2 0.0 14.2 6.8 0.2 0.0 19.3 2.3 14.5 2.5 0.5 0.6 13.5 Armenia 2005 549 53.1 19.1 0.6 0.0 0.8 0.0 0.0 9.4 8.1 0.2 0.0 34.0 3.8 27.7 2.5 ap, aq -0.8 -0.1 13.3 Azerbaijan 2006 1,589 51.1 13.2 0.4 0.0 1.1 0.0 0.0 9.2 2.2 0.2 0.0 37.9 4.0 32.5 1.4 ap -0.4 -0.3 22.7 Percentage of women using some method of contraception among those aged 15-49 Bahrain 1995 75 61.8 t 30.6 6.2 .. 10.9 0.0 .. 2.9 9.6 0.0 1.1 ad 31.2 3.2 26.3 1.7 an .. .. .. who are married or in a union: most recent data available Georgia 2005 636 47.3 n 26.6 2.2 0.0 3.2 0.0 .. 11.6 8.7 0.9 0.0 20.7 9.5 11.2 0.0 0.8 0.8 16.3 n Iraq 2006 4,099 49.8 32.9 2.6 .. 14.6 2.0 .. 12.2 1.1 .. 0.3 av 17.0 2.1 7.5 7.4 ap 0.7 0.8 .. Israel 1987/88 560 68.0 n, u 51.9 .. .. 13.0 .. .. 30.0 4.0 4.0 0.9 ad, ae 16.0 4.0 11.0 1.0 .. .. .. Jordan 2009 965 59.3 40.5 2.6 0.0 8.2 0.7 0.1 22.6 6.3 0.0 0.1 ai 18.8 4.0 12.8 2.0 ap, aq 0.5 0.2 11.2 Kuwait 1999 269 52.0 l, n, t 39.3 4.1 .. 23.4 .. .. 8.8 2.9 0.1 0.0 12.9 4.1 5.7 3.1 an .. .. .. Lebanon 2004 572 58.0 34.0 .. .. .. .. .. .. .. .. .. 24.0 .. .. .. -0.5 -0.7 .. Occupied Palestinian Territory 2006 524 50.2 38.9 .. .. 7.0 .. .. 24.8 .. .. 7.1 bb 11.3 bc .. .. .. -0.1 0.2 .. Oman 2000 259 31.7 24.6 5.4 0.0 4.5 8.0 .. 3.3 3.3 0.1 0.0 7.1 1.4 3.9 1.8 an .. .. .. Qatar 1998 73 43.2 t 32.3 4.1 .. 15.8 .. .. 9.0 2.9 .. 0.5 ah, aw 10.9 2.3 6.8 1.8 an .. .. .. Saudi Arabia 2007 3,578 23.8 n, t .. .. .. .. .. .. .. .. .. .. .. .. .. .. 0.3 0.3 .. Syrian Arab Republic 2006 2,954 58.3 42.6 1.2 0.0 12.9 0.9 0.0 25.7 1.6 0.2 0.0 15.7 9.2 1.7 4.8 ap 1.4 0.9 .. Turkey 2008 13,916 73.0 46.0 8.3 0.1 5.3 0.9 0.0 16.9 14.3 0.1 0.0 27.0 0.6 26.2 0.2 ap, aq 0.7 0.7 6.2 Contraceptive prevalence United Arab Emirates 1995 278 27.5 t 23.6 4.2 0.1 12.0 1.4 .. 3.7 2.0 0.2 0.0 4.0 1.6 1.4 1.0 an .. .. .. (percentage) Yemen 2006 3,114 27.7 19.2 2.3 0.0 9.0 3.5 0.0 4.0 0.4 0.0 0.0 8.4 1.1 0.5 6.8 ap 0.6 0.8 38.6 h 70 or more 50 to less than 70 20 to less than 50 Less than 20 Notes No data ad The data presented in this chart are the most recent available  the most recent observation or, when data were available for  Côte d’Ivoire; 1999 for Belize and Kazakhstan; 2000/01    I   ncluding male sterilization. as of December 2010.  2010, linear interpolation was used.  for Mauritania; 2001 for China, Myanmar and Tunisia;  ae   I   ncluding female sterilization. The more developed regions comprise all regions of Europe  2002 for Burundi and Viet Nam; 2002/03 for El Salvador;  af   I   ncluding injectables. Unmet need for family planning is the ratio of the number of  plus  Northern  America,  Australia,  New  Zealand  and  Japan.  2003 for Burkina Faso, Mongolia and Timor-Leste; 2004  ag women  of  reproductive  age  married  or  in  a  union  who  are    I   ncluding implants. The boundaries on this map do not imply official endorsement or acceptance by the United Nations. The  less  developed  regions  comprise  all  regions  of  Africa,  for Cameroon and Malawi; 2004/05 for Lesotho and  fecund, not using contraception and who report that they do  ah   I   ncluding vaginal barrier methods. Asia (excluding Japan) and Latin America and the Caribbean,  the United Republic of Tanzania; 2005 for Lao People’s  not  want  any  more  children  or  wish  to  delay  the  next  child  ai   I   ncluding female condoms. as well as Melanesia, Micronesia and Polynesia. Developed  divided  by  the  number  of  women  of  reproductive  age  who  Democratic Republic and Rwanda; 2006/07 for Pakistan. aj countries  are  those  in  the  more  developed  regions.  The  i   E   xcluding hysterectomies. are  married  or  in  a  union,  expressed  as  a  percentage.  The      djusted. A ak group of least developed countries includes 49 countries as  numerator also includes, unless otherwise indicated, women  j   I   ncluding emergency contraception. of December 2010. Other less developed countries comprise  who are pregnant or in the period of postpartum amenorrhea  k     reliminary data. P al   I   t is assumed that other traditional methods represent 50  Percentage of women with an unmet need for family planning among those aged 15-49     stimate. E the  less  developed  regions  excluding  the  least  developed  and  whose  most  recent  pregnancy  was  unwanted  or  mis- l      igures by method do not add up to the total. F a m per cent or more of other methods (not specified). who are married or in a union: most recent data available countries. timed but was not due to contraceptive failure. m     ncluding abstinence. I     igures by method do not add up to the total because  F an Sub-Saharan Africa includes all the regions of Africa except    I   ncluding breastfeeding. a      union involves a man and a woman regularly cohabit- A some methods are used in combination. ao Northern Africa, but includes Sudan. n   I   ncluding douching. ing in a marriage-like relationship.     ata pertain to a non-standard age or marital status  D ap b group or definition of unmet need for family planning.   I   ncluding lactational amenorrhea (LAM). Two dots (..) indicate that data are not available.     ercentage of women using contraception among those  P aq o     ata pertain to men and women. D   I   ncluding folk methods. Contraceptive  prevalence  is  defined  as  the  percentage  of  of reproductive age who are married or in a union. ar c p     ata pertain to methods used at last sexual intercourse. D   I   ncluding rhythm. women of reproductive age (usually aged 15 to 49) who are      ncluding diaphragms, cervical caps and spermicidal  I as foams, jelly, cream and sponges. q     ata pertain to methods used during the last month. D   I   ncluding withdrawal. currently using contraception among those in the same age  at group who are married or in a union. A union involves a man  d     ncluding emergency contraception, female condom and  I r     ata pertain to methods used during the last two  D   I   ncluding male and female sterilization and IUD. au and a woman regularly cohabiting in a marriage-like relation- modern methods not reported separately. months.   I   ncluding male and female sterilization, injectables and  ship.  When  more  than  one  contraceptive  method  is  used,  e     lso called periodic abstinence or the calendar method. A s     ata pertain to methods used during the last 12 months. D implants. Unmet need only  the  most  effective  method  is  recorded,  unless  a  note  f t av   I   ncluding male sterilization, implants and vaginal barrier  (percentage)     ncluding prolonged abstinence, breastfeeding, douch- I     ata pertain to nationals of the country. D indicates otherwise.  ing, various folk methods and traditional methods not  u methods. 30 or more     ata pertain to the Jewish population. D a w Annual  change  from  2000  to  2009  in  contraceptive  preva- reported separately. v     ncluding male sterilization, injectables and implants. I     ata pertain to the Flemish population. D ax 20 to less than 30 lence,  expressed  in  terms  of  percentage  points  per  year,  g     omen with unmet need are those who were fecund  W w   I   ncluding male sterilization, IUD and vaginal barrier      ata pertain to Peninsular Malaysia. D has  been  estimated  by  dividing  the  difference  between  the  but were not using contraception at the time of the sur- x methods. 10 to less than 20     ata pertain to Northern Sudan. D ay estimates of contraceptive prevalence for 2000 and 2009 by  vey, and yet reported not wanting any more children or  y   I   ncluding female sterilization, injectables, male condoms  nine. Estimates of this indicator were obtained only for coun- wanting to delay the next child. Data pertain to women    Excluding Northern Ireland. and vaginal barrier methods. Less than 10 z tries  with  at  least  two  observations,  one  of  which  referred  in a union. E   xcluding the Northern Province. az   I   ncluding injectables, implants and vaginal barrier meth- aa No data to 2001 or a later year. To obtain estimates of contraceptive  h     ata pertain to a different year, specifically 1987 for  D     ata  pertain  to  unmet  need  for  only  for  the  purpose  of  D ods. prevalence for 2000, linear interpolation was used when the  Trinidad and Tobago; 1988 for Botswana; 1991/92 for  limiting. ba   I   ncluding female condoms, emergency contraception  data available referred to years bracketing the year 2000. If  Belgium; 1992/93 for Costa Rica and Sudan; 1994/95 for  ab     ata pertain only to the four most commonly used meth- D and vaginal barrier methods. the two points available referred to later years, the estimate  the Central African Republic; 1995 for Spain; 1995/96 for  ods. bb   I   ncluding male and female sterilization, male condoms,  for 2000 was set equal to the earliest observation. The esti- Puerto Rico; 1996 for the Comoros and Uzbekistan; 1997  ac     ncluding some cases of sterilization for non-contracep- I injectables, implants and vaginal barrier methods. mate of contraceptive prevalence for 2009 was set equal to  for Kyrgyzstan and Yemen; 1998 for Togo; 1998/99 for  tive reasons. bc   I   ncluding rhythm, withdrawal and breastfeeding. The boundaries on this map do not imply official endorsement or acceptance by the United Nations.
  • 2.
    Percentage of womenusing any modern method of contraception among those aged 15-49 Change in donor assistance for family planning programmes per woman aged 15-49, who are married or in a union: most recent data available married or in a union: 1998 to 2008* Change in donor assistance for family planning programmes (percentage) Contraceptive prevalence * Note: Donor assistance in 2008 is adjusted for inflation using 1998 prices. (percentage) Per capita donor assistance increased The boundaries on this map do not imply official endorsement or acceptance by the United Nations. 70 or more The boundaries on this map do not imply official endorsement or acceptance by the United Nations. Per capita donor assistance declined (by less than 50 per cent) 50 to less than 70 Per capita donor assistance declined (by 50 per cent or more) 20 to less than 50 No data available or not applicable Less than 20 No data Contraceptive prevalence by method for each of the major areas Female sterilization IUD Pill Injectable or implant Male sterilization Male condom Vaginal barrier methods or other modern methods Traditional methods World Contraceptive Use 2011 Copyright United Nations, 2011 All rights reserved ST/ESA/SER.A/301 Sales No. E.11.XIII.2 Enquiries should be directed to: USD 10 Director, Population Division ISBN 978-92-1-151478-0 Department of Economic and Social Affairs United Nations, New York, NY 10017, U.S.A. Fax number: +1 212 963-2147 Printed in the United States of America 11-22431—April 2011—3,185 United Nations