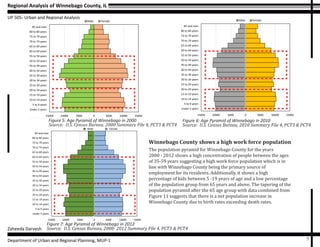
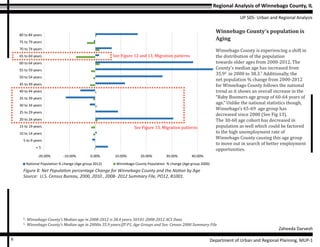
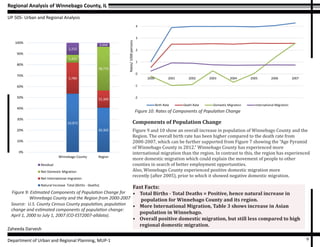
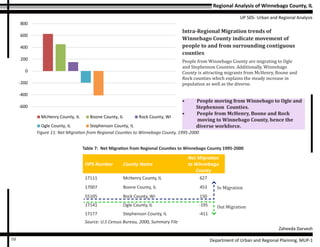
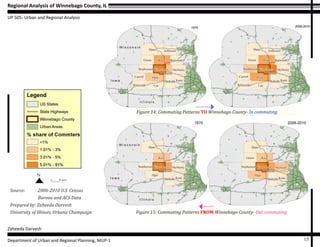
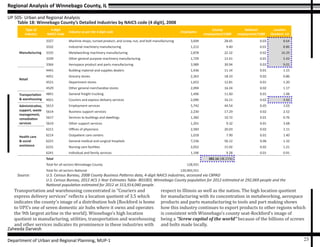
Winnebago County in northern Illinois has experienced steady population growth from 1950 to 2010, with its population increasing 93% during that time period. While Winnebago County remains a major population center in the region, its share of the regional population has decreased from around 40% in 1960-1980 to 32% currently, as surrounding counties like McHenry have grown more rapidly. Winnebago County's population is predominantly white but is becoming more diverse, with increases in the African American and Asian populations between 2000 and 2012. The county has a balanced workforce, with around half the population having a high school education or less and half having a bachelor's degree or higher.
Winnebago County Regional Analysis Examines Population and Demographic Trends
1. Zaheeda Darvesh
Department of Urban and Regional Planning, MUP-1
T h e r e a l i t y o f W i n n e b a g o C o u n t y
b e g g i n g f o r a c h a n g e
2. Regional Analysis of Winnebago County, IL
UP 505- Urban and Regional Analysis
Zaheeda Darvesh
Department of Urban and Regional Planning, MUP-12
Illinois
Winnebago County’s Physical Layout
Winnebago County in Northern Illinois is located on
the I-39 Logistics Corridor, which encompasses 10,000 square
miles and spans from Janesville (Wisconsin) on the north to
Bloomington (Illinois) on the south.1
Winnebago County is
part of the Rockford, Illinois, Metropolitan Statistical Area
which comprises of Boone, Ogle and Stephenson counties as
well. Winnebago’s County seat is Rockford which is Illinois’
third largest city. The Rockford region is contiguous to the Chi-
cago Metropolitan Area and its location allows for easy access
to regional, national and international markets.2
Winnebago is
well accessed through a network of interstates that facilitate
connectivity to other areas such as the I-90 to Chicago Metro
Area (Illinois), I-43 to Milwaukee (Wisconsin) and I-90/I-39
to Madison (Wisconsin) - (See Figure 1). Winnebago County
along with its surrounding 14 counties of Stephenson, Boone,
McHenry, Carroll, Ogle, Whiteside, Lee, DeKalb, Kane in IL and
Dane, Green, Rock, Jefferson and Walworth in Wisconsin forms
a larger intra-regional area (See Fig. 1). All these
counties fall within a 25 mile radius from Winnebago County.
For an in-depth demographic and economic analysis, the
counties of Boone, Ogle, McHenry, Winnebago and Stephenson
in Illinois and Rock County in Wisconsin are selected.
Figure 1: Map of Winnebago and its surrounding counties
1
- Winnebago County Location and Transportation at
villageprofile.com accessed on January 24, 2014 from www.villageprofile.com/illi-
nois/winnebago/08/topic.
2
- www.gorockford.com accessed on February 2, 2014 from
www.gorockford.com/includes/media/docs/Rockford-Fact-Sheet.pdf.
Winnebago
County in
Illinois
3. Regional Analysis of Winnebago County, IL
UP 505- Urban and Regional Analysis
Zaheeda Darvesh
Department of Urban and Regional Planning, MUP-1 3
0
200
400
600
800
1000
1200
1900 1910 1920 1930 1940 1950 1960 1970 1980 1990 2000 2010
Populationin1900forallcounties=100
Indexed Population Growth for Winnebago County, IL
1900-2010
Winnebago County Boone County Rock County
Cook County Ogle County McHenry County
DeKalb County Stephenson County Region
Figure 2: Indexed Population Trends of Winnebago County, IL 1900-2010
3
- U.S. Census Bureau: State and County QuickFacts accessed on February 28, 2014 from www.quickfacts.census.gov
Winnebago County’s population continues to grow
Source: U.S. Census Bureau, American FactFinder, 2010 Redistricting Data SF
Table 2: Population Trends in Winnebago County, Long Run
County name 1900 1910 1920 1930 1940 1950 1960 1970 1980 1990 2000 2010
Winnebago County 100 131.99 190.05 245.32 253.27 318.50 438.43 515.46 524.37 528.61 581.92 617.13
Boone County 100 98.04 97.03 95.48 96.27 108.10 128.72 161.10 181.31 195.09 264.62 343.01
Rock County 100 108.47 129.19 144.93 156.58 181.20 222.47 257.74 272.29 272.46 297.46 313.13
Ogle County 100 95.66 92.11 96.53 102.54 114.76 130.82 147.16 159.08 157.77 175.19 183.66
McHenry County 100 109.24 111.44 117.88 125.38 170.22 282.97 374.86 496.98 615.75 873.94 1037.53
Stephenson County 100 105.40 108.04 114.69 116.35 119.07 132.27 139.87 141.80 137.55 140.21 136.58
Region 100 110.88 129.46 148.53 155.46 185.91 245.63 291.06 317.60 335.70 399.02 440.78
Winnebago County’s population in 2012 is estimated at
292,069.3
Its population has increased substantially from
1950 to 2010 at a 93% increase (See Fig. 2). During the same
time frame, other surrounding regional counties experienced
positive population changes as well. The most prominent and
exponential population change within the region was
experienced by McHenry County (See Table 1). This could be
attributed to its proximity to the surrounding Cook County
which offers abundant employment opportunities. Also,
Winnebago’s birth rate has been higher compared to the
death rate from 2000-2007, which along with the net
international migration is attributed to the overall population
increase (See Fig. 12). Winnebago County has experienced
major population changes from 1950-2010 (See Figure 3).
This change has been steeper at 64% from 1950-1980
compared to the more recent and steady increase at 17%
from 1980 -2010. This could be referenced with the
commuting patterns of Winnebago County residents
(See Table 12 &13) which indicates a trend of movement of
Winnebago residents from the county to surrounding
counties for employment.
4. Regional Analysis of Winnebago County, IL
UP 505- Urban and Regional Analysis
Zaheeda Darvesh
Department of Urban and Regional Planning, MUP-14
Population change in Winnebago County and the Region
Winnebago County continues to be a major population center as well as an employment
source for the region. From 1960–1980 it made up for approximately 40% of the
regional population (See Table 2). Since then, this trend is decreasing at a steady rate.
Currently, it constitutes to 32% of the regional population, which is in line with steeper
population growth in the surrounding McHenry and Rock Counties.
Fast Facts:
• Winnebago County’s population has grown at a steeper rate of 64% from
1950-1980 and a steadier rate of 17% from 1980-2010.
• The surrounding McHenry County’s population has grown exponentially
from 1950-2010.
• Winnebago County constitutes to almost 30% of the Regional population
which has decreased by 8% from 1980-2010.
0.00
100,000.00
200,000.00
300,000.00
400,000.00
500,000.00
600,000.00
700,000.00
800,000.00
900,000.00
1,000,000.00
1900 1910 1920 1930 1940 1950 1960 1970 1980 1990 2000 2010
Population Change of Winnebago County w.r.t. the Region
Winnebago County Regional
Figure 3: Population Change of Winnebago County and the Region
Source: U.S. Census Bureau, American FactFinder,
2010 Redistricting Data SF (PL 94-171)
Table 2: Population Change of Winnebago
County and the Region 1900-2010
Year
Winnebago
County
Regional % share
1900 47,845.00 208,660.00 22.93 %
1910 63,153.00 231,366.00 27.30 %
1920 90,929.00 270,138.00 33.66 %
1930 117,373.00 309,918.00 37.87 %
1940 121,178.00 324,379.00 37.36 %
1950 152,385.00 387,913.00 39.28 %
1960 209,765.00 512,527.00 40.93 %
1970 246,623.00 607,316.00 40.61 %
1980 250,884.00 662,705.00 37.86 %
1990 252,913.00 700,479.00 36.11 %
2000 278,418.00 832,599.00 33.44 %
2010 295,266.00 919,730.00 32.10 %
5. Regional Analysis of Winnebago County, IL
UP 505- Urban and Regional Analysis
Zaheeda Darvesh
Department of Urban and Regional Planning, MUP-1 5
0
100000
200000
300000
400000
500000
600000
700000
800000
900000
1000000
Winnebago Pop
2000
Regional Pop 2000 Winnebago Pop
2010
Regional Pop 2010 Winnebago Pop
2012
Regional Pop 2012
Chart Title
White Black/African American American Indian and Alaskan Native Asian Native Hawaiian/ Pacific Islander Others
Figure 4: Racial Demographics of Winnebago County and the Region
Winnebago County is predominantly
White but is becoming more diverse
Winnebago County like the surrounding
region is mostly White at 80% followed by the
African American population that constitute to
12% of the total population. From 2000-2012,
Winnebago County, like the region, has seen
an increase in the African American and Asian
population which could be attributed to the
migration of people within the region
(See Figure 11). This upward shift has
allowed some diversity to an otherwise
uniform and homogenous Winnebago
populace.
Table 3: Winnebago County’s Racial Demographics
Winnebago
Pop 2000
Winnebago
Pop 2010
Winnebago
Pop 2012
% point
change
White 229,595 236,143 236,835 3.15 %
Black/African American 29,317 40,317 36,087 23.09 %
American Indian and Alaskan Native 797 2,734 774 -2.89 %
Asian 4,780 8,289 6,865 43.62 %
Native Hawaiian/ Pacific Islander 101 272 85 -15.84 %
Others 22,476 16,358 20,958 -6.75 %
Total Winnebago Population 287,066 304,113 301,604 5.06 %
Source: U.S. Census Bureau-2000, 2010 Census and ACS-P006
Table 4: Regional Racial Demographics
Regional
Population
2000
Regional
Population
2010
Regional
Population
2012
% point
change
White 742,480 803,240 803,122 8.17 %
Black/African American 42,248 61,995 51,805 22.62 %
American Indian and Alaskan Native 1,983 7,394 1,963 -1.01 %
Asian 10,508 21,793 17,956 70.88 %
Native Hawaiian/ Pacific Islander 264 809 148 -43.94 %
Others 35,116 46,319 62,931 79.21 %
Total Regional Population 832,599 941,550 918,003 10.26 %
Source: U.S. Census Bureau-2000, 2010 Census and ACS-P006 _2010
6. Regional Analysis of Winnebago County, IL
UP 505- Urban and Regional Analysis
Zaheeda Darvesh
Department of Urban and Regional Planning, MUP-16
Table 5: Educational Attainment for Winnebago County and its Surrounding Counties 25 years and Older 2000-2012
2000 2008 - 2012 2000 2008 - 2012
High
School
Education
(No
diploma)
% who
hold High
School
Education
or less
High
School
Education
(No
diploma)
% who
hold High
School
Education
or less
Bachelor’s
Degree,
Professional,
Graduate or
Above
% who hold
Bachelor’s
Degree,
Professional,
Graduate or
Above
Bachelor’s
Degree,
Professional,
Graduate or
Above
% who hold
Bachelor’s
Degree,
Professional,
Graduate or
Above
Boone County, IL 14,981 57 17,495 51 11,080 43 16,622 49
McHenry County, IL 64,103 39 69,925 35 99,677 61 130,824 65
Ogle County, IL 17,759 53 17,000 47 15,558 47 18,952 53
Stephenson County, IL 17,805 54 15,516 47 15,046 46 17,569 53
Winnebago County, IL 93,468 51 95,238 49 88,335 49 100,868 51
Rock County, WI 54,668 55 52,274 49 44,102 45 54,242 51
Total Population 262,784 267,448 273,798 339,077
Source: U.S. Census Bureau-2000, ACS 2008-2012
Table 6: Regional Educational attainment of Winnebago County
Regional % of high
school education or
less
Regional % of Bachelor’s
Degree, Professional,
Graduate or Above
2000 2008-2012 2000 2008-2012
Boone County, IL 6 7 4 5
McHenry County, IL 24 26 36 39
Ogle County, IL 7 6 6 6
Stephenson County, IL 7 6 5 5
Winnebago County, IL 36 36 32 30
Rock County, WI 21 20 16 16
Source: U.S. Census Bureau-2000, ACS 2008-2012
Winnebago County shows a balanced mix of
unskilled workers as well as professionals
The Winnebago County workforce comprises of a mix of
workers with professional degrees as well as those with high
school qualification or less. This reinforces the fact that
Winnebago County comprises of unskilled as well as skilled
workers. According to the 2008-2012 ACS Data, regionally,
McHenry County tops the “professional graduate population”
at 39% followed by Winnebago County at 30%. This mix of
workers provides Winnebago County an abundant labor pool
for its manufacturing base as well as the emerging health
industry (See Table 16). Also, this data clubbed with the
commuting patterns (See Table 12 and 13) and
unemployment data (See table 14) establishes the fact that
the high unemployment rate of Winnebago County might be
one of the reasons for local residents to commute to
surrounding counties for employment.
7. Regional Analysis of Winnebago County, IL
UP 505- Urban and Regional Analysis
Zaheeda Darvesh
Department of Urban and Regional Planning, MUP-1 7
15000 10000 5000 0 5000 10000 15000
Under 5 years
5 to 9 years
10 to 14 years
15 to 19 years
20 to 24 years
25 to 29 years
30 to 34 years
35 to 39 years
40 to 44 years
45 to 49 years
50 to 54 years
55 to 59 years
60 to 64 years
65 to 69 years
70 to 74 years
75 to 79 years
80 to 84 years
85 and over
Male Female
15000 10000 5000 0 5000 10000 15000
Under 5 years
5 to 9 years
10 to 14 years
15 to 19 years
20 to 24 years
25 to 29 years
30 to 34 years
35 to 39 years
40 to 44 years
45 to 49 years
50 to 54 years
55 to 59 years
60 to 64 years
65 to 69 years
70 to 74 years
75 to 79 years
80 to 84 years
85 and over
Population Pyramid of Winnebago in 2010
Male Female
Figure 6: Age Pyramid of Winnebago in 2010
Source: U.S. Census Bureau, 2010 Summary File 4, PCT3 & PCT4
Figure 7: Age Pyramid of Winnebago in 2012
Source: U.S. Census Bureau, 2008- 2012 Summary File 4, PCT3 & PCT4
Winnebago County shows a high work force population
The population pyramid for Winnebago County for the years
2000 - 2012 shows a high concentration of people between the ages
of 35-59 years suggesting a high work force population which is in
line with Winnebago County being the primary source of
employment for its residents. Additionally, it shows a high
percentage of kids between 5 -19 years of age and a low percentage
of the population group from 65 years and above. The tapering of the
population pyramid after the 65 age group with data combined from
Figure 11 suggests that there is a net population increase in
Winnebago County due to birth rates exceeding death rates.
Figure 5: Age Pyramid of Winnebago in 2000
Source: U.S. Census Bureau, 2000 Summary File 4, PCT3 & PCT4
15000 10000 5000 0 5000 10000 15000
Under 5 years
5 to 9 years
10 to 14 years
15 to 19 years
20 to 24 years
25 to 29 years
30 to 34 years
35 to 39 years
40 to 44 years
45 to 49 years
50 to 54 years
55 to 59 years
60 to 64 years
65 to 69 years
70 to 74 years
75 to 79 years
80 to 84 years
85 and over
Population Pyramid of Winnebago in 2012
Male Female
8. Regional Analysis of Winnebago County, IL
UP 505- Urban and Regional Analysis
Zaheeda Darvesh
Department of Urban and Regional Planning, MUP-18
-20.00% -10.00% 0.00% 10.00% 20.00% 30.00% 40.00% 50.00%
< 5
5 to 9 years
10 to 14 years
15 to 19 years
20 to 24 years
25 to 29 years
30 to 34 years
35 to 39 years
40 to 44 years
45 to 49 years
50 to 54 years
55 to 59 years
60 to 64 years
65 to 69 years
70 to 74 years
75 to 79 years
80 to 84 years
Chart Title
National Population % change (Age group 2012) Winnebago County Population % change (Age group 2000)
Figure 8: Net Population percentage Change for Winnebago County and the Nation by Age
Source: U.S. Census Bureau, 2000, 2010 , 2008- 2012 Summary File, PO12, B1001.
Winnebago County’s population is
Aging
Winnebago County is experiencing a shift in
the distribution of the population
towards older ages from 2000-2012. The
County’s median age has increased from
35.94
in 2000 to 38.3.5
Additionally, the
net population % change from 2000-2012
for Winnebago County follows the national
trend as it shows an overall increase in the
“Baby Boomers age group of 60-64 years of
age.” Unlike the national statistics though,
Winnebago’s 65-69 age group has
decreased since 2000 (See Fig 13).
The 30-60 age cohort has decreased in
population as well which could be factored
to the high unemployment rate of
Winnebago County causing this age group
to move out in search of better employment
opportunities.
4
- Winnebago County’s Median age in 2008-2012 is 38.4 years, S0101-2008-2012 ACS Data
5
- Winnebago County’s Median age in 2000is 35.9 years,QT-P1, Age Groups and Sex: Census 2000 Summary File
See Figure 13, Migration patterns
See Figure 12 and 13, Migration patterns
9. Regional Analysis of Winnebago County, IL
UP 505- Urban and Regional Analysis
Zaheeda Darvesh
Department of Urban and Regional Planning, MUP-1 9
-2
-1
0
1
2
3
4
5
2000 2001 2002 2003 2004 2005 2006 2007
Rates/1000persons
Figure 10: Rates of Components of Population Change
for Winnebago County
Birth Rate Death Rate Domestic Migration International Migration
Figure 10: Rates of Components of Population Change
Fast Facts:
• Total Births - Total Deaths = Positive, hence natural increase in
population for Winnebago County and its region.
• More International Migration, Table 3 shows increase in Asian
population in Winnebago.
• Overall positive domestic migration, but still less compared to high
regional domestic migration.
Figure 9: Estimated Components of Population Change for
Winnebago County and the Region from 2000-2007
10,872
39,302
5,780
15,309
1,455
38,770
2,232
3,444
0%
10%
20%
30%
40%
50%
60%
70%
80%
90%
100%
Winnebago County Region
Estimated Components of
Population Change for
Winnebago County and the
Region from 2000-2007
Residual
Net Domestic Migration
Net International migration
Natural Increase Total (Births - Deaths)
Source: U.S. County Census County population, population
change and estimated components of population change:
April 1, 2000 to July 1, 2007 (CO-EST2007-alldata).
Components of Population Change
Figure 9 and 10 show an overall increase in population of Winnebago County and the
Region. The overall birth rate has been higher compared to the death rate from
2000-2007, which can be further supported from Figure 7 showing the “Age Pyramid
of Winnebago County in 2012.” Winnebago County has experienced more
international migration than the region. In contrast to this, the region has experienced
more domestic migration which could explain the movement of people to other
counties in search of better employment opportunities.
Also, Winnebago County experienced positive domestic migration more
recently (after 2005), prior to which it showed negative domestic migration.
10. Regional Analysis of Winnebago County, IL
UP 505- Urban and Regional Analysis
Zaheeda Darvesh
Department of Urban and Regional Planning, MUP-110
Intra-Regional Migration trends of
Winnebago County indicate movement of
people to and from surrounding contiguous
counties
People from Winnebago County are migrating to Ogle
and Stephenson Counties. Additionally, Winnebago
County is attracting migrants from McHenry, Boone and
Rock counties which explains the steady increase in
population as well as the diverse.
-600
-400
-200
0
200
400
600
800
Net Migration from Regional Counties to
Winnebago County, 1995-2000
McHenry County, IL Boone County, IL Rock County, WI
Ogle County, IL Stephenson County, IL
Figure 11: Net Migration from Regional Counties to Winnebago County, 1995-2000
• People moving from Winnebago to Ogle and
Stephenson Counties.
• People from McHenry, Boone and Rock
moving to Winnebago County, hence the
diverse workforce.
FIPS Number County Name
Net Migration
to Winnebago
County
17111 McHenry County, IL 627
17007 Boone County, IL 453
55105 Rock County, WI 150
17141 Ogle County, IL -195
17177 Stephenson County, IL -411
Table 7: Net Migration from Regional Counties to Winnebago County 1995-2000
Source: U.S Census Bureau, 2000, Summary File
In Migration
Out Migration
11. Regional Analysis of Winnebago County, IL
UP 505- Urban and Regional Analysis
Zaheeda Darvesh
Department of Urban and Regional Planning, MUP-1 11
0
1,000
2,000
3,000
4,000
5,000
6,000
7,000
Migration Patterns according to the Age Group
for Winnebago County from 1985-1990
total in-migrants total out-migrants
Figure 12: Migration Patterns according to the Age-Group for
Winnebago County from 1985-1990
1985-1990
5-9
years
15-19
years
10-14
years
20-24
Years
25-29
years
30-34
years
35-39
years
40-44
years
45-49
years
50-54
years
55-59
years
60-64
years
65-69
years
70-74
years
75-79
years
80-84
years
85 +
Total
in-migrants
3,114 2,384 2,165 3,854 5,622 4,440 3,006 2,316 1,300 708 585 694 593 490 482 287 274
Total
out-migrants
2,864 2,180 3,294 5,843 4,572 4,413 2,914 2,475 1,478 899 1,033 950 754 481 295 242 303
Table 9: Migration Patterns according to the Age-Group for Winnebago County from 1985-1990
Source: U.S. Census Bureau Migration Data for 1985-1990
1995-2000
5-9
years
15-19
years
10-14
years
20-24
Years
25-29
years
30-34
years
35-39
years
40-44
years
45-49
years
50-54
years
55-59
years
60-64
years
65-69
years
70-74
years
75-79
years
80-84
years
85 +
Total
in-migrants
3,810 2,750 2,555 4,205 5,480 4,170 4,035 2,715 1,910 1,425 1,070 730 540 470 345 255 365
Total
out-migrants
3,020 2,820 3,240 5,370 3,950 3,805 3,615 2,800 2,370 1,720 1,300 1,035 795 605 405 280 340
Table 10: Migration Patterns according to the Age-Group for Winnebago County from 1995-2000
Source: U.S. Census Bureau Migration Data for 1995-2000
0
1,000
2,000
3,000
4,000
5,000
6,000
Migration Patterns according to the Age Group for
Winnebago County from 1995-2000
total in-migrants total out-migrants
Figure 13: Migration Patterns according to the Age-Group for
Winnebago County from 1995-2000
• For the age groups 5-9 and 20-44 years, from 1985-1990,
the younger population was moving out of Winnebago
County which changed in the time frame from 1995-2000,
where, for the same age groups, more people were
migrating to Winnebago (See Figure 8).
• Decrease in the 65-69 age group for Winnebago
County (See Figure 8).
12. Regional Analysis of Winnebago County, IL
UP 505- Urban and Regional Analysis
Zaheeda Darvesh
Department of Urban and Regional Planning, MUP-112
-20.00%
0.00%
20.00%
40.00%
60.00%
80.00%
100.00%
120.00%
Winnebago County % point change Regional % point change
Figure 13: Household & Housing characteristics in Winnebago County and the
Region, 2000 and 2010-2012
Winnebago County % point change
Regional % point change
Household and Housing trends in Winnebago
Table 11 shows a slight increase in the total number of households
in Winnebago from 2000-2012. For the same time frame, the
married couple family population has decreased while there has
been an increase in the single parent family population which
shows a higher dependency of this group on the welfare system
(See corresponding Food Stamp/ SNAP information). There has
also been a drastic increase in the % of vacant houses compared to
occupied houses from 2000-2012 which could be related to
unemployment and job losses, forcing homeowners to vacate
their properties due to foreclosure. This has impacted an increase
in the average household size as factors such as unemployment,
increased costs of living and lack of jobs are forcing people to live
with family or friends.
Household and Housing characteristics
Winnebago
County 2000
Winnebago
County
2010 - 2012
Winnebago
County
% point
change
Regional
2000
Regional
2010 -
2012
Regional
% point
change
Households
Total households 107,980.00 112,594 4.27% 309,660.00 342,690.00 10.67%
Average household size 2.53 2.57 1.58% 2.64 2.64 -0.06%
Families
Households with families 73,666.00 74,448 1.06% 222,271.00 239,502.00 7.75%
Average family size 3.06 3.15 2.94% 3.11 3.15 1.02%
Married-couple family population 56,423.00 53,036 -6.00% 179,403.00 183,685.00 2.39%
Single parent family population 17,243.00 21,412.00 24.18% 42,868.00 55,817.00 30.21%
Non-family households 34,314.00 38,146 11.17% 87,389.00 103,188.00 18.08%
Housing occupancy
Total housing 114,404.00 125,894.00 10.04% 327,046.00 375,108.00 14.70%
Occupied housing 107,980.00 112,594.00 4.27% 309,660.00 342,690.00 10.67%
Vacant housing 6,424.00 13,300.00 107.04% 17,386.00 32,418.00 86.46%
Table 11: Household and Housing characteristics in Winnebago County and the Region, 2000 and 2010-2012
Source: DP04, 2010-2012 ACS 3year estimates, DP02,
2010-2012 ACS 3year estimates,
DP-1Census 2000 Summary File 1 (SF 1) 100-Percent Data
Single parents receiving Food
Stamps/SNAP
6,843
Single parent family population 21,412
% of Single Parent family population
receiving Food Stamps/ SNAP
31.96%
Married-couple family population
receiving Food Stamps/ SNAP
53,036
Married-couple family population 2,785
% of Married-couple population
receiving Food Stamps/ SNAP
5.25%
Source: Receipt of Food Stamps/ SNAP in
the past 12 months by presence of children
under 18 years by household type for
households for Winnebago County,
B220022, 2010-2012 ACS Data
13. Regional Analysis of Winnebago County, IL
UP 505- Urban and Regional Analysis
Zaheeda Darvesh
Department of Urban and Regional Planning, MUP-1 13
Most of the workers who work in Winnebago County reside in
Winnebago County, meaning they do not commute to a different
geographic area from home. This is evidenced by the fact that
Winnebago County’s employment force comprises of mainly its
residents. However from 1970 to 2010, Winnebago County’s
workforce comprising of local residents has reduced by almost 10%.
Even then, regionally, Winnebago County continues to be the largest
employment center for its residents. It also attracts workers from
the surrounding contiguous counties of Rock, Boone, Ogle and
Stephenson which constitute to approximately 15% of its workforce
population. Additionally, workers from distant Cook and DuPage
County also commute to Winnebago County for work. Winnebago
County residents are also seen commuting to these counties for
employment. From 1970-2010, these counties have shown a net
increase of workers from Winnebago County which indicates a shift
of how other counties are becoming sources of employment for
Winnebago County residents. All these aspects collectively reflect
Winnebago County’s diverse and expanding work force.
Winnebago County is the regional employment center, but is now drawing a greater regional workforce.
Table 12: Number of workers commuting within or to Winnebago County from surrounding counties, Period: 1970-2010
FIPS POR
County of
residence
Class 1970 1980 1990 2000 2000-2010
%
share
1970
Cumulative
1970
%
share
1980
Cumulative
1980
% share
1990
Cumulative
1990
% share
2000
Cumulative
2000
% share
2006-2010
Cumulative
2006-2010
17201 Winnebago C 87,374 104,622 111,822 115,220 108,675 90.48% 90.48% 88.30% 88.30% 86.66% 86.66% 84.07% 84.07% 81.59% 81.59%
55105 Rock S 3,447 3,606 5,157 4,869 4,224 3.57% 94.05% 3.04% 91.34% 4.00% 90.66% 3.55% 87.62% 3.17% 84.76%
17007 Boone S 2,263 3,168 4,216 5,870 7,528 2.34% 96.40% 2.67% 94.01% 3.27% 93.93% 4.28% 91.90% 5.65% 90.42%
17141 Ogle S 1,759 2,784 3,683 4,990 5,333 1.82% 98.22% 2.35% 96.36% 2.85% 96.78% 3.64% 95.55% 4.00% 94.42%
17177 Stephenson S 794 1,071 1,758 2,419 2,498 0.82% 99.04% 0.90% 97.27% 1.36% 98.14% 1.76% 97.31% 1.88% 96.30%
17037 DeKalb S 282 337 634 779 860 0.29% 99.33% 0.28% 97.55% 0.49% 98.63% 0.57% 97.88% 0.65% 96.94%
17031 Cook N 158 165 367 594 928 0.16% 99.50% 0.14% 97.69% 0.28% 98.92% 0.43% 98.31% 0.70% 97.64%
17111 McHenry R 110 199 376 619 787 0.11% 99.61% 0.17% 97.86% 0.29% 99.21% 0.45% 98.76% 0.59% 98.23%
Total
Winnebago
County Workforce
96,563 118,491 129,033 137,054 133,191
Source: Bureau of Economic Analysis and the United States
Legend
FIPS POR- Federal Information processing Standards
POR- Place of residence
C- Core County
S-Surrounding Contiguous Counties
R-Noncontiguous County but within the Regional Area of Winnebago County, (Counties within a 25 mile radius form part of the Regional Extent)
N- Noncontiguous County, Non-Regional Area of Winnebago County Census Bureau (1970-2010)
14. Regional Analysis of Winnebago County, IL
UP 505- Urban and Regional Analysis
Zaheeda Darvesh
Department of Urban and Regional Planning, MUP-114
Table 13: Number of workers commuting from Winnebago County to other surrounding counties, Period: 1970-2010
FIPS
POW
County of Work Class 1970 1980 1990 2000 2006-2010
% share
1970
Cumulative
1970
% share
1980
Cumulative
1980
% share
1990
Cumulative
1990
% share
2000
Cumulative
2000
% share
2006-
2010
Cumulative
2006-2010
17201 Winnebago C 87,374 104,622 111,822 115,220 108,675 93.87% 93.87% 92.98% 92.98% 91.65% 91.65% 88.07% 88.07% 84.69% 84.69%
17007 Boone S 3,116 3,586 3,635 4,389 5,246 3.35% 97.22% 3.19% 96.16% 2.98% 94.63% 3.35% 91.42% 4.09% 88.78%
55105 Rock S 1,057 1,931 2,390 3,160 3,691 1.14% 98.35% 1.72% 97.88% 1.96% 96.58% 2.42% 93.84% 2.88% 91.66%
17031 Cook N 352 382 907 1,785 2,625 0.38% 98.73% 0.34% 98.22% 0.74% 97.33% 1.36% 95.20% 2.05% 93.70%
17141 Ogle S 275 1,038 1,220 1,454 1,796 0.30% 99.02% 0.92% 99.14% 1.00% 98.33% 1.11% 96.31% 1.40% 95.10%
17111 McHenry R 249 128 603 1,810 1,648 0.27% 99.29% 0.11% 99.25% 0.49% 98.82% 1.38% 97.70% 1.28% 96.39%
17037 DeKalb S 227 268 374 635 997 0.24% 99.54% 0.24% 99.49% 0.31% 99.13% 0.49% 98.18% 0.78% 97.16%
17177 Stephenson S 221 411 468 839 1,038 0.24% 99.77% 0.37% 99.86% 0.38% 99.51% 0.64% 98.82% 0.81% 97.97%
55079 Milwaukee N 19 60 35 144 178 0.02% 99.99% 0.05% 99.99% 0.03% 99.97% 0.11% 99.95% 0.14% 99.84%
55045 Green S 6 15 33 66 206 0.01% 100.00% 0.01% 100.00% 0.03% 100.00% 0.05% 100.00% 0.16% 100.00%
Total
Winnebago County
residents working in
Winnebago and its
surrounding counties
93,082 112,527 122,015 130,832 128,316
Source: Bureau of Economic Analysis and the United States
Legend
FIPS POR- Federal Information processing Standards
POR- Place of residence
C- Core County
S-Surrounding Contiguous Counties
R-Noncontiguous County but within the Regional Area of Winnebago County, (Counties within a 25 mile radius form part of the Regional Extent)
N- Noncontiguous County, Non-Regional Area of Winnebago County Census Bureau (1970-2010)
Additionally, the commuting data from table 12 and 13 can be
compared to the educational attainment data for Winnebago and its
Surrounding Counties (See Table 5) which supports the claim that
Winnebago residents are acquiring higher levels of education (See
Table 5- increase in % who hold Bachelor’s Degree, Professional,
Graduate or above) as they explore better employment opportunities
outside of Winnebago.
Loss of Jobs Increase in the Unemployment rate
Poverty Increase
Educational attainment increases
Movement of Winnebago residents to surrounding counties
for better employment opportunities
2000-2012
15. Regional Analysis of Winnebago County, IL
UP 505- Urban and Regional Analysis
Zaheeda Darvesh
Department of Urban and Regional Planning, MUP-1 15
Source: 2006-2010 U.S. Census
Bureau and ACS Data
Prepared by: Zaheeda Darvesh
University of Illinois, Urbana Champaign
Figure 14: Commuting Patterns TO Winnebago County- In commuting
Figure 15: Commuting Patterns FROM Winnebago County- Out commuting
N
0 20 miles
16. Regional Analysis of Winnebago County, IL
UP 505- Urban and Regional Analysis
Zaheeda Darvesh
Department of Urban and Regional Planning, MUP-116
Figure 16: Poverty rate for Winnebago and the surrounding Counties
Source: U.S. Census Bureau, 2009-2011 ACS,
3-year estimates and 2007-2011 5-year estimates
Prepared by: Zaheeda Darvesh
University of Illinois, Urbana Champaign
0 20 miles
N
19.10%
14.94%
12.21%
15.00%
0.00%
5.00%
10.00%
15.00%
20.00%
25.00%
Winnebago County
Poverty Value
State Poverty Value Regional Poverty
Value
National Poverty
Value
Winnebago County Poverty Value State Poverty Value
Regional Poverty Value National Poverty Value
Figure 17: Poverty rate of Winnebago County in comparison to the
State and National value
Winnebago County has the highest poverty rate in
the Region at 19.1%
According to the U.S. Census Bureau’s 2010 and 2011 Small Area
Income and Poverty Estimates, poverty rate for
Winnebago County 6
in Illinois is extremely high in comparison to
the State 7
and the National poverty rate.8
Additionally, the
Regional poverty rate varies from a low of 8% in McHenry
County, IL to a high of 19.1% in Winnebago County, IL
(See Figure 16). Since 1970, Winnebago has experienced a
decline in its manufacturing base which has hurt its economy and
resulted in a high poverty and unemployment rate.
6
- The U.S. Census Bureau’s 2010 & 2011
Small Area Income & Poverty Estimates 2013
7
- ibid
8
- Poverty, Current Population Survey (CPS),
2013 Annual Social and Economic Supplement (ASEC)
17. Regional Analysis of Winnebago County, IL
UP 505- Urban and Regional Analysis
Zaheeda Darvesh
Department of Urban and Regional Planning, MUP-1 17
Winnebago County’s Unemployment Rate
continues to be higher than the Regional, State
and the National level
A three decade decline in manufacturing has led to loss of
jobs and high unemployment rates in Winnebago County.
Once a hub of manufacturing jobs, Winnebago started
experiencing decline after American corporations started
exporting manufacturing jobs overseas in search of cheaper
labor. This trend continued to rise in the 1980’s and was
further accelerated due to the North American Free Trade
Agreement (NAFTA) signed in 1993 which further crippled
the manufacturing base in America. Winnebago County too
experienced similar economic downturn during this period.
Table 14 shows that Winnebago County’s unemployment rate
started rising from 2000 onwards. Additionally during this
time period, there was an increase in self-employed
workers (proprietor’s employment 3.3%), which means that
due to unemployment, people started getting self-employed
(See Table 15). It reached its peak in 2009-2010 due to global
economic recession. During this time frame, Winnebago’s
high unemployment rate coincided with the regions high
unemployment rate as well. It continues to be higher than
the State, Regional and National level since 2000. Currently
Winnebago County’s statewide unemployment rate ranks
third at 11.4% in 2012 after Montgomery’s 11.9% and Boone
County’s 11.6%. 9
It seems to be following the national and
regional unemployment pattern, all of which are becoming
more stable as the U.S. makes a comeback from recession.
Table 14: Unemployment Rate for Winnebago County in comparison to the State, Regional and National value
Source: Estimated using data from the United States Department of
Labor, Local Area Unemployment Statistics from 1990-2012
for annual county, state and national unemployment and
Labor Force Data, accessed on February 21, 2014.
Year
Winnebago
County’s
Unemployment
Rate
State (IL)
Unemployment
Rate
Regional
Unemployment
Rate
National
Unemployment
Rate
1990 5.4 6.3 5.70 5.62
1991 7.1 7.3 8.13 6.85
1992 7.9 7.8 7.93 7.49
1993 7.5 7.4 7.33 6.91
1994 5.3 5.8 5.15 6.10
1995 3.9 5.2 4.33 5.59
1996 4.5 5.3 4.35 5.41
1997 4.5 4.8 4.45 4.94
1998 4.3 4.5 4.03 4.50
1999 4.4 4.5 4.27 4.22
2000 4.6 4.5 4.48 3.97
2001 6.0 5.4 5.62 4.74
2002 7.4 6.5 6.60 5.78
2003 8.1 6.7 7.05 5.99
2004 7.5 6.2 6.50 5.54
2005 6.6 5.8 5.90 5.08
2006 5.6 4.6 5.10 4.61
2007 6.3 5.1 5.72 4.62
2008 8.6 6.4 7.48 5.80
2009 14.8 10.0 12.62 9.28
2010 15.3 10.4 12.92 9.63
2011 12.6 9.7 11.15 8.93
2012 11.4 8.9 10.00 8.08
IncreasingUnemployment
Rate
GlobalrecessionNAFTA
9
- StatsAmerica.org, USA Counties in profile, Winnebago County data
accessed on February 24, 2014
18. Regional Analysis of Winnebago County, IL
UP 505- Urban and Regional Analysis
Zaheeda Darvesh
Department of Urban and Regional Planning, MUP-118
0.00
2.00
4.00
6.00
8.00
10.00
12.00
14.00
16.00
18.00
20.00
Jan
Jul
Jan
Jul
Jan
Jul
Jan
Jul
Jan
Jul
Jan
Jul
Jan
Jul
Jan
Jul
Jan
Jul
Jan
Jul
Jan
Jul
Jan
Jul
Jan
Jul
Jan
Jul
Jan
Jul
Jan
Jul
Jan
Jul
Jan
Jul
Jan
Jul
Jan
Jul
Jan
Jul
Jan
Jul
Jan
Jul
1990 1991 1992 1993 1994 1995 1996 1997 1998 1999 2000 2001 2002 2003 2004 2005 2006 2007 2008 2009 2010 2011 2012
Winnebago County Regional National State(IL)
Figure 18: Monthly Unemployment rate for Winnebago
County in relation to the State, Regional and the
National value.
0
2
4
6
8
10
12
14
16
18
19901991199219931994199519961997199819992000200120022003200420052006200720082009201020112012
Winnebago County's Unemployment Rate State(IL) Unemployment Rate
Regional Unemployment Rate National Unemployment Rate
Figure 19: Annual Unemployment rate for Winnebago County in relation to the
State, Regional and the National value.
The monthly unemployment rate for Winnebago County (See Figure 18)
follows a similar pattern to the annual unemployment rate (See Figure 19)
where Winnebago County continues to lead the chart in soaring
unemployment rates since 2000. Also, the peak unemployment rate was
18.7% for Winnebago County in January 2010, which matches with global
recession. Also, there was another peak in February 2003 which coincides
with the stock market crash in 2000-2002 which could be attributed to the
ripple effect of the destruction of the world towers in 2001.
Event Unemployment rate
NAFTA-1993 7.5%
Stock Market Crash 6.0% - 7.4%
2000 - 2002
Global Recession 6.3% - 15.3%
2007- 2010
19. Regional Analysis of Winnebago County, IL
UP 505- Urban and Regional Analysis
Zaheeda Darvesh
Department of Urban and Regional Planning, MUP-1 19
There was a rise in proprietor’s employment (self-employed)
workers (See Table 15 and 16) which indicates that job losses and
high unemployment rates were pushing people towards becoming
self-employed which was further accelerated by the rise of the
Internet - a cheap source to access information and marketing
opportunities.10
Winnebago County’s labor market undergoes a shift towards small-scale entrepreneurship
Additionally the tables also show a reduction in the total
employment from 2000 to 2011, which was consistent with the
high unemployment rate then (See Table 14).
10
- http://www.newgeography.com/content/003761-toward-a-self-employed-
nation accessed on February24, 2014
SIC Category
Winnebago County Region
1969 2000
% Share
1969
% Share
2000
% Point
Change
(Share)
1969 2000
% Share
1969
%
Share
2000
% Point
Change
(Share)
Total full-time and part-time employment 115,867 175308 100% 100% 0% 271023 444267 100% 100% 0%
Wage and salary employment 104,565 152366 90.25% 86.91% -3.33% 233391 373648 86.11% 84.10% -2.01%
Proprietors employment 1,1302 22942 9.75% 13.09% 3.33% 37632 70619 13.89% 15.90% 2.01%
Farm proprietors employment 1,151 762 0.99% 0.43% -0.56% 9759 6223 3.60% 1.40% -2.20%
Nonfarm proprietors employment 2/ 10,151 22180 8.76% 12.65% 3.89% 27873 64396 10.28% 14.49% 4.21%
Farm employment 1,370 986 1.18% 0.56% -0.62% 13260 8620 4.89% 1.94% -2.95%
Nonfarm employment 114,497 174322 98.82% 99.44% 0.62% 257763 435647 95.11% 98.06% 2.95%
Private nonfarm employment 104,160 159306 89.90% 90.87% 0.98% 231661 391818 85.48% 88.19% 2.72%
* Agricultural services, forestry & fishing 260 1349 0.22% 0.77% 0.55% 754 5194 0.28% 1.17% 0.89%
* Mining 193 114 0.17% 0.07% -0.10% 783 517 0.29% 0.12% -0.17%
* Construction 4,728 7641 4.08% 4.36% 0.28% 12331 27451 4.55% 6.18% 1.63%
* Manufacturing 4,9862 39395 43.03% 22.47% -20.56% 109386 99617 40.36% 22.42% -17.94%
* Transportation and public utilities 3,619 7809 3.12% 4.45% 1.33% 8736 18454 3.22% 4.15% 0.93%
* Wholesale trade 4774 7247 4.12% 4.13% 0.01% 8138 20077 3.00% 4.52% 1.52%
* Retail trade 17503 29050 15.11% 16.57% 1.46% 40034 74268 14.77% 16.72% 1.95%
* Finance, insurance, and real estate 5693 11729 4.91% 6.69% 1.78% 13515 28600 4.99% 6.44% 1.45%
* Services 17528 54972 15.13% 31.36% 16.23% 37984 117640 14.02% 26.48% 12.46%
Government & government enterprises 10337 15016 8.92% 8.57% -0.36% 26102 43829 9.63% 9.87% 0.23%
* Federal, civilian 1038 1258 0.90% 0.72% -0.18% 2185 2688 0.81% 0.61% -0.20%
* Military 815 614 0.70% 0.35% -0.35% 2220 2007 0.82% 0.45% -0.37%
* State and local 8484 13144 7.32% 7.50% 0.18% 21697 39134 8.01% 8.81% 0.80%
* State government 0 0 0% 0% 0% 0 1259 0% 0.28% 0.28%
* Local government 0 0 0% 0% 0% 0 24731 0% 5.57% 5.57%
Table 15: Total full-time and part-time employment for Winnebago County in relation to the Region, 1969-2000, SIC
Source: U.S. Department of Commerce, Bureau of Economic Analysis, Regional Economic information System,
CA25N: Total Employment by Major NAICS Industry. The annual regional unemployment data was derived from the county data.
20. Regional Analysis of Winnebago County, IL
UP 505- Urban and Regional Analysis
Zaheeda Darvesh
Department of Urban and Regional Planning, MUP-120
NAICS
Winnebago County Region
2001 2011
% Share
2001
% Share
2011
% Point
Change
Share
2001 2011
% Share
2001
% Share
2011
% Point
Change
Share
Total employment 171,165 160,384 100.00% 100.00% 0.00% 438,633 427,693 100.00% 100.00% 0.00%
Wage and salary employment 148,601 132,639 86.82% 82.70% -4.12% 369,643 345,511 84.27% 80.78% -3.49%
Proprietors employment 22,564 27,745 13.18% 17.30% 4.12% 68,990 82,182 15.73% 19.22% 3.49%
Farm proprietors employment 732 681 0.43% 0.42% 0.00% 5,996 5,185 1.37% 1.21% -0.15%
Nonfarm proprietors employment 2/ 21,832 27,064 12.75% 16.87% 4.12% 62,994 76,997 14.36% 18.00% 3.64%
Farm employment 969 800 0.57% 0.50% -0.07% 8,471 7,304 1.93% 1.71% -0.22%
Nonfarm employment 170,196 159,584 99.43% 99.50% 0.07% 430,162 420,389 98.07% 98.29% 0.22%
Private nonfarm employment 154,784 144,529 90.43% 90.11% -0.32% 385,041 372,060 87.78% 86.99% -0.79%
*Forestry, fishing, and related activities 126 146 0.07% 0.09% 0.02% 1,671 1,069 0.38% 0.25% -0.13%
*Mining 84 171 0.05% 0.11% 0.06% 468 934 0.11% 0.22% 0.11%
*Utilities, Trans. & Warehousing 6,769 7,704 3.95% 4.80% 0.85% 17,482 17,912 4.55% 6.18% 1.63%
*Construction 8,073 6,138 4.72% 3.83% -0.89% 29,069 22,378 6.63% 5.23% -1.39%
*Manufacturing 35,199 24,316 20.56% 15.16% -5.40% 89,962 60,809 20.51% 14.22% -6.29%
*Wholesale trade 6,345 5,636 3.71% 3.51% -0.19% 17,235 17,322 3.93% 4.05% 0.12%
*Retail trade 19,471 16,792 11.38% 10.47% -0.91% 52,197 49,910 11.90% 11.67% -0.23%
*Information 2,520 1,832 1.47% 1.14% -0.33% 6,378 4,740 1.45% 1.11% -0.35%
*Finance and insurance 7,776 7,947 4.54% 4.95% 0.41% 17,645 20,386 4.02% 4.77% 0.74%
*Real estate and rental & leasing 4,102 4,486 2.40% 2.80% 0.40% 11,336 13,398 2.58% 3.13% 0.55%
*Professional, scientific, & tech. services 6,482 6,240 3.79% 3.89% 0.10% 16,009 16,148 3.65% 3.78% 0.13%
*Mgmt. of companies & enterprises 371 471 0.22% 0.29% 0.08% 1,304 2,457 0.30% 0.57% 0.28%
*Administrative & waste mgmt. services 12,450 13,038 7.27% 8.13% 0.86% 23,146 27,443 5.28% 6.42% 1.14%
*Educational services 2,094 2,832 1.22% 1.77% 0.54% 4,722 6,638 1.08% 1.55% 0.48%
*Health care & social assistance 19,746 23,996 11.54% 14.96% 3.43% 40,144 51,117 9.15% 11.95% 2.80%
*Arts, entertainment, & recreation 2,107 2,926 1.23% 1.82% 0.59% 6,101 7,883 1.39% 1.84% 0.45%
*Accommodation & food services 10,904 10,121 6.37% 6.31% -0.06% 26,097 27,019 5.95% 6.32% 0.37%
*Other services, except public admin. 10,165 9,792 5.94% 6.11% 0.17% 24,897 25,061 5.68% 5.86% 0.18%
Government and Govt. enterprises 15,412 15,055 9.00% 9.39% 0.38% 45,121 48,329 10.29% 11.30% 1.01%
*Federal, civilian 1,116 995 0.65% 0.62% -0.03% 2,404 2,143 0.55% 0.50% -0.05%
*Military 608 597 0.36% 0.37% 0.02% 2,034 1,972 0.46% 0.46% 0.00%
*State and local 13,688 13,463 8.00% 8.39% 0.40% 40,683 44,214 9.27% 10.34% 1.06%
Table 16: Total full-time and part-time employment for Winnebago County in relation to the Region, 2001-2011, NAICS
Source: U.S. Department of Commerce, Bureau of Economic Analysis, Regional Economic information System, CA25-Total Employment
by Major SIC Industry unemployment and Labor Force Data, accessed on February 21, 2014.
The annual regional unemployment data was derived from the county data.
Declining
Industries
21. Regional Analysis of Winnebago County, IL
UP 505- Urban and Regional Analysis
Zaheeda Darvesh
Department of Urban and Regional Planning, MUP-1 21
Manufacturing industry in Winnebago County declining since 1979, yet manufacturing jobs remain a
core sector of the region's total employment
Figure 20: Monthly Unemployment rate for Winnebago County in relation to State, Region and Nation
Source: Data combined from the U.S. Department of Commerce, BEA, REIS
CA25: Total Employment by Major SIC Industry and CA25N: Total Employment by Major NAICS Industry
11
-www.trusteemag.com/trusteemag/html/WebExclusive0413Rockford.html accessed on February 24, 2014.
Manufacturing remained the single largest industry to decline from
1969-2000. This trend continued from 2001-2011 (See Table 16)
as well. But this decline was not as intense as in the previous years
(See Fig. 20). Construction, wholesale trade, retail trade and
information were other industries that declined during this time
frame too (See Table 16). The decline in manufacturing and other
industries led to Winnebago exploring other industries such as
health care and social assistance which have further impacted a shift
from the “blue collar” manufacturing jobs to “white collar” health
care and social assistance jobs (See Table 16). This is further
supported by Table 17 which shows that people employed in this
industry constitute to approximately 16% of the county
employment. Half of the top six employers are the three local
hospital systems: Swedish American Health System, Rockford Health
System and OSF Saint Anthony Medical Center. 11
For the same table, contributing at approximately 20% of the
County’s employment share, the manufacturing industry continues
to remain the most dominant industry of Winnebago even after
undergoing overall substantial decline from 1969 -2011. Table 18
shows the key industries for Winnebago County which include
manufacturing, retail trade, transportation and warehousing,
administrative, support, waste management, remediation services
and health care & social assistance. Further detailed designation of
these industries according to the NAICS 4 digit code indicates that
these industries collectively constitute to approximately 40% of the
county employment (See Table 18). Location Quotient is used as a
measure here to calculate Winnebago County’s industrial
specialization relative to the national standards which is compared
with Illinois’s industrial specialization as well (See Table 17).
Decline in manufacturing
from 2001-2011
22. Regional Analysis of Winnebago County, IL
UP 505- Urban and Regional Analysis
Zaheeda Darvesh
Department of Urban and Regional Planning, MUP-122
Industry
Number of
establishments
Employees
County Regional National County
employment
share %
National
employment
share %
Location
Quotient-LQ
Winnebago
Location
Quotient-LQ
Illinois
Employment/
1000 persons
Employment/
1000 persons
Employment/
1000 persons
Agriculture, forestry, fishing and hunting 8.00 9.50 0.03 0.01 0.00 0.01% 0.00% 0.05 0.25
Mining, quarrying, and oil and gas extraction 12.00 51.50 0.18 0.06 0.00 0.04% 0.00% 0.08 0.34
Utilities 6.00 1,067.00 3.65 1.17 0.00 0.83% 0.00% 1.56 1.01
Construction 633.00 4,845.00 16.59 5.29 0.02 3.76% 0.00% 0.65 0.79
Manufacturing 664.00 26,888.00 92.06 29.37 0.09 20.85% 0.02% 1.93 1.09
Wholesale trade 426.00 5,739.00 19.65 6.27 0.02 4.45% 0.00% 0.87 1.16
Retail trade 1,015.00 15,892.00 54.41 17.36 0.05 12.33% 0.01% 0.95 0.94
Transportation and warehousing 201.00 6,369.00 21.81 6.96 0.02 4.94% 0.01% 1.35 1.21
Information 99.00 2,434.00 8.33 2.66 0.01 1.89% 0.00% 0.66 0.87
Finance and insurance 475.00 4,404.00 15.08 4.81 0.01 3.42% 0.00% 0.63 1.21
Real estate and rental and leasing 244.00 1,690.00 5.79 1.85 0.01 1.31% 0.00% 0.72 0.89
Professional, scientific, and technical services 645.00 4,275.00 14.64 4.67 0.01 3.32% 0.00% 0.50 1.06
Management of companies and enterprises 30.00 1,149.00 3.93 1.26 0.00 0.89% 0.00% 0.37 1.47
Administrative and support and waste
management and remediation services
373.00 11,678.00 39.98 12.76 0.04 9.06% 0.01% 1.07 0.93
Educational services 58.00 1,768.00 6.05 1.93 0.01 1.37% 0.00% 0.53 1.05
Health care and social assistance 686.00 20,134.00 68.94 21.99 0.06 15.62% 0.02% 1.10 0.95
Arts, entertainment, and recreation 93.00 1,757.00 6.02 1.92 0.01 1.36% 0.00% 0.80 0.86
Accommodation and food services 584.00 10,576.00 36.21 11.55 0.03 8.20% 0.01% 0.83 0.91
Other services (except public administration) 760.00 8,239.00 28.21 9.00 0.03 6.39% 0.01% 1.42 1.05
Industries not classified 5.00 9.50 0.03 0.01 0.00 0.01% 0.00% 0.58 0.93
Total 441.59 140.89 0.41 100%
Total for all sectors-Winnebago County 128,931.00
Total for all sectors-National 120,903,551.00
Total for all sectors-Illinois 5,227,045.00
Winnebago County population for 2012 estimated at 292,069 people. Source: U.S. Census Bureau, 2012 ACS 1-Year Estimates Table- B01003
Regional population estimated for 2012 estimated at 915,435 people. Source: U.S. Census Bureau, 2010- 2012 ACS 3-Year Estimates Table- B01003
National population estimated for 2012 at 313,914,040 people. Source: U.S. Census Bureau, 2012 ACS 1-Year Estimates Table- B01003
Table 17: Winnebago County’s Major Industries by NAICS code (2 digit), 2008
Source: U.S. Census Bureau, 2008 County Business Patterns data, 2-digit NAICS industries, accessed via Community Business Pattern Access Database
U.S. Census Bureau, 2012 ACS1-Year Estimates Table- B01003, Winnebago County population for 2012 estimated at 292,069 people.
U.S. Census Bureau, 2010- 2012 ACS 3-Year Estimates Table- B01003, Regional population estimated for 2012 estimated at 915,435 people.
U.S. Census Bureau, 2012 ACS 1-Year Estimates Table- B01003, National population estimated for 2012 at 313,914,040 people.
23. Regional Analysis of Winnebago County, IL
UP 505- Urban and Regional Analysis
Zaheeda Darvesh
Department of Urban and Regional Planning, MUP-1 23
Table 18: Winnebago County’s Detailed Industries by NAICS code (4 digit), 2008
Transportation and warehousing concentrated in “Couriers and
express delivery services” reflects a location quotient of 3.5 which
indicates the county’s image of a distribution hub (Rockford is home
to UPS’s one of seven domestic air hubs where it owns and operates
the 9th largest airline in the world). Winnebago’s high location
quotient in manufacturing, utilities, transportation and warehousing
and other services indicates its prominence in these industries with
respect to Illinois as well as the nation. The high location quotient
for manufacturing with its concentration in metalworking, aerospace
products and parts manufacturing to tools and part making shows
how this industry continues to export products to other regions which
is consistent with Winnebago’s county seat-Rockford’s image of
being a “Screw capital of the world” because of the billions of screws
and bolts made locally.
Type of
industry
4 digit
NAICS Code
Industry as per the 4 digit code Employees
County
employment/1000
National
employment/1000
Location
Quotient- LQ
Manufacturing
3327 Machine shops; turned product; and screw, nut, and bolt manufacturing 3,694 28.65 0.03 8.64
3332 Industrial machinery manufacturing 1,212 9.40 0.01 8.86
3335 Metalworking machinery manufacturing 2,878 22.32 0.02 16.29
3339 Other general purpose machinery manufacturing 1,729 13.41 0.01 5.43
3364 Aerospace product and parts manufacturing 3,989 30.94 0.03 9.01
Retail
4441 Building material and supplies dealers 1,436 11.14 0.01 1.15
4451 Grocery stores 2,363 18.33 0.02 0.86
4521 Department stores 1,652 12.81 0.01 1.20
4529 Other general merchandise stores 2,094 16.24 0.02 1.17
Transportation
& warehousing
4841 General freight trucking 1,496 11.60 0.01 1.48
4921 Couriers and express delivery services 2,090 16.21 0.02 3.50
Administrative,
support, waste
management,
remediation
services
5613 Employment services 5,742 44.54 0.05 1.03
5614 Business support services 2,230 17.29 0.02 2.52
5617 Services to buildings and dwellings 1,382 10.72 0.01 0.76
5619 Other support services 1,201 9.32 0.01 3.68
Health care
& social
assistance
6211 Offices of physicians 2,583 20.03 0.02 1.11
6214 Outpatient care centers 1,018 7.90 0.01 1.40
6221 General medical and surgical hospitals 7,236 56.12 0.06 1.32
6231 Nursing care facilities 2,052 15.92 0.02 1.21
6241 Individual and family services 1,196 9.28 0.01 0.91
Total 382.16 (38.21%)
Total for all sectors-Winnebago County 128,931
Total for all sectors-National 120,903,551
Source: U.S. Census Bureau, 2008 County Business Patterns data, 4-digit NAICS industries, accessed via CBPAD
U.S. Census Bureau, 2012 ACS 1-Year Estimates Table- B01003, Winnebago County population for 2012 estimated at 292,069 people and the
National population estimated for 2012 at 313,914,040 people.
24. Regional Analysis of Winnebago County, IL
UP 505- Urban and Regional Analysis
Zaheeda Darvesh
Department of Urban and Regional Planning, MUP-124
-15,000
-10,000
-5,000
0
5,000
10,000
1970 1972 1974 1976 1978 1980 1982 1984 1986 1988 1990 1992 1994 1996 1998 2000 2002 2004 2006 2008
Regional Shift
Industry Mix
Industry Shift
Regional Shift
Figure 21: Regional Shift and Industry Mix for Winnebago County, Illinois
Source: Data combined from the U.S. Department of Commerce, BEA, REIS,
CA25: Total Employment by Major SIC Industry and
CA25N: Total Employment by Major NAICS Industry
Swifty Shifty Analysis
The industry shift component of the
Swifty Shifty analysis indicates how
much of Winnebago’s overall growth
is related to its “industry mix.” From
Figure 21 it can be inferred that
Winnebago has its employment
concentrated in industries which are
“declining” or are associated with
“slow growth” at the national level. In
other words, the negative industrial
mix for Winnebago for most of the
years from 1970-2008, indicates that
Winnebago is losing employment due
to its “industrial mix”. The regional
shift indicates how much of
Winnebago’s overall growth can be
attributed to local effects or local
competitive advantage. Winnebago
experienced positive regional shift
from 1984 to 1995, which means that
locally its industries were growing
faster than its national equivalent or
Winnebago was attractive as a
location to manufacturing,
transportation and service related
industries. Furthermore, during the
years 1980, 1997 and 2009, some
industries such as manufacturing,
transportation and government
services were declining more quickly
locally than nationally, hence the
negative regional shift.
Positive Regional Shift from
1984 - 1995 due to manufacturing,
transportaion and service industries
Negative Regional
Shift-Manufacturing
declining more quickly
locally than nationally
Negative Regional Shift-
Services followed by manufacturing
and transportation declining more
quickly locally than nationally
Negative Regional Shift-
Manufacturing and Government
Services declining
25. Regional Analysis of Winnebago County, IL
UP 505- Urban and Regional Analysis
Zaheeda Darvesh
Department of Urban and Regional Planning, MUP-1 25
Winnebago County in need for transformation
Winnebago County’s dependency on a declining manufacturing base
has led to high unemployment and poverty rates, which collectively
paint a very grim picture. Today Winnebago County resonates with
high crime rates and an unstable job market. If Winnebago County
is to survive this harsh reality, then it has to diversify its industries.
Health care is an emerging industry not just in the region but
nationally as well. The current Obama administration has allocated
$1,000 billion12
towards this upcoming field. Winnebago County has
shown some prospects over the last few years by incentivizing on
this opportunity as reflected in its increase in health related
industries. Along with health care, investing in retail,
transportation and other service based industries will allow it to
foster its economy and create jobs that are so vital at this time, as
the country and the region tries to break free from the clutches
of recession. Even with the population increasing at a steady
rate, Winnebago County continues to be a major population as
well as the growth center of the region. People are migrating to
Winnebago County to explore its employment opportunities.
12
- http://www.usgovernmentspending.com/year_spending_2010USbn_15bs2s_10#usgs302
The educational attainment level of its residents has increased
and so has its racial makeup which now reflects more diversity.
Based on these trends, it is suitable to infer that Winnebago has
the potential to thrive and come out a winner in these difficult
circumstances. Current times however, call for diversifying that
potential and looking for options to experiment with its
manufacturing centered base. Winnebago County has
experienced drastic changes since the deindustrialization phase
of the 1980’s. Once a leader in manufacturing, it is now trying to
survive the economic turmoil and the disappearance of its
industries due to globalization and outsourcing. It has to employ
a different approach and diversification of industries seems to
be the only viable option at this time. If it fails to do so, it won’t
be long before Winnebago County, like many other cities such as
Detroit, would form a poster child of manufacturing decline.
Rockford in Winnebago County, IL