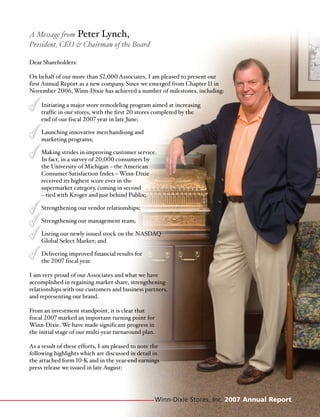
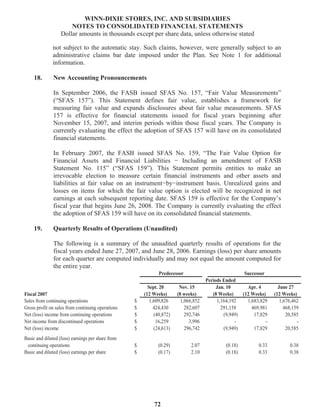
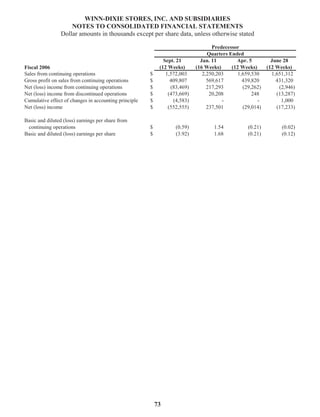
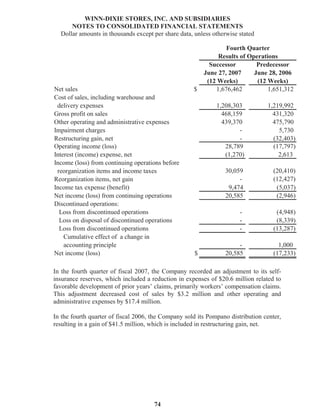
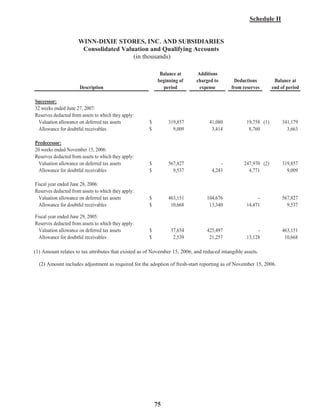
This document is the 2007 Annual Report of Winn-Dixie Stores, Inc. It provides information on the board of directors as of June 27, 2007 and contact information for investor inquiries. It also includes a letter from Peter Lynch, President, CEO, and Chairman, discussing Winn-Dixie's financial highlights for fiscal year 2007 and their multi-year turnaround plan focusing on rebuilding their brand, investing in store remodels, neighborhood marketing, associate training, and achieving profitable sales.
Winn-Dixie Stores, Inc. filed for Chapter 11 bankruptcy protection in February 2005 and underwent a major restructuring that included closing stores in 14 markets and reducing its workforce. The CEO discusses the challenges facing the company and the steps taken to improve operations, including focusing on produce, meat, and other perishables departments. While acknowledging the company still has progress to make, the CEO expresses optimism that Winn-Dixie is improving and will earn back customers' trust through delivering better quality, service, and value.
The annual report summarizes Whole Foods Market's financial performance and operations in 2006. It discusses record sales and profit growth, new store openings, commitment to stakeholders, and goals for continued expansion. Key highlights include double-digit comparable store sales growth, increased market share, and a plan to double sales and square footage by 2010 while maintaining a focus on core values.
The CEO provides a summary of the company's strong financial performance in fiscal year 2004, with net income rising 41% to $141 million and net sales increasing 39% to over $1 billion. Several accomplishments are highlighted, including expanding the store base, completing the White House | Black Market integration, and launching the new soma intimate apparel line. Updates on leadership changes and strengthening of corporate governance are also provided. The CEO expresses appreciation for the company's culture and commitment to integrity, and optimism for continued success in partnering with stakeholders.
This annual report summarizes the company's performance in 2008. It discusses challenges faced due to economic deterioration, but also growth through new store openings and sales increasing 24% to $8 billion. Cost-cutting measures were implemented and an investment was received to ensure liquidity during difficult times. The company remains committed to its core values like high quality, customer satisfaction, and social/environmental responsibility.
The document is Winn-Dixie's 1999 annual report which summarizes the company's financial performance for the fiscal year. It reports that earnings per diluted share were $1.23, taxes per diluted share were $2.07, and operating income decreased by 6.5% compared to the previous year. The report provides highlights on sales, gross profit, expenses, taxes, net earnings, capital expenditures, and other financial metrics. It indicates that the company operated 1,188 stores at the end of the fiscal year.
Winn-Dixie Stores, Inc. saw disappointing financial results in 2000 with sales decreasing 3.1% from the previous year. The company underwent a major restructuring process in 2000 that resulted in $396 million in charges to earnings. The restructuring involved closing underperforming stores, consolidating operations, and eliminating over 11,000 jobs. The changes are expected to result in annual cost savings of $400 million once fully implemented.
This document is the 2002 annual report for Winn-Dixie. It summarizes the company's financial performance for fiscal year 2002, which showed improved revenue, operating income, earnings per share, and return on equity compared to 2001. The report also discusses Winn-Dixie's strategic focus on becoming the best supermarket operator in neighborhoods by providing quality products at competitive prices and excellent customer service. Additionally, it highlights marketing initiatives undertaken in 2002, such as a new branding campaign and customer reward card program, which helped boost sales.
Winn-Dixie Stores, Inc. released its 2001 Annual Report which highlighted a fresh approach to improving operations and customer satisfaction. Key points included:
1) Winn-Dixie completed a major restructuring in 2001 that closed underperforming stores and centralized functions to save $400 million annually.
2) Operational improvements like new training programs and store remodels enhanced the customer experience.
3) Acquisitions of Gooding's and Jitney Jungle supermarkets expanded Winn-Dixie's store network and market share.
The document is Winn-Dixie's 2008 Annual Report. It discusses Winn-Dixie's philosophy of continuously striving to be better each day through store remodels, neighborhood-focused marketing, community outreach programs, associate training, and high-quality private label brands. The report provides an overview of Winn-Dixie's operations and achievements in 2008.
The 2008 annual report of Winn-Dixie Stores, Inc. discusses the company's guiding philosophy of "Better", which means continuously improving and exceeding customer expectations. The report outlines key initiatives to improve the customer experience through store remodels, tailored neighborhood marketing, community outreach programs, associate training, and expanded private label products. It provides an overview of Winn-Dixie's leadership team and emergence from Chapter 11 bankruptcy protection in 2006.
Lincoln Financial Group reported strong financial results for 2007. Net income was $1.2 billion, up from 2006. Sales grew over 20% for variable annuities, life insurance, and group protection. Defined contribution sales rose 25% and mutual fund sales increased 32%. Lincoln aims to continue expanding distribution and developing new retirement products in 2008 to capitalize on growth opportunities in the retirement market. The company also seeks to complete integration initiatives and maintain financial strength despite volatility.
Winn-Dixie Stores, Inc. filed for Chapter 11 bankruptcy protection in February 2005 and underwent a major restructuring that included closing stores in 14 markets and reducing its workforce. The CEO discusses the challenges facing the company and the steps taken to improve operations, including focusing on produce, meat, and cleanliness. While acknowledging more work remains, the CEO says Winn-Dixie is getting better through these initiatives to regain customer trust.
The document provides information about Investment Planners, Inc. (IPI), an independent broker-dealer and registered investment advisor. IPI has over 100 registered representatives across 17 offices. It outlines IPI's mission, values, and philosophy of prioritizing clients' best interests. IPI's owner and president, David Koshinski, has over 20 years of experience in the financial industry and has led IPI's growth. IPI partners with RBC Correspondent Services for clearing and custody services.
The document provides information about Investment Planners, Inc. (IPI), an independent broker-dealer and registered investment advisor. It outlines IPI's mission, values, philosophy, leadership team, technology suite, custody and clearing partners, and solutions and services offered to advisors. IPI aims to help advisors achieve significant growth and success through strategic lifestyle and wealth management strategies.
Reconstruction Partners is a consulting firm founded by experienced C-level executives to provide strategic advice and interim management services to companies. The firm focuses on emerging brands, franchisors, private equity companies, senior lenders, and troubled companies. The four principals have over 100 combined years of experience leading companies ranging in value from $25 million to $2 billion across various industries. Reconstruction Partners aims to help clients prosper through strategies like restructuring, turnaround management, and mergers and acquisitions.
RP3 group is a private investment partnership that focuses on acquiring profitable businesses, emerging brands, and troubled companies with $5-100 million in revenues. The partners have extensive experience in founding, leading, and investing in companies. RP3 seeks to provide business owners with liquidity and alternative exit options. Unlike private equity firms, the partners intend to actively operate acquired companies long-term. RP3 also offers consulting services to help companies with challenges and growth opportunities. The partners have over 100 combined years of experience at senior levels in companies ranging from $25-2,000 million in value across various industries.
The document announces the formation of a new Enterprise Productivity team at Northern Trust led by Aileen Blake to focus on productivity efforts across the company. It describes the goals of the team to assist ongoing productivity initiatives and facilitate strategic investments. It provides details on the structure of the new team and leadership changes to support roles across different business units.
This document summarizes Ameriprise Financial's fourth quarter 2006 earnings conference call. It discusses strong adjusted revenue, earnings, and return on equity growth for both the quarter and full year. The separation from American Express is on track. Brand awareness has increased and distribution capabilities have been strengthened through advisor productivity improvements and growth in fee-based assets and clients.
fannie mae Letter from the Chairman of the Board of Directors 2006finance6
The document is a letter from Stephen B. Ashley, Chairman of the Board of Fannie Mae, inviting shareholders to Fannie Mae's annual meeting in December 2007. It summarizes significant changes made to improve corporate governance, including adding nine new board members with expertise in areas like accounting, finance, and risk management. It also notes changes like splitting the roles of Chairman and CEO, increasing board independence, and strengthening board oversight of risk areas. The letter expresses appreciation for shareholders and commitment to Fannie Mae's mission of expanding affordable housing opportunities.
BNY Mellon is a global investment company established in 1784. It provides investment management, investment services, and wealth management. In 2019, BNY Mellon reported revenues of $16.5 billion, net income of $4.4 billion, and assets under management of $1.9 trillion. It operates in over 35 countries and has over 51,000 employees. BNY Mellon faces competition from other large financial institutions but maintains a leading position in custody banking and asset servicing.
Jeffrey Grahovac has over 20 years of experience in sales and business development roles. His background includes positions in banking, automotive sales, and as the current Director of Business Development for an imaging services company. He has a track record of exceeding sales goals and utilizes consultative solution sales strategies to build strong client relationships.
Jeffrey Grahovac has over 20 years of experience in sales and business development roles. His background includes positions in banking, automotive sales, and as the current Director of Business Development for an imaging services company. He has a track record of exceeding sales goals and utilizes consultative solution sales strategies to build strategic client relationships.
Jerry Kegley is a CPA with over 30 years of experience in finance and accounting roles. He has served as CFO for PrimeSource Building Products, raising over $850 million in debt financing for an acquisition. As CFO for GS Roofing Products, he implemented an ERP system and identified $20 million in annual cost savings. His experience also includes roles as Controller and Treasurer for Star-Kist Foods, improving working capital and reducing costs.
Financial advisers at New York Life help clients achieve their financial goals through a range of products and services. New York Life offers a comprehensive three-year training program and ongoing support resources. They seek highly motivated candidates with strong communication and integrity. New York Life has top financial strength ratings and has led the Million Dollar Round Table for 61 consecutive years. The company's mission is to provide financial security through its products and earn customers' trust and loyalty.
This document provides a summary of Jeff Elias's experience and qualifications. It outlines his career history working as an audit partner and staff accountant and then as chief financial officer for several apparel companies. It details his skills in cost reduction, profitability improvement, restructuring, and financial analysis. His experience includes roles with accounting firms, moderate sized apparel companies, and as an independent consultant.
Professional Qualifications - Darin JanecekDarin Janecek
Darin Janecek is an experienced finance executive seeking a new leadership position. He has over 20 years of experience in corporate finance, M&A, and operational leadership. As CFO at ARI Network Services, he helped grow revenues 40%, reduce customer churn 50%, and increase EBITDA and share price significantly. Testimonials praise his collaborative leadership style and ability to build high-performing teams. He is looking to leverage his skills to drive strategic growth at a small-to-mid-sized, growth-oriented company.
Hewitt associates...Attempting to be different in a crowdHITESH BHARTI
Hewitt Associates was a global human resources consulting and outsourcing firm. It grew organically in its early years through small acquisitions, but began pursuing larger mergers and acquisitions in 2000. This included acquiring retirement, payroll, and human resources outsourcing companies. By 2010, Hewitt had 2,600 clients making it the largest HR outsourcing provider. However, it faced challenges in 2006 as its outsourcing revenues declined due to contract issues and pricing pressures. Moving forward, Hewitt aimed to diversify its revenues across geographies and client sizes through innovation and cross-selling services.
The document is Prudential Financial's 2007 Annual Report. It summarizes that in 2007:
- Prudential continued to grow its businesses and capitalize on opportunities, with all operating divisions posting double-digit earnings growth.
- It strengthened its financial position and delivered solid financial performance and shareholder value, with a 21% increase in earnings per share.
- It remains well-positioned for future growth due to its diverse business mix, risk management capabilities, and strong talent base.
This document provides information about how shareholders should determine their tax basis in shares of Castle & Cooke, Inc. and Dole Food Company, Inc. following a spin-off distribution of Castle & Cooke shares. Shareholders' tax basis in the Castle shares is the $15.65 fair market value on the distribution date. Any cash received for fractional Castle shares results in short-term capital gain. Shareholders must reduce their tax basis in each Dole share by $5.22 to account for the value of the Castle shares received. The holding period for Castle shares begins on the distribution date.
Dole Food Company sent a letter to shareholders regarding tax information related to a stock dividend of Castle & Cooke, Inc. common stock. The letter notes that in addition to the stock dividend, Dole paid four quarterly cash dividends of $0.10 per share each. The first two quarterly dividends are taxable, while the last two are believed to not be taxable according to Dole's estimation.
The document is Winn-Dixie's 2008 Annual Report. It discusses Winn-Dixie's philosophy of continuously striving to be better each day through store remodels, neighborhood-focused marketing, community outreach programs, associate training, and high-quality private label brands. The report provides an overview of Winn-Dixie's operations and achievements in 2008.
The 2008 annual report of Winn-Dixie Stores, Inc. discusses the company's guiding philosophy of "Better", which means continuously improving and exceeding customer expectations. The report outlines key initiatives to improve the customer experience through store remodels, tailored neighborhood marketing, community outreach programs, associate training, and expanded private label products. It provides an overview of Winn-Dixie's leadership team and emergence from Chapter 11 bankruptcy protection in 2006.
Lincoln Financial Group reported strong financial results for 2007. Net income was $1.2 billion, up from 2006. Sales grew over 20% for variable annuities, life insurance, and group protection. Defined contribution sales rose 25% and mutual fund sales increased 32%. Lincoln aims to continue expanding distribution and developing new retirement products in 2008 to capitalize on growth opportunities in the retirement market. The company also seeks to complete integration initiatives and maintain financial strength despite volatility.
Winn-Dixie Stores, Inc. filed for Chapter 11 bankruptcy protection in February 2005 and underwent a major restructuring that included closing stores in 14 markets and reducing its workforce. The CEO discusses the challenges facing the company and the steps taken to improve operations, including focusing on produce, meat, and cleanliness. While acknowledging more work remains, the CEO says Winn-Dixie is getting better through these initiatives to regain customer trust.
The document provides information about Investment Planners, Inc. (IPI), an independent broker-dealer and registered investment advisor. IPI has over 100 registered representatives across 17 offices. It outlines IPI's mission, values, and philosophy of prioritizing clients' best interests. IPI's owner and president, David Koshinski, has over 20 years of experience in the financial industry and has led IPI's growth. IPI partners with RBC Correspondent Services for clearing and custody services.
The document provides information about Investment Planners, Inc. (IPI), an independent broker-dealer and registered investment advisor. It outlines IPI's mission, values, philosophy, leadership team, technology suite, custody and clearing partners, and solutions and services offered to advisors. IPI aims to help advisors achieve significant growth and success through strategic lifestyle and wealth management strategies.
Reconstruction Partners is a consulting firm founded by experienced C-level executives to provide strategic advice and interim management services to companies. The firm focuses on emerging brands, franchisors, private equity companies, senior lenders, and troubled companies. The four principals have over 100 combined years of experience leading companies ranging in value from $25 million to $2 billion across various industries. Reconstruction Partners aims to help clients prosper through strategies like restructuring, turnaround management, and mergers and acquisitions.
RP3 group is a private investment partnership that focuses on acquiring profitable businesses, emerging brands, and troubled companies with $5-100 million in revenues. The partners have extensive experience in founding, leading, and investing in companies. RP3 seeks to provide business owners with liquidity and alternative exit options. Unlike private equity firms, the partners intend to actively operate acquired companies long-term. RP3 also offers consulting services to help companies with challenges and growth opportunities. The partners have over 100 combined years of experience at senior levels in companies ranging from $25-2,000 million in value across various industries.
The document announces the formation of a new Enterprise Productivity team at Northern Trust led by Aileen Blake to focus on productivity efforts across the company. It describes the goals of the team to assist ongoing productivity initiatives and facilitate strategic investments. It provides details on the structure of the new team and leadership changes to support roles across different business units.
This document summarizes Ameriprise Financial's fourth quarter 2006 earnings conference call. It discusses strong adjusted revenue, earnings, and return on equity growth for both the quarter and full year. The separation from American Express is on track. Brand awareness has increased and distribution capabilities have been strengthened through advisor productivity improvements and growth in fee-based assets and clients.
fannie mae Letter from the Chairman of the Board of Directors 2006finance6
The document is a letter from Stephen B. Ashley, Chairman of the Board of Fannie Mae, inviting shareholders to Fannie Mae's annual meeting in December 2007. It summarizes significant changes made to improve corporate governance, including adding nine new board members with expertise in areas like accounting, finance, and risk management. It also notes changes like splitting the roles of Chairman and CEO, increasing board independence, and strengthening board oversight of risk areas. The letter expresses appreciation for shareholders and commitment to Fannie Mae's mission of expanding affordable housing opportunities.
BNY Mellon is a global investment company established in 1784. It provides investment management, investment services, and wealth management. In 2019, BNY Mellon reported revenues of $16.5 billion, net income of $4.4 billion, and assets under management of $1.9 trillion. It operates in over 35 countries and has over 51,000 employees. BNY Mellon faces competition from other large financial institutions but maintains a leading position in custody banking and asset servicing.
Jeffrey Grahovac has over 20 years of experience in sales and business development roles. His background includes positions in banking, automotive sales, and as the current Director of Business Development for an imaging services company. He has a track record of exceeding sales goals and utilizes consultative solution sales strategies to build strong client relationships.
Jeffrey Grahovac has over 20 years of experience in sales and business development roles. His background includes positions in banking, automotive sales, and as the current Director of Business Development for an imaging services company. He has a track record of exceeding sales goals and utilizes consultative solution sales strategies to build strategic client relationships.
Jerry Kegley is a CPA with over 30 years of experience in finance and accounting roles. He has served as CFO for PrimeSource Building Products, raising over $850 million in debt financing for an acquisition. As CFO for GS Roofing Products, he implemented an ERP system and identified $20 million in annual cost savings. His experience also includes roles as Controller and Treasurer for Star-Kist Foods, improving working capital and reducing costs.
Financial advisers at New York Life help clients achieve their financial goals through a range of products and services. New York Life offers a comprehensive three-year training program and ongoing support resources. They seek highly motivated candidates with strong communication and integrity. New York Life has top financial strength ratings and has led the Million Dollar Round Table for 61 consecutive years. The company's mission is to provide financial security through its products and earn customers' trust and loyalty.
This document provides a summary of Jeff Elias's experience and qualifications. It outlines his career history working as an audit partner and staff accountant and then as chief financial officer for several apparel companies. It details his skills in cost reduction, profitability improvement, restructuring, and financial analysis. His experience includes roles with accounting firms, moderate sized apparel companies, and as an independent consultant.
Professional Qualifications - Darin JanecekDarin Janecek
Darin Janecek is an experienced finance executive seeking a new leadership position. He has over 20 years of experience in corporate finance, M&A, and operational leadership. As CFO at ARI Network Services, he helped grow revenues 40%, reduce customer churn 50%, and increase EBITDA and share price significantly. Testimonials praise his collaborative leadership style and ability to build high-performing teams. He is looking to leverage his skills to drive strategic growth at a small-to-mid-sized, growth-oriented company.
Hewitt associates...Attempting to be different in a crowdHITESH BHARTI
Hewitt Associates was a global human resources consulting and outsourcing firm. It grew organically in its early years through small acquisitions, but began pursuing larger mergers and acquisitions in 2000. This included acquiring retirement, payroll, and human resources outsourcing companies. By 2010, Hewitt had 2,600 clients making it the largest HR outsourcing provider. However, it faced challenges in 2006 as its outsourcing revenues declined due to contract issues and pricing pressures. Moving forward, Hewitt aimed to diversify its revenues across geographies and client sizes through innovation and cross-selling services.
The document is Prudential Financial's 2007 Annual Report. It summarizes that in 2007:
- Prudential continued to grow its businesses and capitalize on opportunities, with all operating divisions posting double-digit earnings growth.
- It strengthened its financial position and delivered solid financial performance and shareholder value, with a 21% increase in earnings per share.
- It remains well-positioned for future growth due to its diverse business mix, risk management capabilities, and strong talent base.
Similar to winn-dixie stores 2007_Annual_Report (20)
This document provides information about how shareholders should determine their tax basis in shares of Castle & Cooke, Inc. and Dole Food Company, Inc. following a spin-off distribution of Castle & Cooke shares. Shareholders' tax basis in the Castle shares is the $15.65 fair market value on the distribution date. Any cash received for fractional Castle shares results in short-term capital gain. Shareholders must reduce their tax basis in each Dole share by $5.22 to account for the value of the Castle shares received. The holding period for Castle shares begins on the distribution date.
Dole Food Company sent a letter to shareholders regarding tax information related to a stock dividend of Castle & Cooke, Inc. common stock. The letter notes that in addition to the stock dividend, Dole paid four quarterly cash dividends of $0.10 per share each. The first two quarterly dividends are taxable, while the last two are believed to not be taxable according to Dole's estimation.
Dole Food Company paid cash distributions of $.10 per share per quarter to shareholders in 1996. Forms 1099-Div initially reported these distributions as 100% taxable ordinary dividends. Dole has since determined that 100% of the 1996 cash distributions are non-taxable. As a result, shareholders may be entitled to a refund from the IRS and state tax authorities for taxes paid on the distributions in 1996.
Dole Food Company paid shareholders four quarterly cash distributions of $0.10 per share in 1997. According to the company, all four distributions were returns of capital and not taxable to shareholders. The document provides important tax information to Dole shareholders regarding 1997 cash distributions.
Dole Food Company paid shareholders four quarterly cash distributions of $0.10 per share in 1998. According to the company, all four distributions were returns of capital and not taxable to shareholders. No foreign taxes were paid on the distributions.
Dole Food Company paid four quarterly cash distributions of $0.10 per share in 1999. According to the company, all four distributions will be taxable as ordinary dividends, with no foreign taxes paid. The document provides important tax information for Dole Food Company shareholders regarding their 1999 cash distributions.
Dole Food Company paid four quarterly cash distributions of $0.10 per share in 2000 totaling $0.40 per share. According to the company, all four cash distributions paid to shareholders in 2000 will be taxable as ordinary dividends, with no foreign taxes paid.
Dole Food Company paid four quarterly cash distributions of $0.10 per share in 2001 totaling $0.40 per share. According to the company, these distributions will be taxed as ordinary dividends. No foreign taxes were paid on the distributions.
Dole Food Company paid four quarterly cash distributions of $0.15 per share in 2002. According to the company, all four distributions will be taxable as ordinary dividends. No foreign taxes were paid related to these distributions.
Dole Food Company paid a quarterly cash distribution of $0.15 per share to shareholders in the first quarter of 2003. According to the company's estimate, this cash distribution will be considered a taxable ordinary dividend. The document provides important tax information to shareholders regarding Dole Food Company's 2003 cash distributions.
Dole Food Company provided information to shareholders about tax implications of the company's privatization transaction. The notice discusses that shareholders will recognize capital gains or losses for tax purposes equal to the difference between the cash received and their tax basis in the shares. Gains or losses will be long-term if the shares were held for over 12 months. Shareholders are advised to consult their own tax advisors to understand how this transaction may affect their individual tax situation.
The annual report summarizes Dole Food Company's operations and financial performance in 1995. Some key points:
- Dole successfully separated its real estate and resorts business into a new publicly-traded company, Castle & Cooke, enhancing shareholder value.
- Dole's food business saw revenue grow 14% to $3.8 billion in 1995. Operating income increased 40% to $193 million due to improved performance across banana, vegetable, and pineapple operations.
- Dole expanded its value-added salad business in Europe and entered new joint ventures and acquisitions to grow in European markets.
- Financially, Dole paid down over $700 million in debt,
Dole Food Company's annual report discusses its commitment to providing safe, high quality food products while protecting the environment. It highlights that Dole focuses on growing its core food businesses globally through expansion, joint ventures, and maximizing returns by downsizing non-profitable operations. The report also discusses Dole's efforts in nutrition education to encourage healthy lifestyles and consumption of fruits and vegetables.
This annual report summarizes Dole Food Company's financial performance in 1997. Some key points:
- Revenues grew 13% to $4.3 billion and cash flow from operations grew 10% to $372 million.
- Net income grew 23% to $160.2 million, excluding a 1996 charge. Net debt was reduced by $154 million.
- The company focused on growing its core fresh fruit and vegetable business while liquidating underperforming assets.
- Looking forward, the company aims to continue expanding globally, particularly in Asia, to take advantage of new opportunities for growth.
Dole Food Company's 1998 annual report summarizes the company's operations, financial results, and outlook. The year was challenging due to adverse weather conditions affecting production and economic crises slowing some markets. Despite these difficulties, most core businesses performed well. The report notes two special charges taken in Q4 1998 relating to damage from Hurricane Mitch in Honduras and a citrus freeze in California. It provides an overview of the company's worldwide operations, acquisitions in the flower industry, and positive outlook as business returns to normal in 1999 with the new headquarters facility nearing completion.
Dole Food Company reported strong financial results in its 1999 Annual Report. Revenue exceeded $5 billion for the first time, up 14% from 1998. Net income was $49 million, though it would have been $68 million excluding special charges. Cash flow from operations remained strong at $308 million. The company focused on its core businesses of fresh fruits, vegetables and flowers, maintaining low costs, and investing in its people. It undertook various restructuring and cost-cutting measures following challenges like hurricanes and citrus freezes. Dole entered 2000 with renewed purpose to profitably grow its brands and enhance shareholder returns.
This annual report summarizes Dole's financial performance in 2000. It shows that revenue was $4.76 billion, net income was $68 million, and diluted EPS was $1.21. Total assets were $2.845 billion. The report discusses business segment results, with fresh vegetables posting record earnings. It also notes leadership changes, including a new president and COO.
The document is Dole Food Company's 2001 annual report. It provides an overview of Dole's worldwide operations, financial highlights for 2001-1997, and a letter from the Chairman and CEO. Some key points:
- Dole has operations in over 90 countries worldwide focused on sourcing, ripening, distribution and marketing of food.
- In 2001, Dole divested its Honduran beverage business and used the proceeds to pay down debt.
- Net income for 2001 was $150 million, an increase over 2000, driven by the beverage divestiture gain and improved continuing operations performance.
- Dole focused on cost reductions in 2001 and aims to complete divestitures of non-
This annual report summarizes Dole's financial performance from 1998-2002. It shows that while revenues have remained relatively steady, income from continuing operations increased substantially in 2002 after declining in 2001. Total shareholders' equity also increased steadily over this period. The report discusses Dole's continued focus on expanding its value-added packaged foods business and improving costs. It highlights new product introductions in fruit bowls and salad blends that have contributed to revenue growth. Messages from the Chairman and President emphasize their commitment to improving health and nutrition worldwide through Dole's products and the new Dole Nutrition Institute.
The document summarizes plans for a new Dole Wellness Center, Spa and Hotel complex to be built in Westlake Village, California. The complex will include a 267-room luxury hotel, full-service spa and fitness facility, comprehensive medical clinic and diagnostic center, wellness center, and television production studio focused on health and wellness programming. The goal is to provide visitors tools and treatments to improve their health and quality of life through nutrition, fitness, and preventative healthcare. The $150 million complex is expected to open in March 2006.
Solution Manual For Financial Accounting, 8th Canadian Edition 2024, by Libby...Donc Test
Solution Manual For Financial Accounting, 8th Canadian Edition 2024, by Libby, Hodge, Verified Chapters 1 - 13, Complete Newest Version Solution Manual For Financial Accounting, 8th Canadian Edition by Libby, Hodge, Verified Chapters 1 - 13, Complete Newest Version Solution Manual For Financial Accounting 8th Canadian Edition Pdf Chapters Download Stuvia Solution Manual For Financial Accounting 8th Canadian Edition Ebook Download Stuvia Solution Manual For Financial Accounting 8th Canadian Edition Pdf Solution Manual For Financial Accounting 8th Canadian Edition Pdf Download Stuvia Financial Accounting 8th Canadian Edition Pdf Chapters Download Stuvia Financial Accounting 8th Canadian Edition Ebook Download Stuvia Financial Accounting 8th Canadian Edition Pdf Financial Accounting 8th Canadian Edition Pdf Download Stuvia
OJP data from firms like Vicinity Jobs have emerged as a complement to traditional sources of labour demand data, such as the Job Vacancy and Wages Survey (JVWS). Ibrahim Abuallail, PhD Candidate, University of Ottawa, presented research relating to bias in OJPs and a proposed approach to effectively adjust OJP data to complement existing official data (such as from the JVWS) and improve the measurement of labour demand.
5 Tips for Creating Standard Financial ReportsEasyReports
Well-crafted financial reports serve as vital tools for decision-making and transparency within an organization. By following the undermentioned tips, you can create standardized financial reports that effectively communicate your company's financial health and performance to stakeholders.
South Dakota State University degree offer diploma Transcriptynfqplhm
办理美国SDSU毕业证书制作南达科他州立大学假文凭定制Q微168899991做SDSU留信网教留服认证海牙认证改SDSU成绩单GPA做SDSU假学位证假文凭高仿毕业证GRE代考如何申请南达科他州立大学South Dakota State University degree offer diploma Transcript
Falcon stands out as a top-tier P2P Invoice Discounting platform in India, bridging esteemed blue-chip companies and eager investors. Our goal is to transform the investment landscape in India by establishing a comprehensive destination for borrowers and investors with diverse profiles and needs, all while minimizing risk. What sets Falcon apart is the elimination of intermediaries such as commercial banks and depository institutions, allowing investors to enjoy higher yields.
"Does Foreign Direct Investment Negatively Affect Preservation of Culture in the Global South? Case Studies in Thailand and Cambodia."
Do elements of globalization, such as Foreign Direct Investment (FDI), negatively affect the ability of countries in the Global South to preserve their culture? This research aims to answer this question by employing a cross-sectional comparative case study analysis utilizing methods of difference. Thailand and Cambodia are compared as they are in the same region and have a similar culture. The metric of difference between Thailand and Cambodia is their ability to preserve their culture. This ability is operationalized by their respective attitudes towards FDI; Thailand imposes stringent regulations and limitations on FDI while Cambodia does not hesitate to accept most FDI and imposes fewer limitations. The evidence from this study suggests that FDI from globally influential countries with high gross domestic products (GDPs) (e.g. China, U.S.) challenges the ability of countries with lower GDPs (e.g. Cambodia) to protect their culture. Furthermore, the ability, or lack thereof, of the receiving countries to protect their culture is amplified by the existence and implementation of restrictive FDI policies imposed by their governments.
My study abroad in Bali, Indonesia, inspired this research topic as I noticed how globalization is changing the culture of its people. I learned their language and way of life which helped me understand the beauty and importance of cultural preservation. I believe we could all benefit from learning new perspectives as they could help us ideate solutions to contemporary issues and empathize with others.
STREETONOMICS: Exploring the Uncharted Territories of Informal Markets throug...sameer shah
Delve into the world of STREETONOMICS, where a team of 7 enthusiasts embarks on a journey to understand unorganized markets. By engaging with a coffee street vendor and crafting questionnaires, this project uncovers valuable insights into consumer behavior and market dynamics in informal settings."
New Visa Rules for Tourists and Students in Thailand | Amit Kakkar Easy VisaAmit Kakkar
Discover essential details about Thailand's recent visa policy changes, tailored for tourists and students. Amit Kakkar Easy Visa provides a comprehensive overview of new requirements, application processes, and tips to ensure a smooth transition for all travelers.
Discover the Future of Dogecoin with Our Comprehensive Guidance36 Crypto
Learn in-depth about Dogecoin's trajectory and stay informed with 36crypto's essential and up-to-date information about the crypto space.
Our presentation delves into Dogecoin's potential future, exploring whether it's destined to skyrocket to the moon or face a downward spiral. In addition, it highlights invaluable insights. Don't miss out on this opportunity to enhance your crypto understanding!
https://36crypto.com/the-future-of-dogecoin-how-high-can-this-cryptocurrency-reach/
A toxic combination of 15 years of low growth, and four decades of high inequality, has left Britain poorer and falling behind its peers. Productivity growth is weak and public investment is low, while wages today are no higher than they were before the financial crisis. Britain needs a new economic strategy to lift itself out of stagnation.
Scotland is in many ways a microcosm of this challenge. It has become a hub for creative industries, is home to several world-class universities and a thriving community of businesses – strengths that need to be harness and leveraged. But it also has high levels of deprivation, with homelessness reaching a record high and nearly half a million people living in very deep poverty last year. Scotland won’t be truly thriving unless it finds ways to ensure that all its inhabitants benefit from growth and investment. This is the central challenge facing policy makers both in Holyrood and Westminster.
What should a new national economic strategy for Scotland include? What would the pursuit of stronger economic growth mean for local, national and UK-wide policy makers? How will economic change affect the jobs we do, the places we live and the businesses we work for? And what are the prospects for cities like Glasgow, and nations like Scotland, in rising to these challenges?
University of North Carolina at Charlotte degree offer diploma Transcripttscdzuip
办理美国UNCC毕业证书制作北卡大学夏洛特分校假文凭定制Q微168899991做UNCC留信网教留服认证海牙认证改UNCC成绩单GPA做UNCC假学位证假文凭高仿毕业证GRE代考如何申请北卡罗莱纳大学夏洛特分校University of North Carolina at Charlotte degree offer diploma Transcript
2. Winn-Dixie Board of Directors
As 0f June 27, 2007
Peter L. Lynch
Chairman
Evelyn V. Follit Jeffrey C. Girard Gregory P. Josefowicz
Audit Committee Audit Committee
Audit Committee Chair
Terry Peets
Yvonne R. Jackson Richard E. Rivera
Nominating & Corporate Compensation Committee
Compensation Committee Chair
Governance Committee Chair
Compensation Committee
James P. Olson
Charles P. Garcia
Nominating & Corporate
Governance Committee
Investor Inquiries:
Sheila Reinken, Vice President of Finance & Treasurer . SheilaReinken@Winn-Dixie.com
Eric Harris, Director of Investor Relations . EricHarris@Winn-Dixie.com
Copies of annual reports, Forms 10-K & 10-Q & other Winn-Dixie Stores, Inc. publications
are available online at www.winn-dixie.com or contact:
Winn-Dixie Stores, Inc.
. Jacksonville, Florida 32203-0297 . 904-783-5000
Post Office Box B
Transfer agent:
American Stock Transfer & Trust Company
59 Maiden Lane, Plaza Level . New York, New York 10038
www.amstock.com . 888-822-5593 . Foreign: 718-921-8124
3. A Message from Peter Lynch,
President, CEO & Chairman of the Board
Dear Shareholders:
On behalf of our more than 52,000 Associates, I am pleased to present our
first Annual Report as a new company. Since we emerged from Chapter 11 in
November 2006, Winn-Dixie has achieved a number of milestones, including:
Initiating a major store remodeling program aimed at increasing
traffic in our stores, with the first 20 stores completed by the
end of our fiscal 2007 year in late June;
Launching innovative merchandising and
marketing programs;
Making strides in improving customer service.
In fact, in a survey of 20,000 consumers by
the University of Michigan – the American
Consumer Satisfaction Index – Winn-Dixie
received its highest score ever in the
supermarket category, coming in second
– tied with Kroger and just behind Publix;
Strengthening our vendor relationships;
Strengthening our management team;
Listing our newly issued stock on the NASDAQ
Global Select Market; and
Delivering improved financial results for
the 2007 fiscal year.
I am very proud of our Associates and what we have
accomplished in regaining market share, strengthening
relationships with our customers and business partners,
and representing our brand.
From an investment standpoint, it is clear that
fiscal 2007 marked an important turning point for
Winn-Dixie. We have made significant progress in
the initial stage of our multi-year turnaround plan.
As a result of these efforts, I am pleased to note the
following highlights which are discussed in detail in
the attached form 10-K and in the year-end earnings
press release we issued in late August:
Winn-Dixie Stores, Inc. 2007 Annual Report
4. Net income of $28.5 million, or $0.53 per share for the 32 weeks ended June 27, 2007;
Gross margin of 26.9% for the 2007 fiscal year compared to 25.9% in the prior year, an increase
of 100 basis points;
An increase in identical store sales of 1.6% for the 2007 fiscal year;
Liquidity of $592.9 million at year-end, with no significant borrowings under the revolving credit
facility; and
A significant increase in the share price during the period from the first day of trading to the end
of the 2007 fiscal year.
As these financial achievements demonstrate, we have built a strong foundation to support the
implementation of our multi-year turnaround plan. This foundation is based on the following five
key initiatives:
1. Rebuilding Trust in Our Brand
Rebuilding trust in the Winn-Dixie brand is an ongoing process, something we focus on continually.
One of our important brand building initiatives is our Corporate Brands program. We are focusing
on our Corporate Brands as a means to offer better value to our customers, drive customer loyalty, and
improve profitability.
We are completely redesigning and re-launching our Corporate Brands program. As of late August,
approximately 150 of our “new generation” newly redesigned and reformulated Corporate Brands prod-
ucts were available in-store. Our goal is to have at least 1,000 SKUs on-shelf by the end of fiscal 2008.
We are offering three quality tiers. The first is “Thrifty Maid” -- a “Good” product line that
matches the national or regional “value” brands in quality. The second is “Winn-Dixie” -- a “Better” line
of products designed to be equal to or better than the comparable national or regional brand category
leader. And the third is “Winn & Lovett” -- a “Best” product line to include premium products that are
worth coming back for. We are also keeping a few of our popular sub-brands such as Chek beverages and
Kuddles baby products.
Our store teams are being educated about the Corporate Brands program and trained to communicate its
features to our customers. We also are developing a multi-faceted marketing program to support these
Corporate Brands. This program includes new packaging, advertising, sampling, and product guarantees.
2. Investing Capital in Our Stores
We believe our store remodeling program is one of our most important initiatives and will be a key driver
of increased store traffic in the years ahead. Our objective is to win back customers who left us previously
while continuing to attract new customers. In some locations, remodeled stores will allow us to compete
more effectively against new or remodeled stores opened nearby by competitors.
In fiscal 2007, we completed 20 store remodels. These stores have gone through a complete face lift
inside – including a new color scheme, new lighting, new flooring, new fixtures, a new layout, and some
new features – including more prepared food offerings and a fresh new produce section.
Winn-Dixie Stores, Inc. 2007 Annual Report
5. 3. Neighborhood Marketing
The purpose of our neighborhood merchandising and marketing programs is to focus on having the right
products for the neighborhoods we serve. By doing so, we will enhance customer satisfaction, drive more
traffic to our stores, increase the average basket size per customer store visit and help us maintain strong
margins.
For example, we received rave reviews from customers and favorable publicity from local and national
media for our kosher initiative. We are also receiving good feedback from customers in Hispanic markets
in Southern Florida, Orlando and Tampa, where we are continuing to develop programs to cater to the
needs of the local neighborhood.
4. Associate Training and Development
In early 2007 we realigned our retail organization to support a stronger focus on customer service and
execution of our marketing and merchandising plans. This realignment has allowed us to build a deeper
bench and provide a defined career path for our Associates – both of which serve to create an environ-
ment of growth, trust and excitement in one of the most crucial parts of our operation.
5. Achieving Profitable Sales
Our financial performance in the 2007 fiscal year was primarily driven by the execution of our turn-
around plan. A key component of that plan was our focus on offering balanced sales and promotional
programs which drove revenues higher while allowing us to maintain a profitable gross margin.
Going forward, we will continue to focus on the business fundamentals such as improving gross margin,
reducing expenses and implementing effective pricing and promotional programs. We will also keep a
strong focus on our store remodels, with 75 planned for completion in fiscal 2008.
In closing, I would like to thank our Associates, business partners and investors for your trust in and
loyalty to Winn-Dixie. We are dedicated to growing your investment and to serving as your neighbor-
hood grocer.
Winn-Dixie Stores, Inc. 2007 Annual Report
6. The Winn-Dixie Senior Management Team
Peter Lynch
President & Chief Executive Officer
Chairman, Board of Directors
Larry Appel
Senior Vice President & General Counsel
Anthony Austin
Senior Vice President of Human Resources
Frank Eckstein
Senior Vice President of Retail Operations
Dave Henry
Senior Vice President of Marketing
Bennett Nussbaum
Senior Vice President & Chief Financial Officer
Dan Portnoy
Senior Vice President
Chief Merchandising & Marketing Officer
Phil Pichulo
Group Vice President of Development
Chris Scott
Group Vice President of Logistics & Distribution
Charlie Weston
Group Vice President of Information Technology
Mark Sellers
Group Vice President of Operations
Regional Vice President, Jacksonville Region
Dan Lafever
Regional Vice President, Orlando Region
Joey Medina
Regional Vice President, New Orleans Region
Randy Rambo
Regional Vice President, Miami Region
Winn-Dixie Stores, Inc. 2007 Annual Report
7. United States
SECURITIES AND EXCHANGE COMMISSION
WASHINGTON, D. C. 20549
FORM 10-K
(Mark One)
ANNUAL REPORT PURSUANT TO SECTIONS 13 OR 15(d) OF
THE SECURITIES EXCHANGE ACT OF 1934
For the fiscal year ended June 27, 2007
OR
TRANSITION REPORT PURSUANT TO SECTION 13 OR 15(d) OF THE
SECURITIES EXCHANGE ACT OF 1934
For the transition period from _______________ to _______________
Commission File Number 1-3657
WINN-DIXIE STORES, INC.
(Exact name of registrant as specified in its charter)
Florida 59-0514290
(State or other jurisdiction of (IRS Employer
incorporation or organization) Identification No.)
5050 Edgewood Court, Jacksonville, Florida 32254-3699
(Address of principal executive offices) (Zip Code)
(904) 783-5000
(Registrant’s telephone number, including area code)
Securities registered pursuant to Section 12(b) of the Act:
Title of each class Name of each exchange on which registered
Common Stock, par value $0.001 per share The NASDAQ Stock Market LLC
Securities registered pursuant to Section 12(g) of the Act:
Title of each class
None
Indicate by check mark if the registrant is a well-known seasoned issuer, as defined in Rule 405 of the Securities Act.
Yes [ ] No [ ]
Indicate by check mark if the registrant is not required to file reports pursuant to Section 13 or Section 15(d) of the
Act. Yes [ ] No [ ]
Indicate by check mark whether the registrant (1) has filed all reports required to be filed by Section 13 or 15(d) of
the Securities Exchange Act of 1934 during the preceding 12 months (or for such shorter period that the registrant was
required to file such reports), and (2) has been subject to such filing requirements for the past 90 days. Yes [ ] No [ ]
Indicate by check mark if disclosure of delinquent filers pursuant to Item 405 of Regulation S-K is not contained
herein, and will not be contained, to the best of registrant’s knowledge, in definitive proxy or information statements
incorporated by reference in Part III of this Form 10-K or any amendment to this Form 10-K. [ ]
Indicate by check mark whether the registrant is a large accelerated filer, an accelerated filer, or a non-accelerated
filer. See definition of “accelerated filer and large accelerated filer” in Rule 12b-2 of the Exchange Act. (check one):
Large accelerated filer [ ] Accelerated filer [ ] Non-accelerated filer [ ]
Indicate by check mark whether the registrant is a shell company (as defined in Rule 12b-2 of the Exchange Act).
Yes [ ] No [ ]
The aggregate market value of the common stock held by non-affiliates of the registrant on January 10, 2007, was
approximately $543.6 million.
Indicate by check mark whether the registrant has filed all documents and reports required to be filed by Section 12,
13 or 15(d) of the Securities Exchange Act of 1934 subsequent to the distribution of securities under a plan confirmed by
a court. Yes [ ] No [ ]
As of August 10, 2007, 53,901,473 shares of Winn-Dixie Stores, Inc. common stock were outstanding.
DOCUMENTS INCORPORATED BY REFERENCE: Portions of the registrant’s Proxy Statement for the 2007
Annual Meeting of Shareholders are incorporated by reference in Part III hereof.
8.
9. WINN DIXIE STORES, INC.
ANNUAL REPORT ON FORM 10-K FOR THE YEAR ENDED JUNE 27, 2007
TABLE OF CONTENTS
Page
Number
PART I
Item 1. Business ..................................................................................................................... 1
Item 1A. Risk Factors .............................................................................................................. 5
Item 1B. Unresolved Staff Comments ...................................................................................... 10
Item 2. Properties ................................................................................................................... 10
Item 3. Legal Proceedings...................................................................................................... 10
Item 4. Submission of Matters to a Vote of Security Holders .............................................. 10
PART II
Item 5. Market for Registrant’s Common Equity, Related Stockholder Matters and
Issuer Purchases of Equity Securities ....................................................................... 11
Item 6. Selected Financial Data ............................................................................................ 13
Item 7. Management’s Discussion and Analysis of Financial Condition and Results of
Operations .................................................................................................................. 14
Item 7A. Quantitative and Qualitative Disclosures About Market Risk ................................. 27
Item 8. Financial Statements and Supplementary Data ........................................................ 28
Item 9. Changes in and Disagreements with Accountants on Accounting and Financial
Disclosure ................................................................................................................. 77
Item 9A. Controls and Procedures ............................................................................................ 77
Item 9B. Other Information ..................................................................................................... 81
PART III
Item 10. Directors, Executive Officers and Corporate Governance ....................................... 81
Item 11. Executive Compensation .......................................................................................... 83
Item 12. Security Ownership of Certain Beneficial Owners and Management and Related
Stockholder Matters................................................................................................... 83
Item 13. Certain Relationships and Related Transactions and Director Independence .......... 83
Item 14. Principal Accounting Fees and Services.................................................................... 83
PART IV
Item 15. Exhibits and Financial Statement Schedules ............................................................. 84
Signatures ................................................................................................................................. 87
10.
11. PART I
The following should be read in conjunction with the Consolidated Financial Statements and
Notes thereto included in Item 8 of this Annual Report on Form 10-K. Unless specified to the
contrary, all information herein is reported as of June 27, 2007, which was the end of our most
recently completed fiscal year.
As a result of the application of fresh-start reporting as discussed below, the Company’s
financial statements for periods prior to November 16, 2006, are not comparable to its
financial statements for periods on or after November 16, 2006. References to the “Successor”
refer to Winn-Dixie on or after November 16, 2006, after application of fresh-start reporting.
References to the “Predecessor” refer to Winn-Dixie prior to November 16, 2006. References
such as the “Company,” “we,” “our” and “us” refer to Winn-Dixie Stores, Inc. and its
consolidated subsidiaries, whether Predecessor and/or Successor, as appropriate.
Forward-Looking Statements
Certain statements made in this report, and other written or oral statements made by us
or on our behalf, may constitute “forward-looking statements” within the meaning of the
federal securities laws. Statements regarding future events and developments and our
future performance, as well as management’s expectations, beliefs, plans, estimates or
projections related to the future, are forward-looking statements within the meaning of
these laws. These forward-looking statements include and may be indicated by words or
phrases such as “anticipate,” “estimate,” “plans,” “expects,” “projects,” “should,” “will,”
“believes” or “intends” and similar words and phrases.
All forward-looking statements, as well as our business and strategic initiatives, are
subject to certain risks and uncertainties that could cause actual results to differ
materially from expected results. Management believes that these forward-looking
statements are reasonable. However, you should not place undue reliance on such
statements. These statements are based on current expectations and speak only as of the
date of such statements. We undertake no obligation to publicly update or revise any
forward-looking statement, whether as a result of future events, new information or
otherwise. Additional information concerning the risks and uncertainties that you may
wish to consider are described in “Item 1A: Risk Factors” of this Annual Report on Form
10-K and elsewhere in our filings with the Securities and Exchange Commission (the
“SEC”). A number of factors, many of which are described in “Item 1A: Risk Factors”
could cause our actual results to differ materially from the expected results described in
our forward-looking statements.
ITEM 1: BUSINESS
General
Founded in 1925, Winn-Dixie Stores, Inc. is a major food retailer operating primarily under
the “Winn-Dixie” and “Winn-Dixie Marketplace” banners. As of June 27, 2007, we operated
520 stores in five states in the southeastern United States.
1
12. We generate revenues and cash as we sell products to customers in our stores. We earn a profit
by selling these products at price levels in excess of our costs, which include procurement,
distribution, occupancy and overhead expenses. Our operations are within one reportable
segment. The Consolidated Financial Statements set forth in Item 8 below present our results
of operations, financial position and cash flows.
On November 21, 2006, we emerged from bankruptcy protection. See “Proceedings Under
Chapter 11 of the Bankruptcy Code” below for further information.
Proceedings Under Chapter 11 of the Bankruptcy Code
Emergence from Bankruptcy Protection: On February 21, 2005 (the “Petition Date”), Winn-
Dixie Stores, Inc. and 23 then-existing direct and indirect wholly-owned subsidiaries
(collectively, the “Debtors”) filed voluntary petitions for reorganization under Chapter 11 of
the United States Bankruptcy Code (“Chapter 11” or the “Bankruptcy Code”) in the United
States Bankruptcy Court (the “Court”). Two of the then-existing wholly-owned subsidiaries of
Winn-Dixie Stores, Inc. (collectively with the Debtors, the “Company” or “Winn-Dixie”) did
not file petitions under Chapter 11. On November 9, 2006, the Court entered its order
confirming the Debtors’ modified plan of reorganization (the “Plan” or the “Plan of
Reorganization”; see Item 15, Exhibits 2.1 and 2.2). Although certain objecting parties
appealed the confirmation order, they did not seek a stay of the order. In the absence of a stay,
the Debtors were free to implement the Plan notwithstanding the pendency of the appeals. The
Plan became effective and the Debtors emerged from bankruptcy protection on November 21,
2006 (the “Effective Date”). The appeals remain pending.
Fresh-Start Reporting: Upon emergence from bankruptcy protection, we adopted the “fresh-
start reporting” provisions of the American Institute of Certified Public Accountants’
Statement of Position 90-7 “Financial Reporting by Entities in Reorganization under the
Bankruptcy Code” (“SOP 90-7”), effective November 15, 2006, which was the end of our
immediately preceding accounting period. Under fresh-start reporting, a new reporting entity
was deemed to have been created, and all assets and liabilities were revalued to their fair
values (see Item 8, Note 1 for further information). Accordingly, our financial statements for
periods prior to November 16, 2006, are not comparable to our financial statements for periods
on or after November 16, 2006.
Discharge and Treatment of Claims and Interests: As of the Effective Date, the Debtors were
discharged and released from all claims and interests in accordance with the provisions of the
Plan. The Plan provided for payment in full in cash, satisfaction on deferred payment terms or
reinstatement of allowed administrative, priority and secured claims, and the distribution of
shares of new Winn-Dixie common stock in satisfaction of allowed unsecured claims. During
the course of the Chapter 11 proceedings, we successfully reached settlements with most of our
creditors and resolved most pending claims against the Debtors. However, the claims
resolution process continues for certain claims. For details, see Item 8, Note 1.
Under the Plan, 400 million shares of new common stock were authorized under the amended
and restated articles of incorporation of Winn-Dixie Stores, Inc. Pursuant to the terms of the
Plan, 54 million shares of new common stock were issued to the Company’s disbursing agent
for distribution to unsecured creditors. All such shares were issued without registration under
the Securities Act of 1933, as amended, or state securities laws, in reliance on Section 1145 of
2
13. the Bankruptcy Code. In addition, 5.4 million shares were reserved for issuance under the
Company’s equity incentive plan. The Successor’s common stock trades on the NASDAQ
Global Market under the symbol “WINN.”
Pursuant to the Plan, on the Effective Date, all shares of the Predecessor’s common stock were
canceled and no distribution was made to holders thereof.
Exit Financing: On the Effective Date, we closed on a $725.0 million senior secured
revolving credit facility (the “Credit Agreement”). See Item 7, “—Liquidity and Capital
Resources,” below for further discussion of the Credit Agreement.
Stores
The following chart identifies each of our markets by state and retail market area, the number
of stores in each market area and the banners under which they operate as of June 27, 2007.
We operate our grocery warehouse stores under the “SaveRite” banner.
Winn Dixie/
Total Marketplace SaveRite
Florida 358 350 8
Orlando / Daytona 79 75 4
Miami / Fort Lauderdale 77 77 -
Tampa /St. Petersburg 62 61 1
Jacksonville 49 46 3
West Palm Beach / Fort Pierce 36 36 -
Mobile / Pensacola 14 14 -
Fort Myers / Naples 16 16 -
Tallahassee 10 10 -
Panama City 10 10 -
Gainesville 5 5 -
Alabama 73 73 -
Birmingham 27 27 -
Mobile / Pensacola 20 20 -
Montgomery 16 16 -
Other 10 10 -
Georgia 22 22 -
Albany 6 6 -
Other 16 16 -
Louisiana 51 51 -
New Orleans 32 32 -
Baton Rouge 11 11 -
Lafayette 8 8 -
Mississippi 16 13 3
Biloxi / Gulfport 6 6
Other 10 7 3
Total stores as of June 27, 2007 520 509 11
3
14. The following chart provides selected information related to our stores for the last five fiscal
years:
2007 2006 2005 2004 2003
Opened during fiscal year 2 - 3 11 13
Closed or sold during fiscal year 21 374 139 35 13
In operation at fiscal year-end 520 539 913 1,049 1,073
Year-end average store square footage (in thousands) 46.8 46.3 45.2 44.6 44.4
Merchandising
Substantially all of our stores offer grocery, meat, seafood, produce, deli, bakery, floral, health
and beauty, and other general merchandise items. We had 401 pharmacies, 59 liquor stores and
5 fuel centers at our stores as of June 27, 2007.
We offer national brands as well as many of our own private-label products. These products
are delivered from our distribution centers or directly to stores from manufacturers and
wholesalers.
Competition
We compete directly with national, regional and local supermarket chains in addition to
independent supermarkets. We also compete with super-centers and other non-traditional
grocery retailers such as dollar-discount stores, drug stores, convenience stores, warehouse
club stores and conventional department stores. We compete based on price, product quality,
variety, location, service, convenience, and store condition. In addition to retailers, we also
face competition from restaurants and fast-food chains due to the increasing trend of
consumers purchasing and consuming food away from home. The number and type of
competitors varies by location, as does our competitive position across our markets.
Suppliers and Raw Materials Sources
We receive the products sold in our stores and the raw materials used in our manufacturing
operations from a number of sources. We are not dependent on a single or relatively few
suppliers. We believe that the products we sell and the raw materials we use are available in
sufficient quantities to meet customer demand adequately. As with any supermarket, many
brands have high consumer recognition. Though we may be able to find alternate suppliers for
a particular type of product, we would likely experience negative customer response if we
were unable to supply a particular brand of product.
Trademarks
We actively enforce and defend our rights related to our intellectual property portfolio. In
addition to the Winn-Dixie trademark, we own approximately 80 other trademarks that are
registered or pending as applications in the United States Patent and Trademark Office.
4
15. Seasonality
Due to the influx of winter residents to the Southeast, particularly Florida, and increased
purchases of food items for the holidays that occur from November through April, our sales are
typically higher during these months as compared to the rest of the year.
Working Capital
As of June 27, 2007, working capital was comprised of $1.0 billion of current assets and
$542.3 million of current liabilities. Normal operating fluctuations in these substantial balances
can result in changes to cash flows from operating activities as presented in the Consolidated
Statements of Cash Flows that are not necessarily indicative of long-term operating trends.
There are no unusual industry practices or requirements related to working capital items.
Environmental Matters
We are subject to federal, state and local environmental laws that apply to store operations,
property ownership and property development. We may be subject to certain environmental
regulations regardless of whether we lease or own stores or land, or whether environmental
conditions were created by the owner, a prior tenant or us. We believe that compliance with
such laws and regulations has not had a material effect on our capital expenditures, operating
results or competitive position.
Employees
As of June 27, 2007, we employed approximately 52,000 associates, of whom approximately
57% were employed on a part-time basis. None of our associates is covered by a collective
bargaining agreement.
Additional Information
We are a Florida corporation, headquartered at 5050 Edgewood Court, Jacksonville, Florida
32254-3699. Our telephone number is 904-783-5000.
Our web site, www.winn-dixie.com, provides additional information about our Company.
There you can obtain, free of charge, Annual Reports on Form 10-K, Quarterly Reports on
Form 10-Q, Current Reports on Form 8-K and all of our other filings with the SEC, including
amendments thereto. You can also obtain copies of all of our recent press releases. Our web
site also contains important information about our corporate governance practices, including
our Code of Conduct, information on the members of our Board of Directors, our Governance
Principles and our Board Committee Charters. The information on our web site is not part of
and is not incorporated by reference into this Annual Report on Form 10-K.
ITEM 1A: RISK FACTORS
Our business and strategic initiatives are subject to certain risks and uncertainties that could
cause actual results to differ materially from expected results. Additional information
concerning the risks and uncertainties listed below, and other factors that you may wish to
consider, are contained elsewhere in our filings with the SEC.
5
16. Our store remodeling initiative is at an early stage of implementation and the program
may not be effective in improving customer count trends, sales and profitability.
For the past several years, we have had limited store remodeling activity. Stores in need of
remodeling are at risk of sales erosion, particularly when they compete with newer or better-
maintained competitor facilities. During fiscal 2008 and in future fiscal years, we plan to
remodel approximately 75 stores per year. At that rate of remodel activity, given that we
believe the substantial majority of our stores require a remodel, it will take several years for us
to complete this current remodel initiative.
Our remodel initiative is a key element in our business plan. We believe remodels are
necessary to enhance our brand image, improve our merchandising mix and customer count
trends and ultimately to improve sales and profitability. We opened 20 remodeled stores in
fiscal 2007, most in the fourth quarter, and we are monitoring initial results. Because the
initiative is still at an early stage of implementation, it is impossible to definitively assess the
long-term impact the remodel initiative will have on these key financial and business metrics.
If the remodel initiative were not successful in achieving these goals, this would have a
significant negative impact on our business.
We operate in a highly competitive industry and actions taken by our competitors can
negatively impact our results of operations.
We face competition from both traditional grocery stores and non-traditional grocery retailers
such as mass merchandisers, super-centers, warehouse club stores, dollar-discount stores, drug
stores, convenience stores and restaurants. Actions of our competitors can negatively impact
our business, particularly competitor investments in their store base and increased competitor
promotional activity.
Over the past several years, we have experienced a significant number of competitor store
openings in our operating regions. In fiscal 2007, a significant number of grocery stores and
super-centers opened in locations that we believe negatively impacted sales levels at one or
more of our stores. We expect competitor store openings to continue to significantly impact
our business in fiscal 2008, although at a slightly lower level than the prior fiscal year.
Pricing is a significant driver of consumer choice in our industry and we regularly engage in
price competition, particularly through our promotional programs. To the extent that our
competitors lower prices, through increased promotional activity or otherwise, our ability to
maintain gross margin rates and sales levels may be negatively impacted. Several of our
primary competitors are larger than we are, have greater financial resources available to them
and, therefore, may be able to devote greater resources to invest in pricing and promotional
programs.
There can be no assurance that increased competitor activity will not negatively impact our
business or that we will have sufficient resources to respond to competitor investments in their
store base and pricing and promotional programs.
Improving our gross margin rate, particularly in the first half of our fiscal year, is a
significant element in our plan to increase overall profitability. Furthermore, given our
6
17. current level of operating profitability, a relatively small reduction in gross profit margin
can have a material, negative impact on our financial condition and results of operations.
During fiscal 2007, we realized a lower gross margin rate in the first half of the fiscal year than
in the second half of the fiscal year. The improved gross margin rate in the second half of the
fiscal year, a trend consistent with our most recent operating performance in the last several
years, significantly impacted our profitability in the second half of the fiscal year. Our business
plan anticipates that we will improve our gross margin rate in fiscal 2008, with the most
significant improvement occurring in the first half of the fiscal year.
Given our current level of earnings from continuing operations, relatively small fluctuations in
gross margin rate can have a significant impact on our profitability. Our inability to manage
our gross margin rate effectively could have a material, negative impact on our profitability
and liquidity.
To achieve levels of profitability consistent with most of our industry peers will require
us to increase significantly our average sales-per-store.
Our sales-per-store are significantly less than that of our competitors. Because many operating
costs – such as rent, utilities and minimum labor staffing levels – are largely fixed, low levels
of sales productivity negatively impact profitability. To achieve levels of profitability
consistent with most of our industry peers will require us to increase our average sales-per-
store, while at the same time improving gross margin rates (as discussed above).
Our sales increases in fiscal 2007 resulted from increasing basket size, which offset a declining
transaction count. To improve transaction count, we believe we must enhance our brand image
through implementation of our remodel initiative, improved merchandising programs and
improved customer service in our stores. These initiatives, in particular the remodel initiative,
are multi-year initiatives. There can be no assurance that we can implement these initiatives
successfully or that they will be effective in attracting new customers into our stores and
ultimately improving our transaction counts and sales-per-store.
Failure to attract, train and retain qualified associates could adversely affect our
financial performance.
The retail food industry is labor intensive. Our ability to meet our labor needs, while
controlling wage and labor related costs, is subject to numerous external factors, including the
availability of a sufficient number of qualified persons in the work force of the markets in
which we are located, unemployment levels within those markets, prevailing wage rates,
changing demographics, health and other insurance costs, and changes in employment
legislation.
Furthermore, to improve our brand image we believe we must enhance in-store merchandising,
customer service and other programs. To achieve these goals, we believe we must upgrade
some of our store-level leadership teams. In addition, certain planned initiatives, such as
enhancements to our deli and prepared foods offerings, will require new skill sets. As a result,
our future business success is dependent upon our ability to effectively train our existing
associates and to hire new associates possessing the necessary skill sets.
7
18. The concentration of our locations in the southeast increases our vulnerability to severe
storm damage, which could adversely affect our operations and financial results.
Our operations are concentrated in Florida and in other states along the Gulf of Mexico and the
Atlantic Ocean, which increases the likelihood of being affected negatively by hurricanes and
windstorm activity. Specific risks that we face include the following:
while we have targeted placement of generators in stores we believe are most likely to
be impacted by hurricanes, we have not implemented a comprehensive program to
place generators in every store;
we have named windstorm insurance limits of $125 million per occurrence in excess of
a $10 million named windstorm deductible per occurrence;
our ability to collect on insurance coverage, which is subject to the solvency of our
insurance carriers, their approval of our claims and the timing of claims processing and
payment;
our ability to fund losses of inventory and other costs in advance of receipt of insurance
payments; and
our ability to re-open stores that may close as a result of damage to the store and/or the
operating area.
Food safety issues could negatively impact our brand image, operations and financial
results.
We could be adversely affected if consumers lose confidence in the safety and quality of our
food products. Adverse publicity about these types of concerns, whether or not valid, may
discourage consumers from buying our products or cause production and delivery disruptions.
The real or perceived sale of contaminated food products by us could result in product liability
claims and a loss of consumer confidence, which could have a significant negative effect on
our sales and operations.
Additionally, to the extent we are unable to maintain appropriate sanitation and quality
standards in our stores, food safety and quality issues could involve expense and damage to our
brand names.
Our net operating loss carry forwards may be limited.
We currently have a material amount of net operating loss carry forwards (“NOLs”) for federal
income tax purposes that will begin to expire in eighteen years. Additionally, as we settle the
remaining bankruptcy claims, our NOLs will increase by an amount equal to the market value
of shares distributed as of the date of distribution. If we were to undergo a subsequent change
of ownership within the meaning of §382 of the Internal Revenue Code (the “IRC”), our ability
to utilize our federal NOLs could be further limited or eliminated entirely.
To avoid a potential adverse effect on our ability to utilize our NOLs for federal income tax
purposes, we amended our Articles of Incorporation to include certain restrictions on the
transfer of our stock that may apply in certain circumstances and for a limited period of time.
While the purpose of these transfer restrictions is to prevent a subsequent change of ownership
within the meaning of §382 of the IRC from occurring, no assurance can be given that such an
ownership change will not occur, in which case the availability of our NOLs and other federal
income tax attributes would be significantly limited or eliminated entirely.
8
19. Unsuccessful implementation of information technology could limit our ability to operate
efficiently and compete effectively.
We are dependent on large, complex information technology systems for many of our core
business processes. During fiscal 2008, we will be implementing a new information
technology system to support our retail pricing policies and practices. Unsuccessful upgrades
or implementations of this or other information technology systems could have an adverse
effect on our financial condition and results of operations. Additionally, any internal or
external disruptions (i.e. natural or other disaster) to our information technology infrastructure
could significantly impact our operations.
If we do not maintain the security of customer-related information, we could damage our
reputation with customers, incur substantial additional costs and become subject to
litigation.
As do most retailers, we receive certain personal information about our customers, some of
which depends upon the secure transmission of confidential information over public networks.
A compromise of our security systems that results in customer personal information being
obtained by unauthorized persons could adversely affect our reputation with our customers and
others, as well as our operations, results of operations, financial condition and liquidity, and
could result in litigation against us or the imposition of penalties.
Variability in self-insurance liability estimates could significantly impact our financial
results.
We self-insure for workers’ compensation, general liability, business interruptions, automobile
liability, property losses and employee medical coverage up to a set retention level, beyond
which we maintain excess insurance coverage. Liabilities are determined using actuarial
estimates of the aggregate liability for claims incurred and an estimate of incurred but not
reported claims, on an undiscounted basis. Our accruals for insurance reserves reflect certain
actuarial assumptions and management judgments, which are subject to a high degree of
variability. The variability is caused by factors external to us such as:
historical claims experience;
medical inflation;
legislative changes to benefit levels;
jury verdicts; and
claim settlement patterns.
Any significant variation in these factors could cause a material change to our reserves for self-
insurance liabilities as well as earnings.
Litigation or legal proceedings could expose us to significant liabilities and thus
negatively affect our financial results.
We are party to various litigation claims and legal proceedings, including personnel and
employment issues, personal injury, and other claims and proceedings arising in the ordinary
course of business. We evaluate these litigation claims and legal proceedings to assess the
likelihood of unfavorable outcomes and to estimate, if possible, the amount of potential losses.
9
20. Based on these assessments and estimates, if any, we establish reserves and/or disclose the
relevant litigation claims or legal proceedings as appropriate. These assessments and estimates
are based on the information available to management at the time and involve a significant
amount of management judgment. Actual outcomes or losses may differ materially from those
envisioned by our current assessments and estimates, which could adversely affect our results
of operations and financial condition.
Changes in laws and other regulations affecting our industry could increase our
compliance costs.
We are subject to numerous federal, state and local laws and regulations affecting food
manufacturing, distribution, retailing, accounting standards and taxation requirements. Any
changes in these laws or regulations could significantly increase our compliance costs and
adversely affect our results of operations, financial condition and liquidity.
ITEM 1B: UNRESOLVED STAFF COMMENTS
None.
ITEM 2: PROPERTIES
Our corporate headquarters are located in Jacksonville, Florida. Our stores are located in the
southeastern United States, as further detailed in Item 1. We believe that all of our properties
are in adequate condition for their intended use. We lease substantially all of our facilities.
Each lease provides for a minimum annual rent, while certain store leases also require
contingent rental payments if sales volumes exceed specified amounts.
The following table details the properties utilized in our operations as of June 27, 2007:
Owned Leased Total
Retail Stores 8 512 520
Manufacturing Operations 1 2 3
Distribution Centers 1 5 6
Corporate Headquarters - 1 1
Total 10 520 530
A more detailed description of our leasing arrangements appears in Item 8, Note 14.
ITEM 3: LEGAL PROCEEDINGS
See Note 17 to the Consolidated Financial Statements included in Item 8 of this Report for a
discussion of legal proceedings.
ITEM 4: SUBMISSION OF MATTERS TO A VOTE OF SECURITY HOLDERS
No matters were submitted to a vote of security holders during the fourth quarter of the fiscal
year covered by this report.
10
21. PART II
ITEM 5: MARKET FOR THE REGISTRANT’S COMMON EQUITY, RELATED
STOCKHOLDER MATTERS AND ISSUER PURCHASES OF EQUITY
SECURITIES
Winn-Dixie’s common stock is currently traded on the NASDAQ Global Market
(“NASDAQ”) under the symbol WINN. The shares were listed for trading on NASDAQ on
December 21, 2006. From our emergence from bankruptcy on November 21, 2006, until
December 21, 2006, the shares traded on NASDAQ on a “when-issued” basis. The number of
holders of record of our common stock as of August 10, 2007, was 1,457. Approximately 78%
of our outstanding common stock is held in “street name” by depositories or nominees on
behalf of beneficial holders.
We did not pay dividends during fiscal 2007 or fiscal 2006. Under the terms of our Credit
Agreement, we are restricted substantially from paying dividends.
The following table shows the high and low closing prices of the Company’s common stock
for each fiscal quarter subsequent to our emergence from bankruptcy:
High Low
Fiscal 2007:
Second Quarter, subsequent to November 21, 2006 $ 15.99 10.95
Third Quarter $ 19.58 13.19
Fourth Quarter $ 32.14 17.35
We did not repurchase any of our equity securities during the fourth quarter of fiscal 2007.
11
22. The following graph shows the cumulative total shareholder return for the Company’s
common stock during the period from November 22, 2006, to June 27, 2007. Five-year
historical data is not presented because the Predecessor’s stock was cancelled upon our
emergence from Chapter 11.
The graph also shows the cumulative returns of the Standard & Poor’s 500 Index and a peer
group of food retailers, comprised of: Supervalu Inc., The Kroger Co., Safeway Inc., and The
Great Atlantic & Pacific Tea Company, Inc. The comparison assumes $100 was invested on
November 22, 2006 (the date WINN began trading on NASDAQ), in the Company’s common
stock and in each of the indices shown and assumes that all dividends paid were reinvested.
Comparison of 4 Quarter Cumulative Total Return
Assumes Initial Investment of $100
June 2007
$300.00
$250.00
$200.00
$150.00
$100.00
$50.00
$0.00
11/22/06 1/10/07 4/4/07 6/27/07
Winn-Dixie Stores Inc. S&P 500 Index - Total Return Peer Group
12
23. ITEM 6: SELECTED FINANCIAL DATA
We derived the financial data below from our audited Consolidated Financial Statements
included in Item 8 of this report and from our previously issued audited financial statements.
We reclassified all necessary data to reflect discontinued operations, as described in Note 15 of
the Consolidated Financial Statements. The following table should be read in conjunction with
“Management’s Discussion and Analysis of Financial Condition and Results of Operations”
and our Consolidated Financial Statements, included in Item 7 and Item 8, respectively, of this
report. As a result of the application of fresh-start reporting in accordance with SOP 90-7, the
Company’s financial statements for period prior to November 16, 2006 are not comparable to
its financial statements for periods on or after November 16, 2006.
In millions, except per share data Successor Predecessor
32 weeks 20 weeks
Fiscal
ended June ended Nov.
2004 1
27, 2007 15, 2006 2006 2005 2003
Results of continuing operations:
Net sales $ 4,524 2,677 7,133 6,945 7,305 7,516
Gross profit $ 1,229 707 1,851 1,813 1,985 2,190
Other operating and administrative expenses $ 1,188 776 1,991 1,929 1,966 1,947
Impairment and restructuring charges, net $ - 22 7 190 22 -
Earnings (loss) before reorganization items and
$ 45 (97) (159) (339) (17) 256
income taxes
Reorganization items, net gain $ - (334) (251) (148) - -
Earnings (loss) from continuing operations $ 28 252 102 (381) (8) 200
Earnings (loss) per share from continuing operations:
Basic and diluted $ 0.53 1.78 0.72 (2.70) (0.05) 1.42
Cash dividends per share: $ - - - - 0.15 0.20
Successor Predecessor
32 weeks 20 weeks
ended June ended Nov.
2004 1
Financial data as of fiscal period end: 27, 2007 15, 2006 2006 2005 2003
$ 69 24 31 111 204 177
Capital expenditures
Working capital 2 $ 480 469 421 810 412 455
Total assets $ 1,671 1,692 1,608 1,987 2,619 2,790
Liabilities subject to compromise $ - - 1,118 1,111 - -
Long-term debt 2 $ - - - 245 301 311
Capital lease obligations - long term $ 19 9 5 11 13 21
Shareholders’ equity (deficit) $ 797 759 (282) 59 917 1,029
1
Fiscal 2004 was comprised of 53 weeks.
2
For fiscal 2006 and fiscal 2005, working capital and long-term debt excluded liabilities subject to compromise. Long-
term debt included long-term borrowings under the DIP Credit Facility.
13
24. ITEM 7: MANAGEMENT’S DISCUSSION AND ANALYSIS OF FINANCIAL
CONDITION AND RESULTS OF OPERATIONS
“Management’s Discussion and Analysis of Financial Condition and Results of Operations”
contains forward-looking statements and statements of our business strategies, all of which are
subject to certain risks. Item 7 should be read in conjunction with the information contained in
“Forward-Looking Statements” at the beginning of this report and with the Consolidated
Financial Statements and Notes thereto included in Item 8. When multiple factors are provided
as the explanation for business results, we quantify the approximate effect of each factor to the
extent that it is practical for us to do so.
COMBINED FINANCIAL RESULTS OF THE PREDECESSOR AND SUCCESSOR
As a result of the application of fresh-start reporting in accordance with SOP 90-7, the
Company’s financial statements for periods prior to November 16, 2006, are not comparable
to its financial statements for periods on or after November 16, 2006. References to the
“Successor” refer to Winn-Dixie on or after November 16, 2006, after application of fresh-start
reporting. References to the “Predecessor” refer to Winn-Dixie prior to November 16, 2006.
References such as the “Company,” “we,” “our” and “us” refer to Winn-Dixie Stores, Inc. and
its consolidated subsidiaries, whether Predecessor and/or Successor, as appropriate. See Item
8, Note 1 for further information.
Management’s discussion and analysis of the results of operations and of liquidity compare the
fiscal year ended June 27, 2007, to the fiscal year ended June 28, 2006. Presentation of the
combined financial information of the Predecessor and Successor for the fiscal year ended June
27, 2007, is not in accordance with generally accepted accounting principles. However, we
believe that for purposes of discussion and analysis in this Form 10-K, the combined financial
results are useful for management and investors to assess the Company’s on-going financial
and operational performance and trends.
PROCEEDINGS UNDER CHAPTER 11 OF THE BANKRUPTCY CODE
On November 21, 2006, Winn-Dixie Stores, Inc., and 23 of our then-existing subsidiaries
emerged from bankruptcy protection. For further discussion of the Chapter 11 cases see “Item
1: Business – Proceedings Under Chapter 11 of the Bankruptcy Code” above.
RESULTS OF OPERATIONS
Continuing Operations
Fiscal year ended June 27, 2007 (“fiscal 2007”), as compared to fiscal year ended June 28,
2006 (“fiscal 2006”)
Net Sales. Net sales were $7.2 billion for fiscal 2007, an increase of $68.1 million or 1.0%, as
compared to fiscal 2006. Net sales primarily related to grocery and supermarket items. In
aggregate, pharmacy, fuel and floral department sales comprised approximately 10% of net
sales in both fiscal 2007 and fiscal 2006.
14
25. We define identical store sales as sales from continuing operations stores, including stores that
we remodeled or enlarged during the year and excluding stores that opened or closed during
the year. Identical store sales increased 1.6% for fiscal 2007 as compared to fiscal 2006.
The increase in our identical store sales for fiscal 2007 as compared to fiscal 2006 was the
result of an increase in basket size (average sales per customer visit on identical store sales) of
3.4%, offset by a decrease in transaction count (number of customer visits on identical store
sales) of 1.7%.
Competition remains a key factor that negatively affects our identical store sales, particularly
on the opening of a new competitor store. Based on our knowledge of competitor activity in
our operating areas, we anticipate that competitor store openings will continue to affect our
identical store sales negatively, but will be slightly lower in fiscal 2008 than in fiscal 2007. We
consider competitive activity as we determine the schedule of stores to be remodeled.
Identical store sales for fiscal 2008 are expected to be slightly positive.
Gross Profit on Sales. Gross profit on sales increased $85.8 million for fiscal 2007 as
compared to fiscal 2006. As a percentage of net sales, gross margin was 26.9% and 25.9% for
fiscal 2007 and fiscal 2006, respectively.
The gross margin improvement of approximately 100 basis points in fiscal 2007 as compared
to fiscal 2006 was attributable to cost reductions in procurement, warehousing and
transportation (60 basis points), reduced inventory shrink (30 basis points), and increases in
vendor allowances (10 basis points).
We expect that gross margin in fiscal 2008 will be higher than gross margin in fiscal 2007,
with most of the increase occurring in the first two quarters of the fiscal year.
Other Operating and Administrative Expenses. Other operating and administrative expenses
decreased $26.3 million for fiscal 2007 as compared to fiscal 2006. As a percentage of net
sales, other operating and administrative expenses were 27.3% and 27.9% for fiscal 2007 and
fiscal 2006, respectively.
15
26. The table below details the increases (decreases) in other operating and administrative
expenses for fiscal 2007 as compared to fiscal 2006:
Increase (decrease) related to (in millions):
Bankruptcy-related costs:
Cancellation of Predecessor share-based compensation $ 9.2
Directors' and officers' liability insurance 8.1
Post-emergence bankruptcy-related legal and professional fees 11.7
Favorable settlements of claims, net (8.9)
Bankruptcy-related costs 20.1
Other than bankruptcy-related:
Depreciation and amortization (29.1)
Vacant store lease expense (13.3)
Rent (8.3)
Payroll and related costs (5.6)
Property and casualty insurance (2.0)
Utilities 7.4
Other, net 4.5
Other cost decreases, net (46.4)
Net decrease in other operating and administrative expenses $ (26.3)
We expect legal and professional fees related to our emergence from bankruptcy to decline as
we complete claims resolution and other emergence processes over approximately the next two
fiscal years. The decrease in depreciation and amortization was caused by lower aggregate
asset values, which resulted from fresh-start reporting revaluations, prior impairments and
recent low levels of capital expenditures. We anticipate that depreciation and amortization will
continue to be lower than the comparable prior period until the comparable prior period is
subsequent to November 15, 2006, or until capital expenditures significantly increase. Vacant
store lease expense incurred in fiscal 2006 related to closed stores did not occur to the same
magnitude in fiscal 2007. We do not expect vacant store lease expense to be significant in
fiscal 2008. The decrease in rent was primarily due to equipment rent reductions that resulted
from renegotiations of leases. Utilities expense increased due to higher rates in fiscal 2007.
The decrease in payroll and related costs primarily related to reductions in retail payroll,
benefits and bonuses. Property and casualty insurance expense decreased, as higher premium
rates were more than offset by favorable claims development of $17.4 million recognized in
the fourth quarter of fiscal 2007 based on the results of our actuarial study performed and
primarily related to self-insured workers’ compensation claims (see Item 8, Note 16).
Impairment Charges. Impairment charges were $20.8 million and $14.8 million in fiscal 2007
and fiscal 2006, respectively, all of which were recorded by the Predecessor. See Item 8, Note
8 for further discussion of impairment charges.
Reorganization Items. Reorganization items resulted in net gains of $334.4 million and $251.2
million in fiscal 2007 and fiscal 2006, respectively, all of which were recorded by the
Predecessor. See Item 8, Note 1 for further discussion of reorganization items.
16
27. Interest (Income) Expense, net. Interest (income) expense, net, is primarily interest on long-
term and short-term debt and capital leases, offset by interest income. For fiscal 2007, net
interest expense was $1.4 million, as compared to net interest expense of $12.0 million for
fiscal 2006. The improvement was due to $4.5 million of interest income on cash and
marketable securities balances, a $3.9 million reduction in interest expense on our credit
facilities due to decreased borrowings in fiscal 2007, a $2.9 million reduction of amortization
of debt issue costs on our credit facilities, and $1.8 million of interest income related to an
income tax refund. These improvements were partially offset by $2.3 million of interest
expense on amounts owed for pre-petition property taxes. In accordance with SOP 90-7, from
the Petition Date through the Effective Date, interest income was classified within
reorganization items rather than in interest (income) expense, net.
Income Taxes. Income tax expense for fiscal 2007 was $3.0 million, as compared to an income
tax benefit of $9.6 million for fiscal 2006. The expense will not result in significant cash
payments due to the availability of NOLs, as further described below. The effective tax rate on
continuing operations was a provision of 37.4% for the 32 weeks ended June 27, 2007, and a
benefit of 5.9% for the 20 weeks ended November 15, 2006, as compared to a benefit of 10.5%
for fiscal 2006. The rate for the 32 weeks ended June 27, 2007, reflected the provision of tax
expense for the period subsequent to our emergence from bankruptcy. The rate for the 20
weeks ended November 15, 2006, reflected the maintenance of a full valuation allowance, our
ability to carry back certain NOLs and an $11.6 million benefit associated with the resolution
of a state tax matter. The fiscal 2006 rate reflected the maintenance of a full valuation
allowance against our deferred tax assets, as well as our ability to carry back certain NOLs and
certain refundable credits.
We maintain a full valuation allowance against substantially all of our net deferred tax assets.
The valuation allowance will be maintained until there is sufficient positive evidence to
conclude that it is more likely than not that the net deferred tax assets will be realized.
As of June 27, 2007, we had $479.6 million of NOL carryforwards for federal income tax
purposes. As we settle the remaining bankruptcy claims, our NOL carryforwards will increase
by an amount equal to the market value of shares distributed as of the date of distribution. If all
remaining claims had been settled and all 8 million shares held by the disbursing agent had
been distributed in satisfaction of pending claims as of June 27, 2007, we estimate our NOL
carryforwards would have increased by approximately $240 million (the market price of our
common stock was approximately $30.00 per share as of such date). See Item 8, Note 1 for
additional information related to the claims resolution process.
The ultimate utilization of our NOL carryforwards and other tax attributes will depend on
several factors, including our future financial performance and certain federal income tax
qualifications and elections under §382 of the IRC. Management currently expects to qualify
under §382(l)(5) and make this election in its fiscal 2007 return. Under §382(l)(5), we will
have unlimited use of our NOLs if there is not a change of ownership (as defined by the IRC)
before November 9, 2008. If we do not qualify under, or elect out of, §382(1)(5), we will be
subject to an annual limitation on the use of our NOLs and certain deductions under §382(l)(6),
which may limit our ability to fully utilize the NOL carryforwards discussed above. To
preserve the NOL carryforwards available to us after emergence, the Successor’s Articles of
Incorporation impose certain restrictions on the transfer of our common stock.
17
28. The benefits associated with any future recognition of tax attributes that existed at the time of
emergence do not reduce income tax expense. Instead, the benefits first reduce intangible
assets to $0 and then increase shareholders’ equity. For the 32 weeks ended June 27, 2007, we
recognized tax attributes that existed as of November 15, 2006, totaling $19.8 million and
thereby reduced intangible assets by this amount.
Effective November 15, 2006, we adopted FASB Interpretation No. 48, “Accounting for
Uncertainty in Income Taxes – An Interpretation of FASB Statement No. 109” (“FIN 48”),
which prescribes a recognition threshold and measurement attribute for the financial statement
recognition and measurement of a tax position taken or expected to be taken in a tax return.
This interpretation also provides guidance on derecognition, classification, interest and
penalties, accounting in interim periods, disclosure and transition. As of June 27, 2007, we had
$21.5 million of unrecognized tax benefits; if recognized, none of this amount would change
our effective income tax rate. We do not anticipate that we will record any significant change
in the unrecognized tax benefit during fiscal 2008.
We are in the process of executing a settlement with the Internal Revenue Service (“IRS”) in
connection with its examination of our federal income tax returns for fiscal years 2003 and
2004. While the IRS’ examination of these tax returns will result in approximately $11 million
of total net adjustments to income for these two years, these adjustments to income will be
fully offset by a portion of our net operating losses and no additional tax should be incurred.
Other than the IRS examination referenced above, we are not currently subject to any pending
examinations of our federal or state income tax returns. Generally, the statute of limitations
remains open for our federal and state income tax returns for our fiscal 2003 through 2006 tax
years.
Net Income From Continuing Operations. Net income from continuing operations was $280.3
million for fiscal 2007, as compared to $101.6 million for fiscal 2006. The improved results
were primarily due to increases in gross profit on sales and reorganization gains and a decrease
in other operating and administrative expenses, all as previously discussed.
Fiscal year ended June 28, 2006 (“fiscal 2006”), as compared to fiscal year ended June 29,
2005 (“fiscal 2005”)
Net Sales. Net sales for fiscal 2006 were $7.1 billion, an increase of $188.0 million, or 2.7%,
as compared to fiscal 2005. Net sales primarily related to grocery and supermarket items. In
aggregate, pharmacy, fuel and floral department sales comprised approximately 10% of net
sales in both fiscal 2006 and fiscal 2005.
We define identical store sales as sales from continuing operations stores, including stores that
we remodeled or enlarged during the year and excluding stores that opened or closed during
the year. Identical store sales increased 5.9% for fiscal 2006 as compared to fiscal 2005.
Identical store sales improved throughout the Company due to increased basket size. We
believe this increase was due in part to improved store execution and customer service, the
introduction of merchandising initiatives, which included pricing and promotional programs,
and new brand marketing initiatives, in addition to the positive impact from sales in the area
affected by Hurricane Katrina, as described below. Transaction count in fiscal 2006 was
approximately the same as in fiscal 2005.
18
29. Areas significantly affected by Hurricane Katrina reported substantially greater increases in
identical store sales because of fewer open competitor stores and restaurants, the influx of
relief and construction workers to the areas, and, along the Gulf Coast, population shifts to
Baton Rouge and other less-affected areas.
Gross Profit on Sales. Gross profit on sales increased $37.4 million for fiscal 2006 as
compared to fiscal 2005. As a percentage of net sales, gross margin was 25.9% and 26.1% for
fiscal 2006 and fiscal 2005, respectively.
Gross margin declined by approximately 20 basis points for fiscal 2006 as compared to fiscal
2005, because of both positive and negative factors. Pricing and promotional programs
accounted for 50 basis points of the decline. A reduction in vendor allowances and cash
discounts accounted for 20 basis points of the decline, primarily because many vendors shifted
from slotting fees to promotional programs tied to purchase volumes (due to store closures, our
total purchase volumes declined). Higher labor, fuel and energy costs accounted for 20 basis
points of the decline. Operational improvements that reduced inventory shrink offset the
negative factors and improved gross margin by 63 basis points.
Other Operating and Administrative Expenses. Other operating and administrative expenses
increased $62.2 million for fiscal 2006 as compared to fiscal 2005. As a percentage of net
sales, other operating and administrative expenses were 27.9% and 27.8% for fiscal 2006 and
fiscal 2005, respectively.
The increase in other operating and administrative expenses was due to increases in salaries
and employee-related costs of $49.7 million resulting from an investment in retail labor hours
in our efforts to improve customer service, partially offset by decreases in administrative areas.
We also incurred $17.5 million of additional utility costs due to rate and consumption
increases and $13.8 million in increased insurance costs. The increased expenses were partially
offset by a decrease of $20.8 million in professional fees that were unrelated to our
bankruptcy. Certain prior year items did not recur in the current year, including $9.7 million
related to the severance of our former Chief Executive Officer. Other increases and decreases
in the components of this expense substantially offset each other.
Impairment Charges. Impairment charges were $14.8 million and $155.9 million in fiscal 2006
and fiscal 2005, respectively, all of which were recorded by the Predecessor. See Item 8, Note
8 for further discussion of impairment charges.
Reorganization Items. Reorganization items resulted in net gains of $251.2 million and $148.3
million in fiscal 2006 and fiscal 2005, respectively, all of which were recorded by the
Predecessor. See Item 8, Note 1 for further discussion of reorganization items.
Interest Expense. Interest expense is primarily interest on long-term and short-term debt and
capital leases. Net interest expense was $12.0 million for fiscal 2006, as compared to $33.1
million for fiscal 2005. The decrease in interest expense related primarily to interest on our
Notes, for which interest was not recognized subsequent to the Petition Date in accordance
with SOP 90-7. Prior to the Petition Date, in fiscal 2005 we recognized $18.0 million of
interest expense related to these Notes. Also in fiscal 2005, as of the Petition Date, we
expensed the $5.2 million unamortized balance of debt issue costs related to our pre-petition
19
30. credit facility. In accordance with SOP 90-7, from the Petition Date through the Effective
Date, interest income was classified within reorganization items rather than offsetting interest
expense.
Income Taxes. The effective tax rate on continuing operations was a benefit of 10.5% for fiscal
2006 as compared to a provision of 100.0% for fiscal 2005. The fiscal 2006 rate reflected the
maintenance of a full valuation allowance on our deferred tax assets as well as our ability to
carry back certain NOLs and certain refundable credits. In fiscal 2006, we recorded a benefit
of $4.5 million to correct fiscal 2005 errors, including a benefit of $11.7 million related to
additional refunds from NOL carrybacks, partially offset by an expense of $7.2 million that
was primarily related to depreciation and LIFO errors. The errors were insignificant to fiscal
2006 and fiscal 2005.
The fiscal 2005 rate reflected the establishment of a full valuation allowance against our net
deferred tax assets. We evaluated the future realization of our net deferred tax assets during
fiscal 2005 and determined that it was more likely than not that our net deferred tax assets
would not be realized. As a result, in fiscal 2005 we recognized a full valuation allowance
against our net deferred tax assets. We recognized no tax benefit or expense during the
remainder of fiscal 2005.
Net Income (Loss) From Continuing Operations. Net income from continuing operations was
$101.6 million for fiscal 2006, as compared to a net loss of $380.7 million for fiscal 2005. The
improvement was due to decreases in income tax expense and impairment charges, as well as
an increase in reorganization gains, all as previously discussed.
Discontinued Operations and Restructuring
In evaluating whether elements of our restructuring plans qualify for discontinued operations
classification, we consider each store to be a component of a business, as this is the lowest
level at which the operations and cash flows can be clearly distinguished, operationally and for
financial reporting purposes. If the cash flows of a store to be exited will not be significant to
our ongoing operations and cash inflows of our nearby stores are not expected to increase
significantly because of the exit, the results of operations of the store are reported in
discontinued operations. Other components, including distribution centers and manufacturing
operations, are classified as discontinued operations only if we determine that the related
continuing cash flows will not be significant to our ongoing operations. Costs incurred to
dispose of a location are included in gain (loss) on disposal of discontinued operations only if
the location qualifies for discontinued operations classification.
Fiscal 2007 Sales and Closures. In early fiscal 2007, we closed seven U.S. stores and sold our
78% ownership interest in Bahamas Supermarkets Limited, which owned all of our operations
in The Bahamas. The sale of the Bahamian operations resulted in proceeds of $54.0 million
and a gain on sale of $31.5 million, which was included in gain on disposal of discontinued
operations. Results of operations for six of the seven U.S. stores and the twelve stores and
distribution center in The Bahamas were classified as discontinued operations.
2005 Restructure Plan. In June 2005, we announced our intention to exit 326 stores and three
distribution centers (the “2005 Restructure Plan”). We later expanded this plan by an
additional 35 stores and one distribution center. In all, during fiscal 2006 we closed 374 stores,
20
31. 4 distribution centers and all manufacturing operations except 2 dairies and the Chek beverage
operation. We also restructured our field and administrative support staff to support the
planned configuration of the retail business.
We classified results of operations of 2 distribution centers and 357 of the 374 stores exited
during fiscal 2006 as discontinued operations. We determined that the closure of the remaining
stores, the manufacturing operations and two of the distribution centers did not eliminate the
cash flows for the stores, similar manufactured goods and warehousing, respectively, and thus
the results of those facilities were reported in continuing operations.
Financial Information. The following summarizes the results of our discontinued operations
(in thousands), all of which were recorded by the Predecessor:
20 weeks ended
Nov. 15, 2006 Fiscal 2006 Fiscal 2005
Net sales from discontinued operations $ 24,180 745,058 3,264,796
Earnings (loss) from discontinued operations $ 2,333 (145,654) (322,448)
Gain (loss) on disposal of discontinued
operations 17,922 (320,846) (129,456)
Net earnings (loss) from discontinued operations $ 20,255 (466,500) (451,904)
The following tables detail the net restructuring charge (gain) and (gain) loss on disposal of
discontinued operations (in thousands), all of which were recorded by the Predecessor:
20 weeks ended
Nov. 15, 2006
Restructuring: Fiscal 2006 Fiscal 2005
(Gain) loss on sale/retirement, net $ (465) (50,435) (4,661)
Lease termination costs 154 32,804 34,950
Employee termination costs 228 5,385 2,226
Other location closing costs 869 4,547 1,724
Restructuring charge (gain), net $ 786 (7,699) 34,239
(Gain) loss on disposal of discontinued operations:
(Gain) loss on sale/retirement, net $ (30,296) (60,450) (13,014)
LIFO liquidation - (39,820) (20,349)
Lease termination costs 10,691 373,328 134,891
Employee termination (gain) costs (11) 21,524 17,983
Other location closing costs 1,694 26,264 9,945
Net (gain) loss on disposal $ (17,922) 320,846 129,456
21
32. The following table summarizes the changes in liabilities recorded for the restructuring plans
(in thousands):
Employee Other Location
Termination Costs Closing Costs
Total
Predecessor:
Balance as of June 30, 2004 $ 7,024 3,760 3,264
Additions 19,127 16,106 3,021
Utilizations (21,484) (16,448) (5,036)
Adjustments (4,507) (3,258) (1,249)
Balance as of June 29, 2005 $ 160 160 -
Additions 48,633 34,033 14,600
Utilizations (33,404) (23,319) (10,085)
Adjustments (11,765) (9,515) (2,250)
Balance as of June 28, 2006 $ 3,624 1,359 2,265
Additions 663 368 295
Utilizations (2,991) (1,155) (1,836)
Adjustments (175) (175) -
Balance as of Nov. 15, 2006 $ 1,121 397 724
Successor:
Balance as of Nov. 15, 2006 $ 1,121 397 724
Utilizations (662) (278) (384)
Adjustments (459) (119) (340)
Balance as of June 27, 2007 $ - - -
In the Consolidated Balance Sheets, employee termination costs are included in accrued wages
and salaries, while other location closing costs are included in accrued expenses.
LIQUIDITY AND CAPITAL RESOURCES
Summary
As of June 27, 2007, we had $592.9 million of liquidity, comprised of $391.0 million of
borrowing availability under the Credit Agreement and $201.9 million of cash and cash
equivalents. We anticipate that our liquidity will decrease during fiscal 2008, due primarily to
increased capital expenditures, partially offset by anticipated cash flows from operating
activities. We believe that we have sufficient liquidity through borrowing availability,
available cash and cash flows from operating activities to fund our cash requirements for
existing operations and capital expenditures through fiscal 2008. Based on anticipated
improvement in operating results and borrowing availability, we believe that we will have
sufficient resources beyond fiscal 2008 to operate our business and fund our capital-spending
program.
Credit Agreement
On the Effective Date, Winn-Dixie Stores, Inc., and certain of our subsidiaries entered into an
Amended and Restated Credit Agreement (“Credit Agreement”). The Credit Agreement, which
22
33. is to be used for working capital and general corporate purposes, provides for a $725.0 million
senior secured revolving credit facility, of which a maximum of $300.0 million may be utilized
for letters of credit. The Credit Agreement matures November 21, 2011, at which time all
amounts then outstanding under the agreement will be due and payable. At our request, under
certain conditions the facility may be increased by up to $100.0 million. Obligations under the
Credit Agreement are guaranteed by substantially all of our subsidiaries and are secured by
senior liens on substantially all of our assets. Debt issuance costs of $9.2 million are being
amortized over the term of the Credit Agreement. This Form 10-K contains only a general
description of the terms of the Credit Agreement and is qualified in its entirety by reference to
the full Credit Agreement (filed as Exhibit 10.1 to the Form 8-K filed on November 28, 2006).
The following capitalized terms have specific meanings as defined in the Credit Agreement:
Agent, Borrowing Base, Capital Expenditures, EBITDA, Excess Availability and Reserves.
As of the Effective Date, existing letters of credit under the DIP Credit Facility (as defined
below) were rolled over as letters of credit under the Credit Agreement. We had no material
borrowings on the Credit Agreement, other than fees charged by the lender, during the 32
weeks ended June 27, 2007. As of June 27, 2007, $14 thousand was outstanding.
Borrowing availability was $391.0 million as of June 27, 2007, as summarized below (in
thousands):
June 27, 2007
1
Lesser of Borrowing Base or Credit Agreement capacity $ 441,036
Outstanding borrowings (14)
Excess Availability 441,022
Limitation on Excess Availability (50,000)
Borrowing availability $ 391,022
1
Net of Reserves of $253.5 million, including $234.5 million related to outstanding letters of credit.
As shown above, availability under the Credit Agreement is determined net of Reserves, which
are subject to revision by the Agent to reflect events or circumstances that adversely affect the
value of the Borrowing Base assets. Accordingly, a determination by the Agent to increase
Reserves would reduce availability.
Letters of credit are considered reserves against the borrowing availability. As of June 27,
2007, letters of credit totaling $234.5 million were issued under the Credit Agreement.
Substantially all outstanding letters of credit related to workers’ compensation programs. As of
June 27, 2007, an additional $3.0 million in letters of credit were issued outside of the Credit
Agreement and secured by marketable securities owned by the Company.
Debtor-In-Possession Credit Facility
Subsequent to the Petition Date, the Court authorized Winn-Dixie Stores, Inc. and five
specified debtor subsidiaries to enter into an $800.0 million credit facility (the “DIP Credit
Facility”). As of both the Effective Date and June 28, 2006, the outstanding balance on the DIP
Credit Facility was $40.0 million under the term loan portion of the facility. On the Effective
Date, we repaid the DIP Credit Facility, which was then terminated. In addition to the DIP
23
34. Credit Facility, the Predecessor had $300.0 million of outstanding Notes, which were included
in liabilities subject to compromise in the Predecessor’s balance sheet. In accordance with the
Plan, the Notes were cancelled and the holders thereof received shares of the Successor’s
common stock. In accordance with SOP 90-7, as of the Petition Date, the Predecessor ceased
accruing interest on all unsecured debt subject to compromise, primarily the Notes. See our
Annual Report on Form 10-K for the fiscal year ended June 28, 2006, for more information
about the DIP Credit Facility and the Notes.
Historical Cash Flow Data
Cash flows from discontinued operations are reported with cash flows from continuing
operations within operating, investing and financing activities. The table below presents
certain Consolidated Statements of Cash Flow data for fiscal 2007 and fiscal 2006 (in
thousands):
Fiscal 2007 Fiscal 2006 Fiscal 2005
Cash provided by (used in):
Operating activities $ 22,607 195,224 (228,136)
Investing activities 30,103 149,405 3,368
Financing activities (38,307) (202,492) 230,091
Operating Activities. For fiscal 2007, net cash provided by operating activities was $22.6
million, primarily due to proceeds from insurance of $42.0 million and income tax refunds of
$28.5 million, offset by bankruptcy-related payments made subsequent to emergence and
operating losses.
For fiscal 2005 and fiscal 2006, our cash flows from operating activities were significantly
affected by our Chapter 11 filing. In fiscal 2005, cash used in operations of $228.1 million
resulted substantially from the withdrawal of credit by many of our vendors due to our Chapter
11 filing and operating losses from underperforming stores. Cash provided by operations of
$195.2 million in fiscal 2006 was primarily due to the resumption of vendor credit and
accounts receivable collections lost during fiscal 2005 due to our Chapter 11 filing, as well as
inventory liquidation upon closing underperforming stores.
Investing Activities. In fiscal 2007, cash provided by investing activities primarily related to
the receipt of $54.0 million in proceeds from the sale of Bahamas Supermarkets Limited.
Capital expenditures were $92.4 million, which included repairs to locations damaged by
hurricanes, store remodeling and improvements, and equipment acquisition.
Financing Activities. In fiscal 2007, cash used in financing activities related primarily to
payments on credit facilities of $52.6 million.
Capital Expenditures. In fiscal 2008, we expect capital expenditures to total approximately
$250 million, of which approximately $140 million is budgeted for our store-remodeling
program. We initiated this program during fiscal 2007, and as of June 27, 2007, had completed
20 remodels. In fiscal 2008 and future fiscal years, we plan to remodel approximately 75 stores
annually. We believe we can achieve at least a 10% increase in identical store sales (or
corresponding mitigation of the anticipated negative effect of a competitive store opening)
during the first 12 months for all remodeled stores.
24
35. In addition to the store-remodeling program, we anticipate that during fiscal 2008 we will
spend approximately $110 million on other capital expenditures, including maintenance and
other store-related projects, information technology projects, and back-up generators.
CONTRACTUAL OBLIGATIONS AND COMMERCIAL COMMITMENTS
We assume various financial obligations and commitments in the normal course of our
operating and financing activities. Contractual obligations represent known future cash
payments that we will be required to make under existing arrangements, such as debt and lease
agreements. The table below presents the scheduled payments due under our contractual
obligations as of June 27, 2007:
Contractual Obligations Payment due by period
Less than 1-3 3-5 More than
Total
(in millions) 1 year years years 5 years
Long-term debt 1 $ - - - - -
Capital leases 29.3 8.1 13.7 7.4 0.1
208.2
Operating leases 1,861.4 391.3 344.2 917.7
Purchase obligations 2 333.2 232.3 84.6 12.0 4.3
Retirement plans 3 22.7 2.1 4.2 3.7 12.7
Other 22.5 18.6 3.9 - -
Total $ 2,269.1 469.3 497.7 367.3 934.8
1
Excludes: $234.5 million of letters of credit outstanding under the Credit Agreement; $3.0 million of
letters of credit outstanding outside of the Credit Agreement; and Borrowing Availability of $391.0
million.
2
We enter into supply contracts to purchase products for resale in the ordinary course of business. These
contracts may include specific merchandising obligations related to the products and, if so, typically
include either a volume commitment or a fixed expiration date; pricing terms based on the vendor’s
published list price; termination provisions; and other standard contractual considerations. Contracts that
are cancelable, typically upon return of the related vendor allowances, are not included above. Contracts
that are either non-cancelable or are less specific as to our obligations upon cancellation are included
above. When applicable, we used anticipated purchase volumes to allocate the purchase obligation to the
indicated periods. The amounts above include open purchase orders of $127.3 million.
3
Payments for retiree plans are based on actuarial projections related to our post-retirement benefits.
IMPACT OF INFLATION
Inflation impacts our operating costs including, but not limited to, cost of goods and supplies,
utilities, occupancy costs, and labor expenses. We typically seek to mitigate these effects by
passing along inflationary increases in costs through increases in the selling prices of our
products. To the extent we pass through cost increases in the form of higher selling prices, our
sales are positively impacted. If we are unable to pass through cost increases, we may
experience pressure on our gross margins. We also seek to mitigate cost inflation through
strategically managing pricing and promotions, lowering overhead costs, and/or by increasing
productivity.
25