This document summarizes the key trends and issues related to mega-mining in Ecuador and globally:
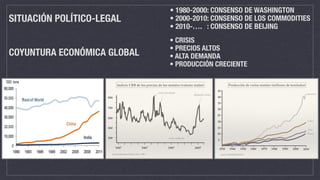
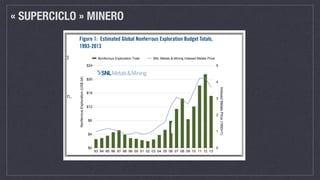
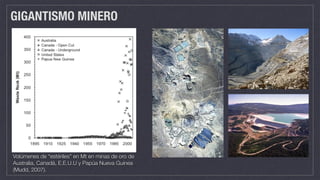
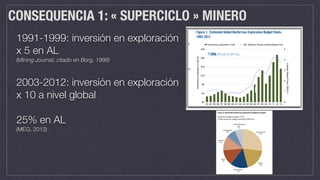
- Exploration and mining budgets increased dramatically from 1980-2010, driven by high commodity prices and demand from China.
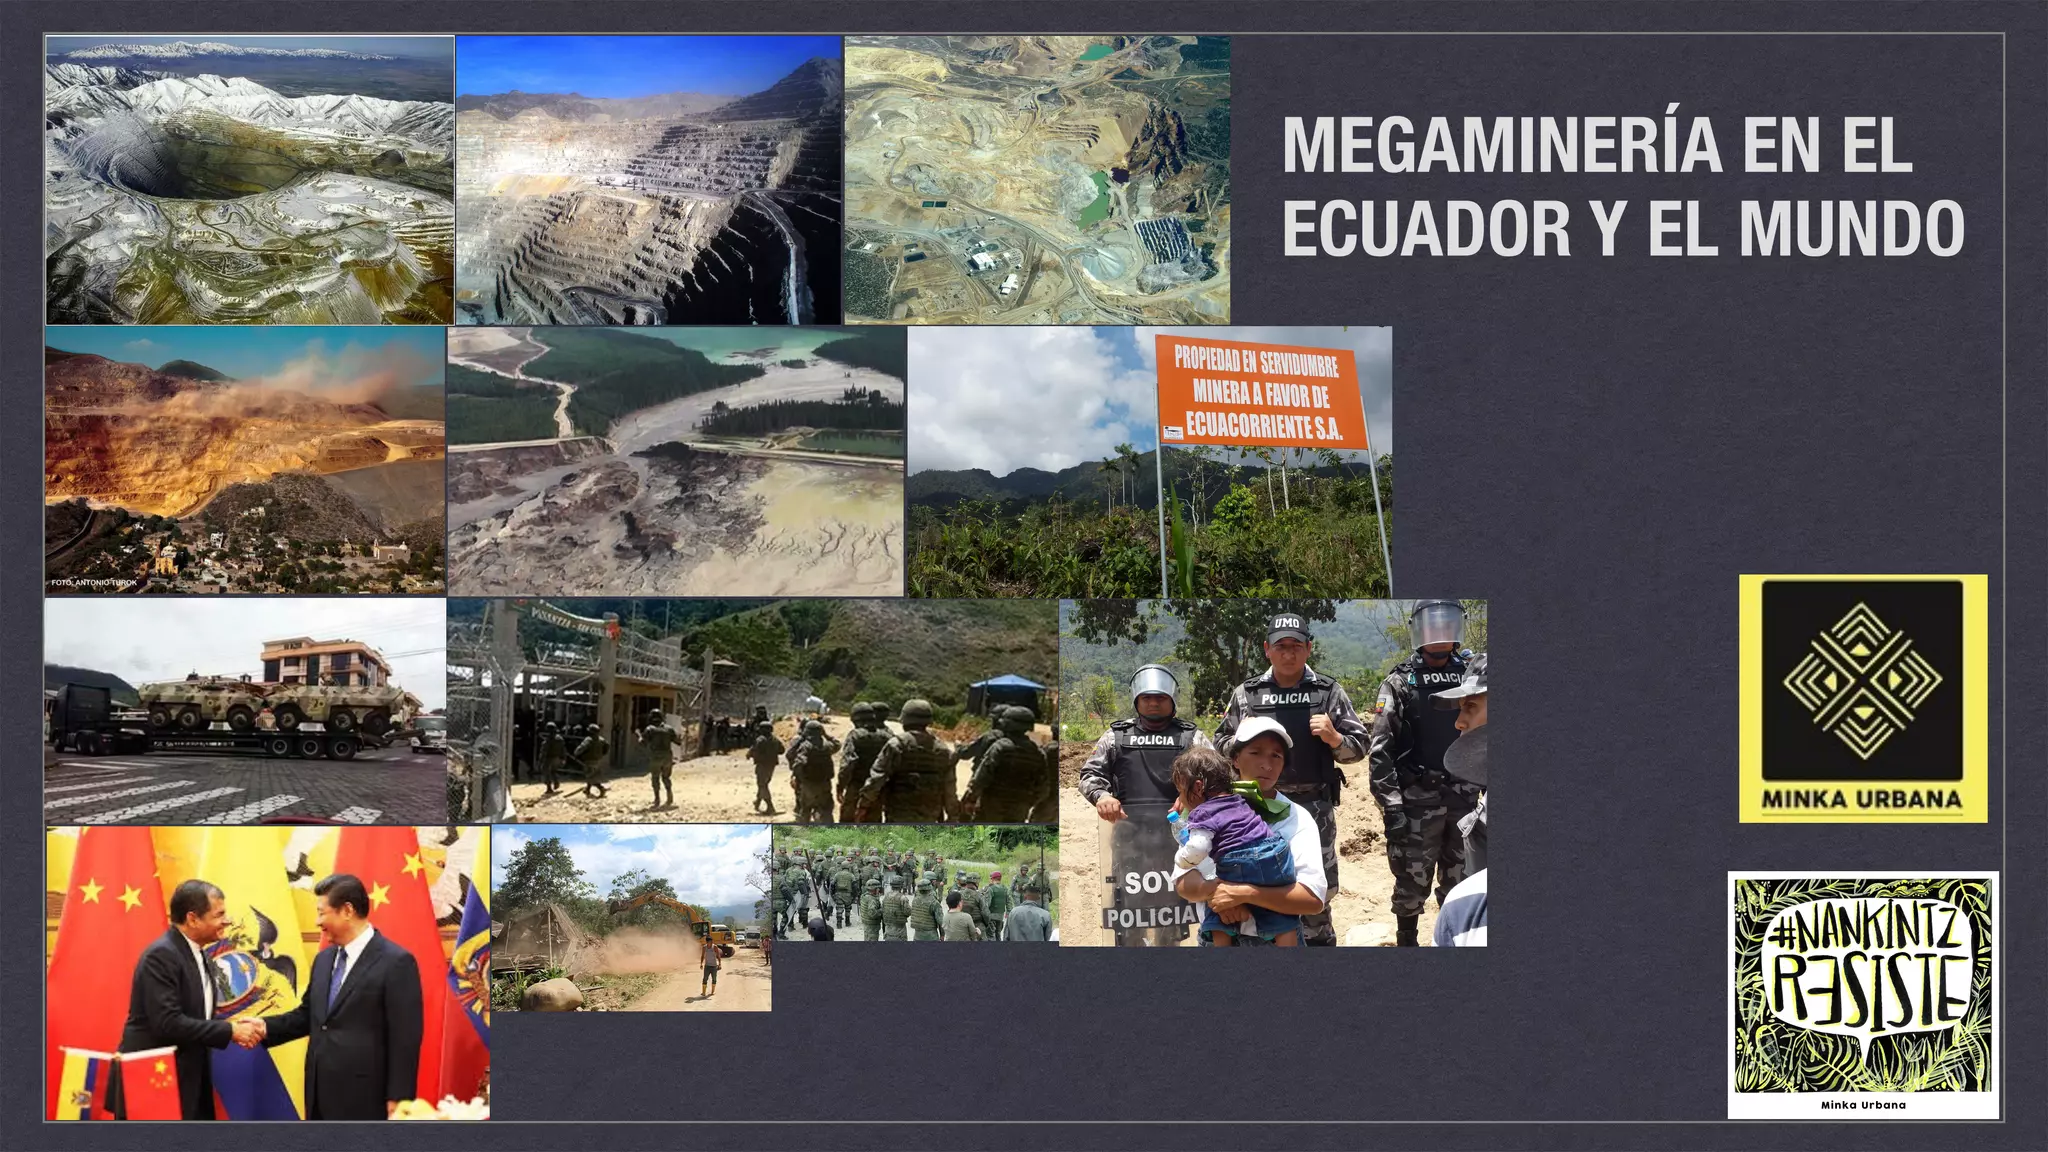
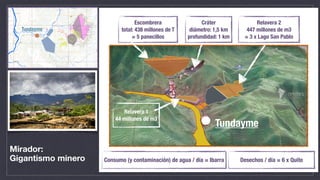
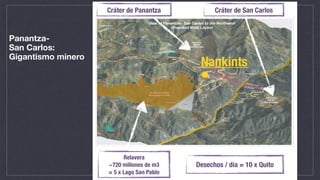
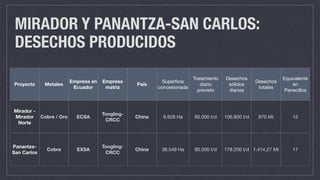
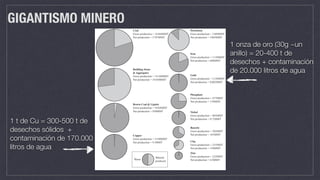
- Mega-mining projects in Ecuador involve the extraction of millions of tons of ore and generate hundreds of millions of tons of waste, using vast quantities of water and land.
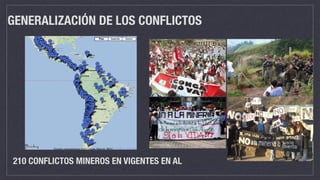
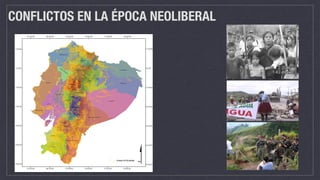
- These projects have significant social and environmental impacts and have led to increasing conflicts with indigenous and local communities.
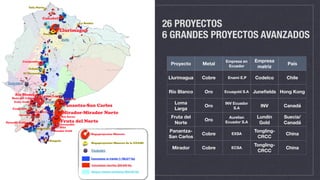
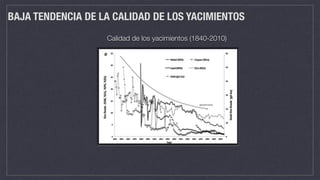
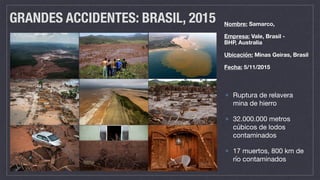
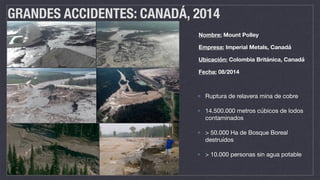
- Globally, the quality of ore bodies is declining, requiring even larger volumes of waste to be extracted and processed. Accidents at large tailings dams, such as in Brazil and Canada, have caused