Costs and Outcomes of Mental Health and Substance Use Disorders in the U.S.
•
1 like•4,897 views

Costs and Outcomes of Mental Health and Substance Use Disorders in the U.S.

Recommended
Recommended
More Related Content
What's hot
What's hot (20)
Similar to Costs and Outcomes of Mental Health and Substance Use Disorders in the U.S.
Similar to Costs and Outcomes of Mental Health and Substance Use Disorders in the U.S. (20)
More from KFF
More from KFF (20)
Recently uploaded
Recently uploaded (20)
Costs and Outcomes of Mental Health and Substance Use Disorders in the U.S.
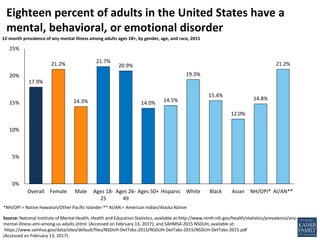
- 1. 17.9% 21.2% 14.3% 21.7% 20.9% 14.0% 14.5% 19.3% 15.4% 12.0% 14.8% 21.2% 0% 5% 10% 15% 20% 25% Overall Female Male Ages 18- 25 Ages 26- 49 Ages 50+ Hispanic White Black Asian NH/OPI* AI/AN** *NH/OPI = Native Hawaiian/Other Pacific Islander ** AI/AN = American Indian/Alaska Native Source: National Institute of Mental Health, Health and Education Statistics, available at: http://www.nimh.nih.gov/health/statistics/prevalence/any- mental-illness-ami-among-us-adults.shtml (Accessed on February 13, 2017); and SAMHSA 2015 NSDUH, available at: https://www.samhsa.gov/data/sites/default/files/NSDUH-DetTabs-2015/NSDUH-DetTabs-2015/NSDUH-DetTabs-2015.pdf (Accessed on February 13, 2017) Eighteen percent of adults in the United States have a mental, behavioral, or emotional disorder 12-month prevalence of any mental illness among adults ages 18+, by gender, age, and race, 2015
- 2. 2.9% 2.0% 3.8% 3.4% 7.2% 2.1% 3.0% 2.8% 3.5% 1.2% 4.5% 4.1% 0% 1% 2% 3% 4% 5% 6% 7% 8% Overall Female Male Ages 12- 17 Ages 18- 25 Ages 26+ Hispanic or Latino White Black Asian NH/OPI* AI/AN* *NH/OPI = Native Hawaiian/Other Pacific Islander **AI/AN = American Indian/Alaska Native Source: Substance Abuse and Mental Health Services Administration, National Survey on Drug Use and Health. Available at: https://www.samhsa.gov/data/sites/default/files/NSDUH-DetTabs-2015/NSDUH-DetTabs-2015/NSDUH-DetTabs-2015.pdf (Accessed on February 14, 2017) Note: Includes marijuana use. Three percent of people age 12 or older reported illicit drug dependence or abuse in the past year 12-month prevalence among population age 12+, by gender, age, and race/ethnicity, 2015
- 3. 12.4 2.5 0 2 4 6 8 10 12 14 2000 2001 2002 2003 2004 2005 2006 2007 2008 2009 2010 2011 2012 2013 United States Comparable Country Average Source: Kaiser Family Foundation analysis of data from OECD (2017), “Health Status", OECD Health Statistics (database) (Accessed on 13 February 2017). Notes: Comparable countries are defined as those with above median GDP and above median GDP per capita in at least one of the past 10 years. Where data were unavailable (United Kingdom in 2000, Australia in 2005, and Canada from 2012-2013), the previous year’s data were used. Data for Switzerland omitted. Break in series for Austria in 2002, Canada and France in 2000, and the United Kingdom in 2001. Relative to comparable countries, the U.S. has higher rates of death from accidental poisonings, such as drug overdoses Standardized mortality rate for accidental poisonings per 100,000 population, 2000-2013
- 4. 624 642 1,050 1,463 1,827 2,357 2,419 3,065 3,131 3,355 - 500 1,000 1,500 2,000 2,500 3,000 3,500 4,000 Sense organ disease Skin diseases Chronic respiratory Nervous System Endocrine (diabetes) Musculoskeletal disorders Injuries Cardiovascular disease Cancers and tumors (Neoplasms) Mental health and substance use disorders Source: Institute for Health Metrics and Evaluation. Global Burden of Disease Study 2015 (GBD 2015). Available at: http://ghdx.healthdata.org/gbd-2015 Mental health and substance use disorders are the leading cause of disease burden in the U.S. Age standardized disability adjusted life years (DALYs) rate per 100,000 population, both sexes, 2015
- 5. Source: Kaiser Family Foundation Health Tracking Poll: April 2016. Available at: http://kff.org/report-section/kaiser-health-tracking-poll-april-2016-substance-abuse-and-mental-health/ One in five Americans report they or a family member did not receive needed mental health services Don’t know/ Refused 1% Yes 21% No 78% Was there ever a time when you or another family member in your household thought you might need mental health services but did not get them? 8% 10% 12% 13% 0% 5% 10% 15% Didn't know where to go to get care Afraid or embarrassed to seek care Insurance wouldn't cover it Couldn't afford the cost Of those who reported not receiving care, the following percentage reported the reason for foregoing care as: Percentage of respondents with the following answers to questions asked in April 2016:
- 6. $45 $47 $70 $89 $89 $114 $114 $118 $127 $136 $142 $161 $190 $236 $254 $- $50 $100 $150 $200 $250 $300 Dermatological Pregnancy/childbirth complications Infectious diseases Mental illness Other Digestive Genitourinary Injury and poisoning Cancers and tumors Nervous system Endocrine Respiratory Musculoskeletal Circulatory Ill-defined conditions Source: Bureau of Economic Analysis Health Care Satellite Account (Blended Account) (Accessed February 14, 2017). Note: Expenditures on nursing home and dental care are not included in health services spending by disease. Data does not include spending on institutionalized population. Spending on mental illness treatment accounts for $89 billion of total health spending Total expenditures in $ billions by disease category, 2013