Download to read offline
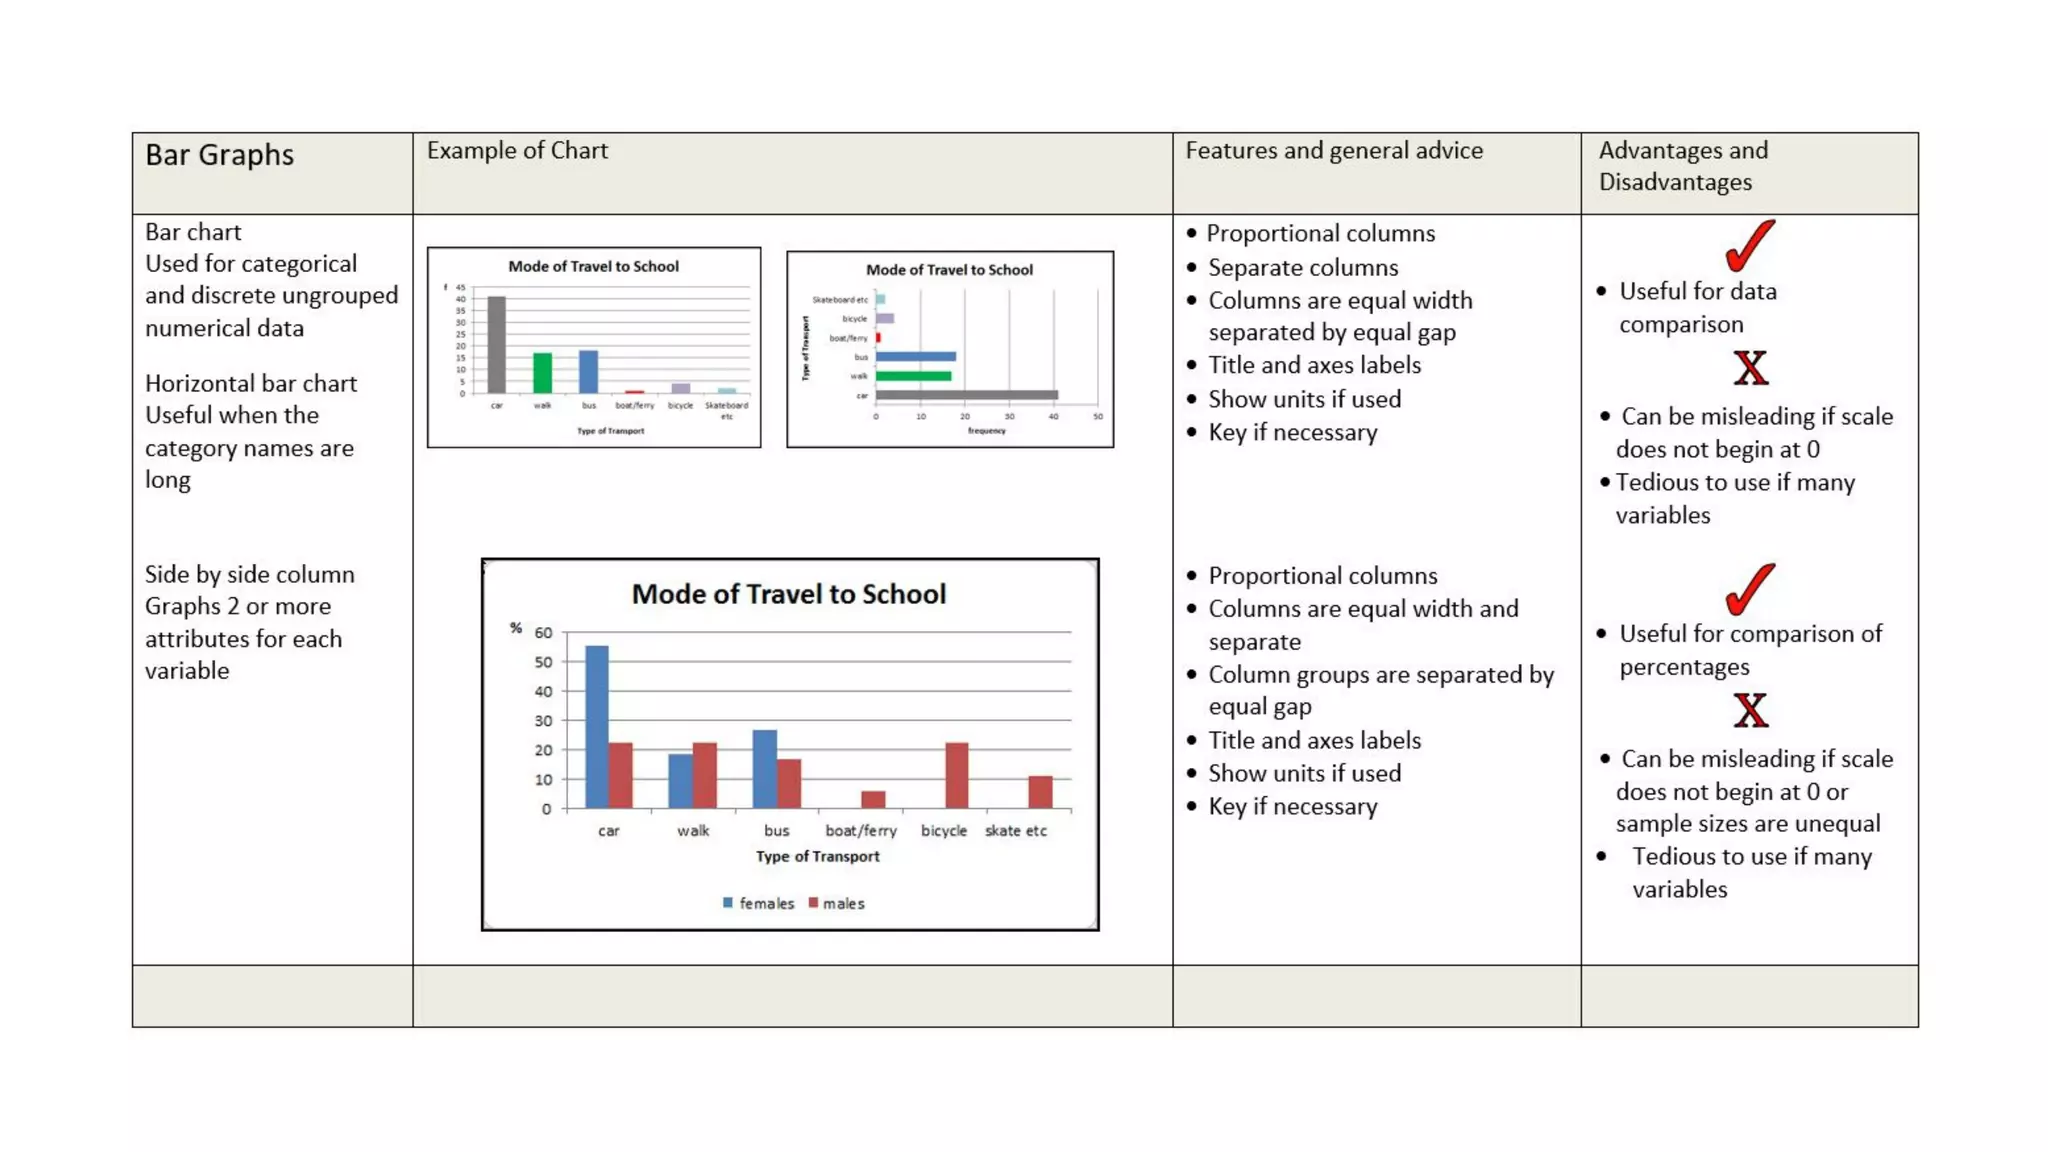
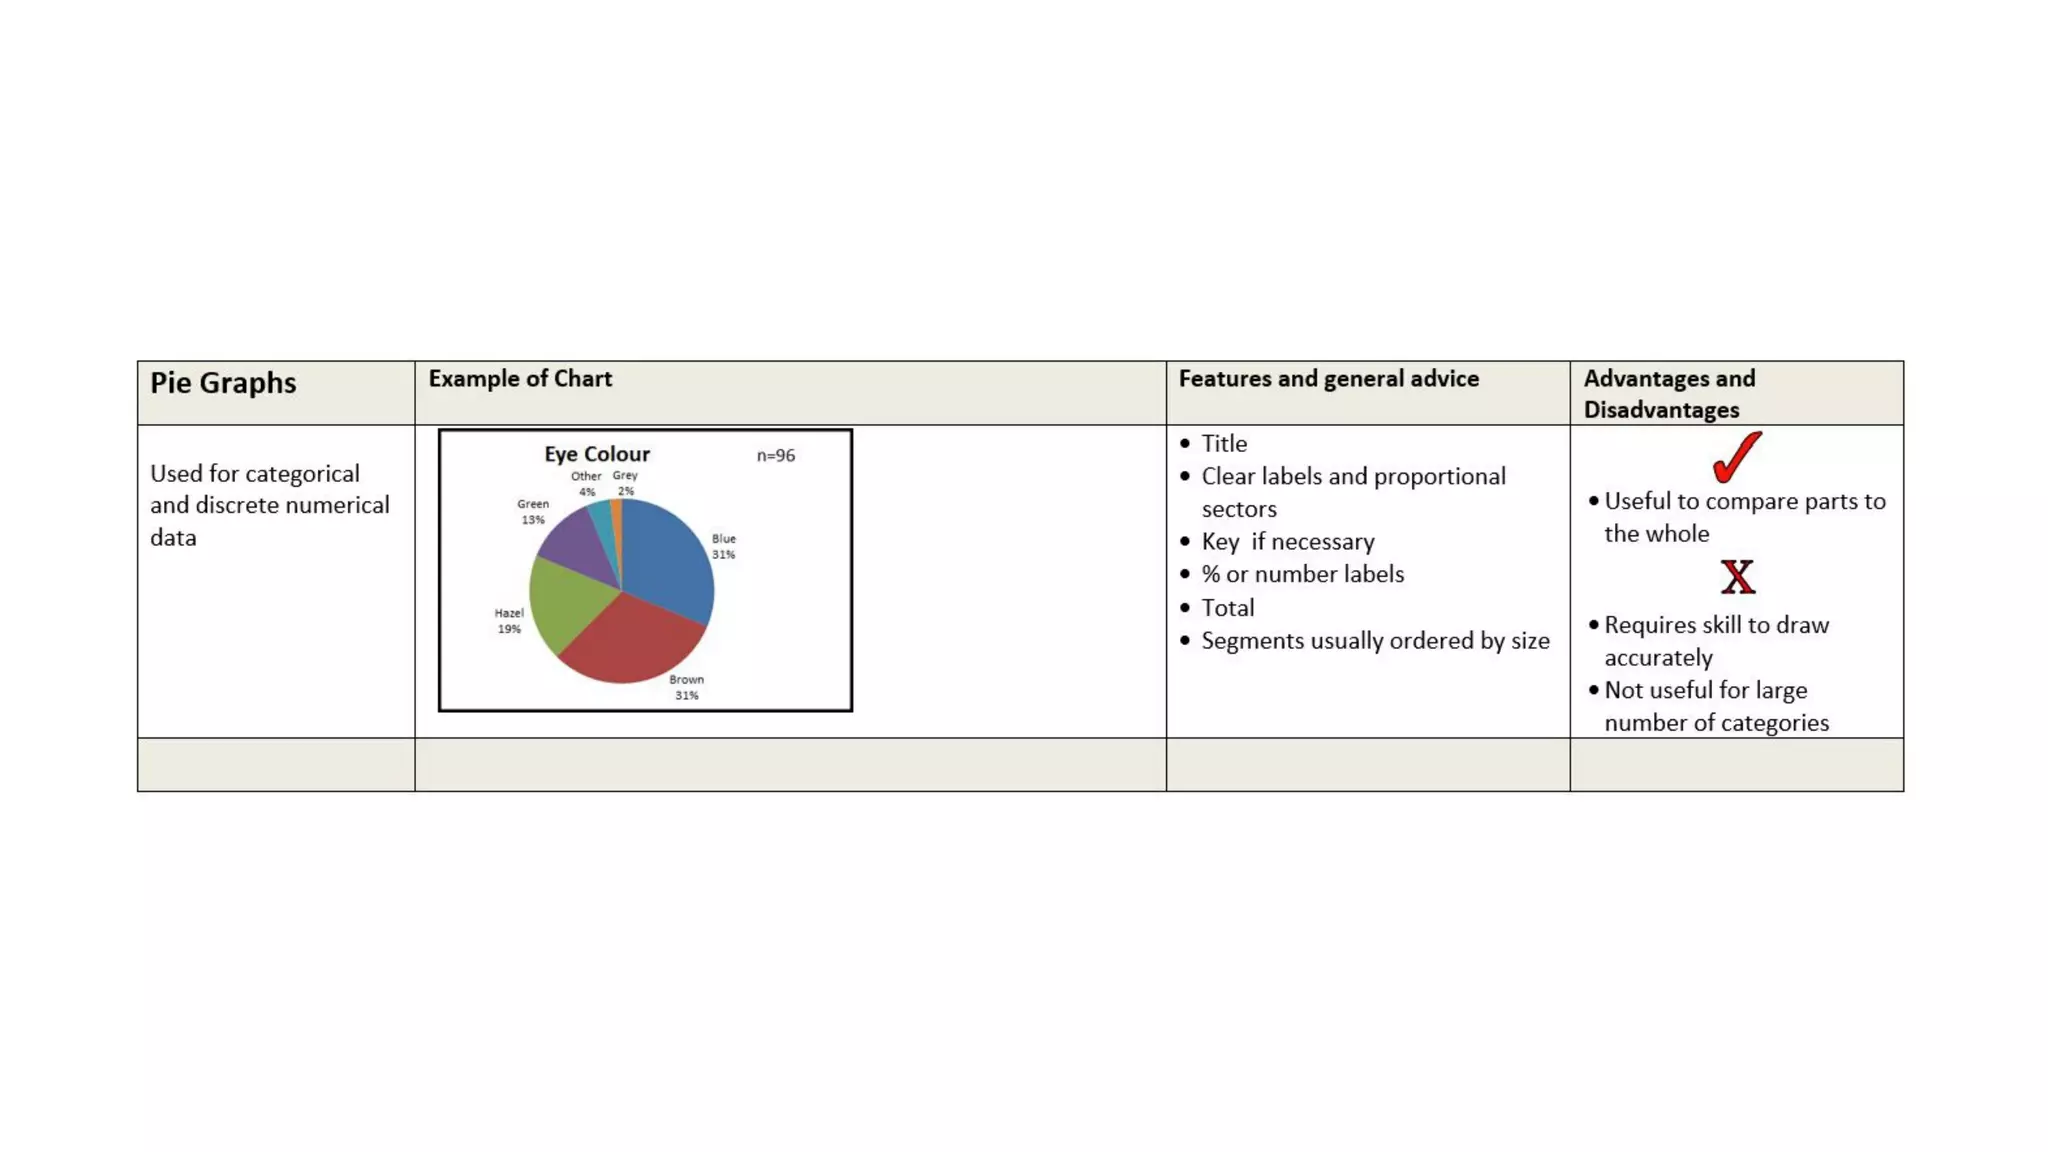
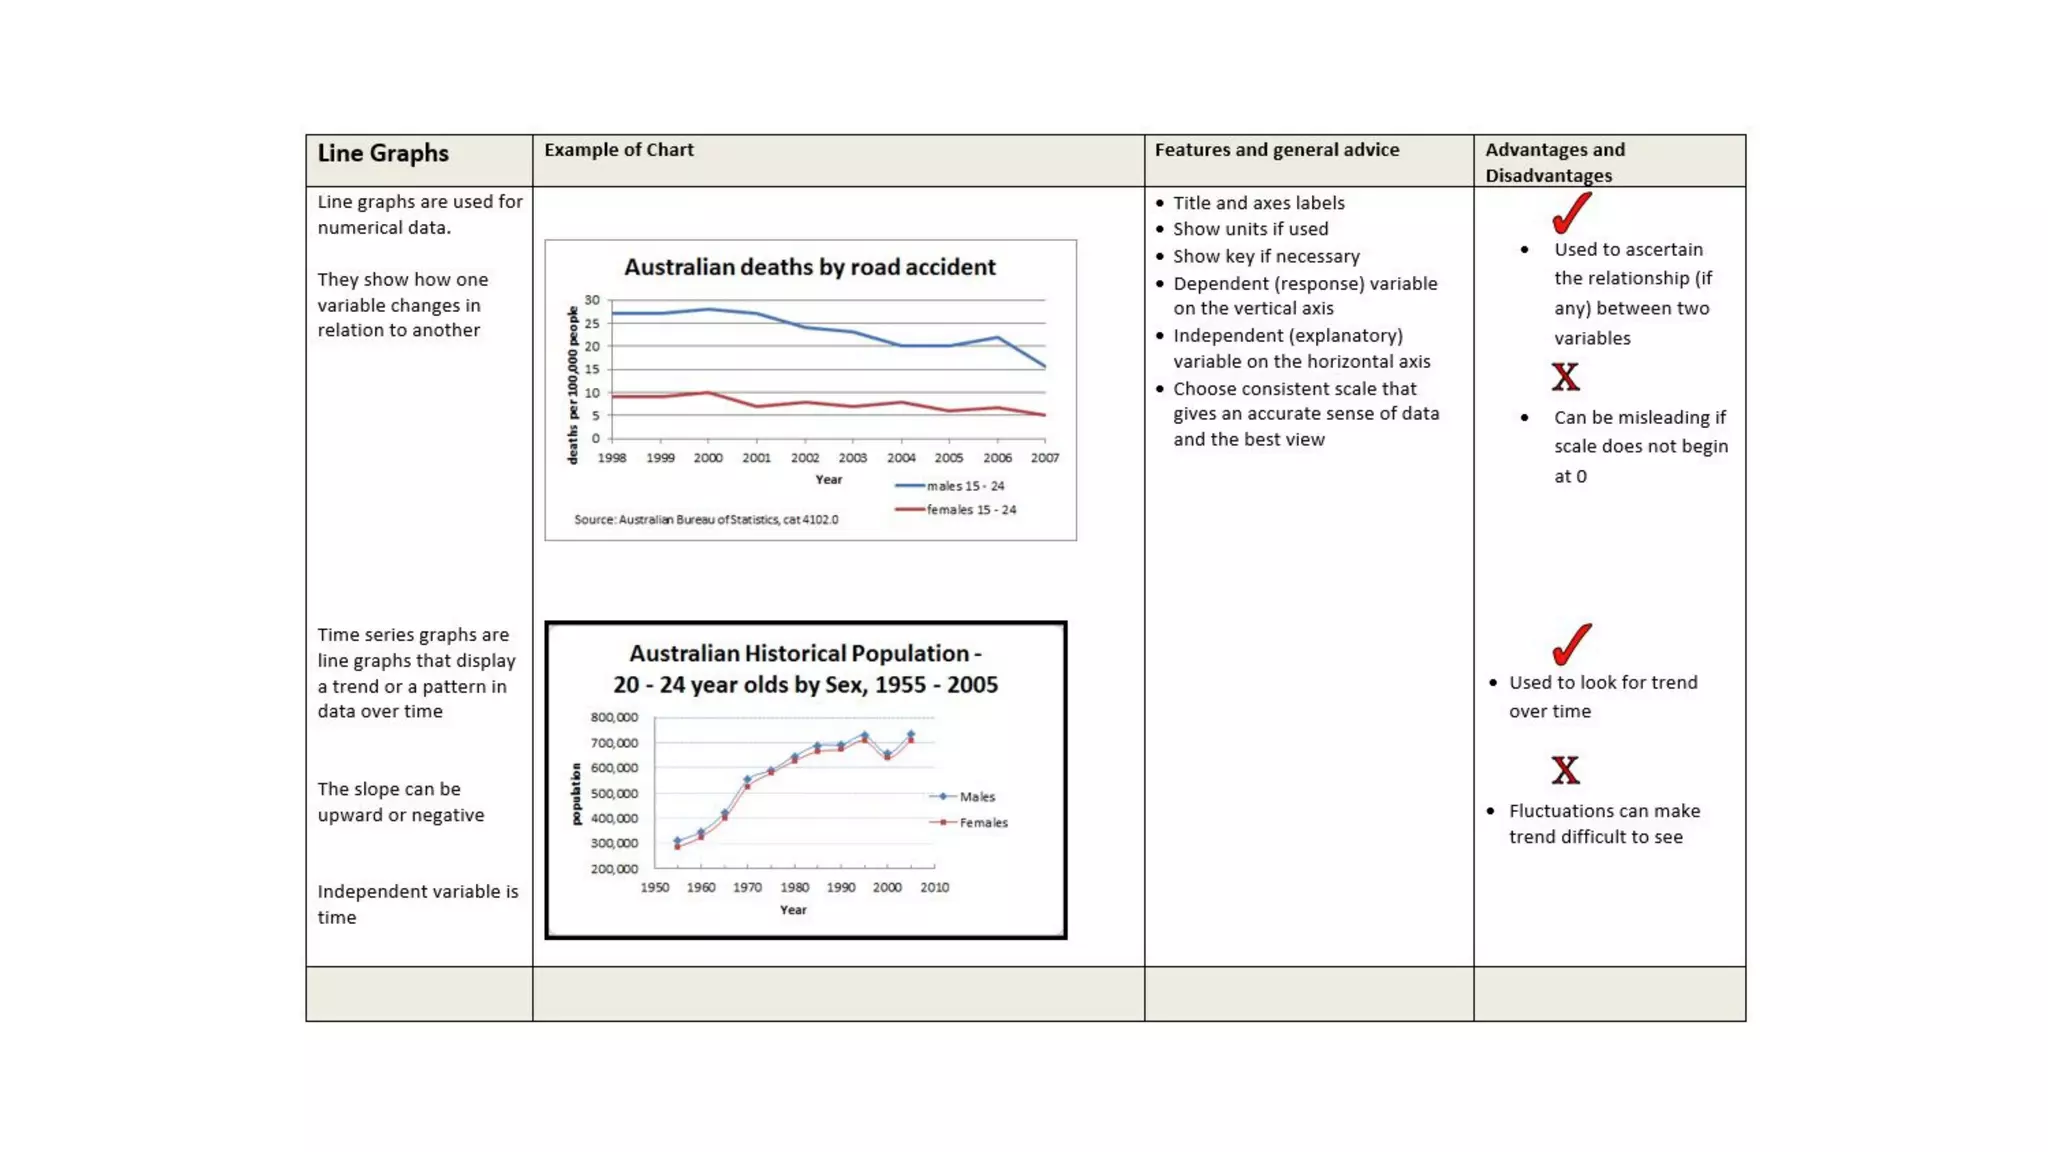
Graphs are visual representations of data that help readers understand relationships. Choosing the right graph depends on the type of data and the message you want to convey. Line graphs show changes over time, bar graphs compare categories, pie charts show proportions, and scatter plots reveal correlations between two variables.


