The document provides examples of how common products and services in Ontario will be affected by the new Harmonized Sales Tax (HST), outlining whether each item was subject to GST and/or RST previously and if the total amount of tax payable will change under the HST. Key examples given include clothing, food/beverages, home services, vehicles, health products, memberships and electronics. The HST will combine the federal GST and provincial RST into a single 13% sales tax for most goods and services.
The document provides examples of how common products and services in Ontario will be affected by the new Harmonized Sales Tax (HST), outlining whether each item was subject to GST and/or RST previously and if the total amount of tax payable will change under the HST. Key categories covered include clothing, food/beverages, home services, vehicles, health products, memberships and entertainment, leases/rentals, electronics, and professional services. For most items, the tax amount will remain the same at 13% but some, like electricity and domestic travel, will see the rate increase to 13% under HST.
The document provides examples of how common products and services will be taxed under Ontario's new Harmonized Sales Tax (HST), comparing the previous Goods and Services Tax (GST) and Retail Sales Tax (RST) rates. For many items like clothing, prepared food, and vehicle repairs, the tax rate will remain unchanged at 13%. However, some services like electricity, internet access, and massages will see the tax rate increase to 13% with the introduction of the HST. The tax changes are part of a comprehensive tax package that provides $11.8 billion in tax relief to Ontario residents over three years.
This 3-page document from the Congressional Budget Office summarizes trends in household income in the United States from 1979 to 2007. It includes 6 charts showing: 1) growth in average after-tax income by income group, 2) measures of income inequality, 3) distribution of transfers by market income, 4) federal taxes as a percentage of income by group, 5) progressivity of individual income taxes, and 6) progressivity of all federal taxes. The presentation provides data from their October 2011 report on changes in the distribution of household income over time.
The federal tax system is progressive, with average tax rates generally rising with income. In 2007, households in the lowest quintile paid 4.0% of income in taxes, the middle quintile paid 14.3%, and the highest quintile paid 25.1%. Higher-income groups earn a disproportionate share of pre-tax income and pay a higher share of federal taxes. Much of the progressivity comes from the individual income tax, with social insurance taxes being the largest burden for most households. Tax rates vary by household type due to differences in income and tax rules.
This chapter examines decisions made by public sector entities like politicians, bureaucrats and voters. It discusses how government expenditures have grown as a percentage of GDP since the 1950s, primarily due to increased spending on transfer programs. Federal tax revenues, especially individual income and payroll taxes, are the primary source of funding. The US has a lighter tax burden compared to other advanced countries when measured as a percentage of GDP. The chapter also covers principles of taxation like benefits received and ability to pay. It analyzes factors that can lead to inefficient government outcomes under public choice theory.
From April 2011, there will be significant changes to PAYE operation including compensation rates for statutory maternity pay, new tax codes, and the introduction of a D1 tax code. In 2012, PAYE will transition to real-time information reporting where employers must provide a full payroll breakdown each payment period. National insurance thresholds will also increase substantially.
The document contains 9 charts and 1 table presented by the Toronto Real Estate Board (TREB). The charts show housing market trends in the Toronto region over time, including: monthly housing sales, new listings, sales to new listings ratio, average home prices from 2013-2016 and since 1995; and how the sales to new listings ratio correlates with price changes. The table calculates the percentage of average household income needed to cover mortgage payments, property taxes and utilities for the average priced home.
The document contains charts analyzing the housing market in Toronto from June 2016. It includes charts showing monthly MLS sales, new listings, sales-to-new listings ratio, average home price, and trends over time for these metrics from 2013 to 2016. It also contains a chart comparing the sales-to-new listings ratio to average annual price change and a chart analyzing housing affordability based on average household income.
The document contains charts analyzing the housing market in Toronto from April 2016. It includes charts showing monthly MLS sales, new listings, sales-to-new listings ratio, average home price, and trends over time for these metrics from 2013 to 2016. It also contains a chart comparing the sales-to-new listings ratio to average annual price change and a chart analyzing housing affordability based on average household income.
This document contains charts summarizing housing market trends in Toronto from 2013 to 2016. It shows monthly MLS sales, new listings, sales to new listings ratio, and average home prices for each year. It also includes longer term charts from 1995 onward for these metrics as well as trends lines. Finally, it charts the affordability of the average priced home as a share of average household income.
This document contains charts analyzing the housing market in Toronto from February 2016. It includes charts showing monthly MLS sales, new listings, sales-to-new listings ratio, average home price, and trends over time for these metrics from 2013 to 2016. Additional charts analyze how the sales-to-new listings ratio correlates with annual price changes and the share of average household income required for mortgage payments, property taxes and utilities on an average priced home in the GTA.
The document contains charts analyzing the housing market in Toronto from January 1995 to January 2016. It examines trends in monthly housing sales, new listings, average prices, and the ratio of sales to new listings. The charts compare current data to previous years and identify seasonal patterns. They also include moving averages to illustrate underlying trends. Overall, the document uses charts and data to analyze patterns in the Toronto housing market over recent decades.
The document contains charts summarizing housing market data from the Toronto Real Estate Board from November 2015. It includes charts showing monthly MLS sales, new listings, sales to new listings ratio, and average home prices over the past 3 years. It also includes longer term charts from 1995 showing sales, new listings, average prices, and trends over time. A final chart shows the estimated share of average household income needed for mortgage payments, property taxes and utilities on an average priced home in the GTA.
The document contains charts summarizing housing market data from the Toronto Real Estate Board from 1995 to 2015. It includes charts showing monthly MLS sales, new listings, average prices, and the sales to new listings ratio over time and compared to previous years. One chart shows how the ratio of sales to new listings correlates with annual price changes. Another estimates the percentage of average household income needed to cover mortgage, tax, and utility costs for an average priced home in the region.
The document contains charts summarizing housing market data from the Toronto Real Estate Board from 1995 to 2015. It includes charts showing monthly MLS sales, new listings, average prices, and the sales to new listings ratio over time. It also includes charts comparing these metrics to previous years and analyzing trends. The charts help examine seasonal patterns in the housing market and compare current data to historic trends.
The document contains charts summarizing housing market data from the Toronto Real Estate Board from 1995 to 2015. It includes charts showing monthly MLS sales, new listings, average prices, and the sales to new listings ratio over time and compared to previous years. One chart shows how the ratio of sales to new listings correlates with annual price changes. Another provides an affordability indicator by calculating the share of average household income needed for mortgage payments, property taxes and utilities on the average priced home.
The document contains charts summarizing housing market data from the Toronto Real Estate Board from July 2015. It includes charts showing monthly MLS sales, new listings, sales-to-new listings ratio, average home price, long-term trends in sales, new listings, and average price since 1995. There are also charts comparing the sales-to-new listings ratio to annual price changes and a chart showing the estimated share of average household income required for mortgage payments, property taxes and utilities on an average priced home in the GTA.
The document contains charts summarizing housing market data from the Toronto Real Estate Board from January 1995 to June 2015. It includes charts showing monthly MLS sales, new listings, average prices, and sales-to-listing ratios over time as well as comparisons to previous years. It also includes a chart showing the estimated percentage of average household income needed to cover mortgage payments, property taxes and utilities for the average priced home in the Greater Toronto Area.
The document contains charts summarizing housing market data from the Toronto Real Estate Board from January 1995 to May 2015. It includes charts showing monthly MLS sales, new listings, average prices, and sales-to-listing ratios over time as well as comparisons to previous years. It also includes a chart showing the estimated percentage of average household income needed to cover mortgage payments, property taxes and utilities for the average priced home in the Greater Toronto Area.
The document contains charts analyzing housing market trends in Toronto from 2012 to 2015. It examines monthly MLS sales, new listings, average prices, and the sales to new listings ratio over time and compared to previous years. The charts show seasonal patterns and allow comparisons of current data to historic trends. The analysis aims to provide insight into the behavior of the Toronto housing market.
The document contains charts summarizing housing market trends in Toronto from 2012 to 2015. It includes charts showing monthly MLS sales, new listings, average prices, and sales to new listings ratios over time. The charts allow comparison to previous years and identification of seasonal trends. Analysis of these metrics can provide insight into how strongly the market is performing and the direction of future price changes.
The document contains charts analyzing the Toronto housing market from February 2015. It includes charts showing monthly MLS sales, new listings, sales-to-new listings ratio, average home price, and trends over time for these metrics from 2012-2015. Additional charts analyze how the sales-to-new listings ratio correlates with annual price changes and the estimated share of average household income needed for mortgage payments, property taxes and utilities on an average priced home in the GTA.
The document contains charts analyzing the Toronto housing market from January 1995 to January 2015. It examines trends in monthly MLS sales, new listings, average prices, and the sales-to-new listings ratio over time and compared to previous years. The charts show seasonal patterns and compare current data to historical trends. One chart also analyzes the relationship between the sales-to-new listings ratio and average annual price changes. Another chart models the share of average household income required for mortgage payments, property taxes and utilities on the average priced home in the Greater Toronto Area.
The document contains charts summarizing housing market trends in Toronto from 2011-2014. It shows monthly MLS sales, new listings, average prices, and sales-to-listing ratios. Seasonal patterns and year-over-year comparisons are examined. Trend lines show overall sales, listings, and price trends have generally increased since 1995, though average annual price growth correlates more closely with sales-to-listing ratios. The final chart models the share of average household income required for mortgage payments, property taxes and utilities on an average priced home in the GTA.
The document contains charts analyzing the Toronto housing market from November 2014. It includes charts showing monthly MLS sales, new listings, sales-to-new listings ratio, average home price, and trends over time for these metrics from 2011-2014. Additional charts analyze how the sales-to-new listings ratio correlates with annual price changes and the estimated share of average household income required for mortgage payments, property taxes and utilities on an average priced home in the GTA.
The document contains charts summarizing housing market trends in Toronto from 2014 and previous years, including MLS sales, new listings, average home prices, sales-to-listing ratios, and an affordability indicator showing the share of household income needed for housing costs. The charts allow examining seasonal trends and comparing current data to previous years.
The document contains charts summarizing housing market trends in Toronto over multiple years, including MLS home sales, new listings, average home prices, sales-to-listing ratios, and an affordability indicator showing the share of household income needed for mortgage payments, property taxes and utilities on an average priced home in the region. The charts allow examining seasonal trends and comparing current monthly data to the same months in previous years.
The document contains charts summarizing housing market trends in Toronto over multiple years, including MLS home sales, new listings, average home prices, sales-to-listing ratios, and an affordability indicator showing the share of household income needed for mortgage payments, property taxes, and utilities on an average priced home in the region. The charts allow examining seasonal trends and comparing current monthly data to the same months in previous years.
Acolyte Episodes review (TV series) The Acolyte. Learn about the influence of the program on the Star Wars world, as well as new characters and story twists.
More Related Content
More from Bonnie Byford Real Estate Ltd., Brokerage
The document contains charts analyzing the housing market in Toronto from April 2016. It includes charts showing monthly MLS sales, new listings, sales-to-new listings ratio, average home price, and trends over time for these metrics from 2013 to 2016. It also contains a chart comparing the sales-to-new listings ratio to average annual price change and a chart analyzing housing affordability based on average household income.
This document contains charts summarizing housing market trends in Toronto from 2013 to 2016. It shows monthly MLS sales, new listings, sales to new listings ratio, and average home prices for each year. It also includes longer term charts from 1995 onward for these metrics as well as trends lines. Finally, it charts the affordability of the average priced home as a share of average household income.
This document contains charts analyzing the housing market in Toronto from February 2016. It includes charts showing monthly MLS sales, new listings, sales-to-new listings ratio, average home price, and trends over time for these metrics from 2013 to 2016. Additional charts analyze how the sales-to-new listings ratio correlates with annual price changes and the share of average household income required for mortgage payments, property taxes and utilities on an average priced home in the GTA.
The document contains charts analyzing the housing market in Toronto from January 1995 to January 2016. It examines trends in monthly housing sales, new listings, average prices, and the ratio of sales to new listings. The charts compare current data to previous years and identify seasonal patterns. They also include moving averages to illustrate underlying trends. Overall, the document uses charts and data to analyze patterns in the Toronto housing market over recent decades.
The document contains charts summarizing housing market data from the Toronto Real Estate Board from November 2015. It includes charts showing monthly MLS sales, new listings, sales to new listings ratio, and average home prices over the past 3 years. It also includes longer term charts from 1995 showing sales, new listings, average prices, and trends over time. A final chart shows the estimated share of average household income needed for mortgage payments, property taxes and utilities on an average priced home in the GTA.
The document contains charts summarizing housing market data from the Toronto Real Estate Board from 1995 to 2015. It includes charts showing monthly MLS sales, new listings, average prices, and the sales to new listings ratio over time and compared to previous years. One chart shows how the ratio of sales to new listings correlates with annual price changes. Another estimates the percentage of average household income needed to cover mortgage, tax, and utility costs for an average priced home in the region.
The document contains charts summarizing housing market data from the Toronto Real Estate Board from 1995 to 2015. It includes charts showing monthly MLS sales, new listings, average prices, and the sales to new listings ratio over time. It also includes charts comparing these metrics to previous years and analyzing trends. The charts help examine seasonal patterns in the housing market and compare current data to historic trends.
The document contains charts summarizing housing market data from the Toronto Real Estate Board from 1995 to 2015. It includes charts showing monthly MLS sales, new listings, average prices, and the sales to new listings ratio over time and compared to previous years. One chart shows how the ratio of sales to new listings correlates with annual price changes. Another provides an affordability indicator by calculating the share of average household income needed for mortgage payments, property taxes and utilities on the average priced home.
The document contains charts summarizing housing market data from the Toronto Real Estate Board from July 2015. It includes charts showing monthly MLS sales, new listings, sales-to-new listings ratio, average home price, long-term trends in sales, new listings, and average price since 1995. There are also charts comparing the sales-to-new listings ratio to annual price changes and a chart showing the estimated share of average household income required for mortgage payments, property taxes and utilities on an average priced home in the GTA.
The document contains charts summarizing housing market data from the Toronto Real Estate Board from January 1995 to June 2015. It includes charts showing monthly MLS sales, new listings, average prices, and sales-to-listing ratios over time as well as comparisons to previous years. It also includes a chart showing the estimated percentage of average household income needed to cover mortgage payments, property taxes and utilities for the average priced home in the Greater Toronto Area.
The document contains charts summarizing housing market data from the Toronto Real Estate Board from January 1995 to May 2015. It includes charts showing monthly MLS sales, new listings, average prices, and sales-to-listing ratios over time as well as comparisons to previous years. It also includes a chart showing the estimated percentage of average household income needed to cover mortgage payments, property taxes and utilities for the average priced home in the Greater Toronto Area.
The document contains charts analyzing housing market trends in Toronto from 2012 to 2015. It examines monthly MLS sales, new listings, average prices, and the sales to new listings ratio over time and compared to previous years. The charts show seasonal patterns and allow comparisons of current data to historic trends. The analysis aims to provide insight into the behavior of the Toronto housing market.
The document contains charts summarizing housing market trends in Toronto from 2012 to 2015. It includes charts showing monthly MLS sales, new listings, average prices, and sales to new listings ratios over time. The charts allow comparison to previous years and identification of seasonal trends. Analysis of these metrics can provide insight into how strongly the market is performing and the direction of future price changes.
The document contains charts analyzing the Toronto housing market from February 2015. It includes charts showing monthly MLS sales, new listings, sales-to-new listings ratio, average home price, and trends over time for these metrics from 2012-2015. Additional charts analyze how the sales-to-new listings ratio correlates with annual price changes and the estimated share of average household income needed for mortgage payments, property taxes and utilities on an average priced home in the GTA.
The document contains charts analyzing the Toronto housing market from January 1995 to January 2015. It examines trends in monthly MLS sales, new listings, average prices, and the sales-to-new listings ratio over time and compared to previous years. The charts show seasonal patterns and compare current data to historical trends. One chart also analyzes the relationship between the sales-to-new listings ratio and average annual price changes. Another chart models the share of average household income required for mortgage payments, property taxes and utilities on the average priced home in the Greater Toronto Area.
The document contains charts summarizing housing market trends in Toronto from 2011-2014. It shows monthly MLS sales, new listings, average prices, and sales-to-listing ratios. Seasonal patterns and year-over-year comparisons are examined. Trend lines show overall sales, listings, and price trends have generally increased since 1995, though average annual price growth correlates more closely with sales-to-listing ratios. The final chart models the share of average household income required for mortgage payments, property taxes and utilities on an average priced home in the GTA.
The document contains charts analyzing the Toronto housing market from November 2014. It includes charts showing monthly MLS sales, new listings, sales-to-new listings ratio, average home price, and trends over time for these metrics from 2011-2014. Additional charts analyze how the sales-to-new listings ratio correlates with annual price changes and the estimated share of average household income required for mortgage payments, property taxes and utilities on an average priced home in the GTA.
The document contains charts summarizing housing market trends in Toronto from 2014 and previous years, including MLS sales, new listings, average home prices, sales-to-listing ratios, and an affordability indicator showing the share of household income needed for housing costs. The charts allow examining seasonal trends and comparing current data to previous years.
The document contains charts summarizing housing market trends in Toronto over multiple years, including MLS home sales, new listings, average home prices, sales-to-listing ratios, and an affordability indicator showing the share of household income needed for mortgage payments, property taxes and utilities on an average priced home in the region. The charts allow examining seasonal trends and comparing current monthly data to the same months in previous years.
The document contains charts summarizing housing market trends in Toronto over multiple years, including MLS home sales, new listings, average home prices, sales-to-listing ratios, and an affordability indicator showing the share of household income needed for mortgage payments, property taxes, and utilities on an average priced home in the region. The charts allow examining seasonal trends and comparing current monthly data to the same months in previous years.
More from Bonnie Byford Real Estate Ltd., Brokerage (20)
Acolyte Episodes review (TV series) The Acolyte. Learn about the influence of the program on the Star Wars world, as well as new characters and story twists.
El Puerto de Algeciras continúa un año más como el más eficiente del continente europeo y vuelve a situarse en el “top ten” mundial, según el informe The Container Port Performance Index 2023 (CPPI), elaborado por el Banco Mundial y la consultora S&P Global.
El informe CPPI utiliza dos enfoques metodológicos diferentes para calcular la clasificación del índice: uno administrativo o técnico y otro estadístico, basado en análisis factorial (FA). Según los autores, esta dualidad pretende asegurar una clasificación que refleje con precisión el rendimiento real del puerto, a la vez que sea estadísticamente sólida. En esta edición del informe CPPI 2023, se han empleado los mismos enfoques metodológicos y se ha aplicado un método de agregación de clasificaciones para combinar los resultados de ambos enfoques y obtener una clasificación agregada.
Essential Tools for Modern PR Business .pptxPragencyuk
Discover the essential tools and strategies for modern PR business success. Learn how to craft compelling news releases, leverage press release sites and news wires, stay updated with PR news, and integrate effective PR practices to enhance your brand's visibility and credibility. Elevate your PR efforts with our comprehensive guide.
Here is Gabe Whitley's response to my defamation lawsuit for him calling me a rapist and perjurer in court documents.
You have to read it to believe it, but after you read it, you won't believe it. And I included eight examples of defamatory statements/
An astonishing, first-of-its-kind, report by the NYT assessing damage in Ukraine. Even if the war ends tomorrow, in many places there will be nothing to go back to.
What's taxable under the hst and what's not -ontario
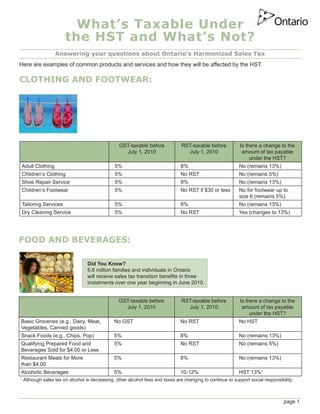
1. What’s Taxable Under
the HST and What’s Not?
Answering your questions about Ontario’s Harmonized Sales Tax
Here are examples of common products and services and how they will be affected by the HST.
CLOTHING AND FOOTWEAR:
GST-taxable before RST-taxable before Is there a change to the
July 1, 2010 July 1, 2010 amount of tax payable
under the HST?
Adult Clothing 5% 8% No (remains 13%)
Children’s Clothing 5% No RST No (remains 5%)
Shoe Repair Service 5% 8% No (remains 13%)
Children’s Footwear 5% No RST if $30 or less No for footwear up to
size 6 (remains 5%)
Tailoring Services 5% 8% No (remains 13%)
Dry Cleaning Service 5% No RST Yes (changes to 13%)
FOOD AND BEVERAGES:
Did You Know?
6.6 million families and individuals in Ontario
will receive sales tax transition benefits in three
instalments over one year beginning in June 2010.
GST-taxable before RST-taxable before Is there a change to the
July 1, 2010 July 1, 2010 amount of tax payable
under the HST?
Basic Groceries (e.g., Dairy, Meat, No GST No RST No HST
Vegetables, Canned goods)
Snack Foods (e.g., Chips, Pop) 5% 8% No (remains 13%)
Qualifying Prepared Food and 5% No RST No (remains 5%)
Beverages Sold for $4.00 or Less
Restaurant Meals for More 5% 8% No (remains 13%)
than $4.00
Alcoholic Beverages 5% 10-12% HST 13%1
1
Although sales tax on alcohol is decreasing, other alcohol fees and taxes are changing to continue to support social responsibility.
page 1
2. HOME SERVICES:
Did You Know?
93 per cent of all homes sold in Ontario, on
average, will not be subject to an additional tax
amount under HST.
GST-taxable before RST-taxable before Is there a change to the
July 1, 2010 July 1, 2010 amount of tax payable
under the HST?
Cable Television Services 5% 8% No (remains 13%)
Cell Phone Services 5% 8% No (remains 13%)
Municipal Water No GST No RST No HST
Home Maintenance Equipment 5% 8% No (remains 13%)
Home Phone Services 5% 8% No (remains 13%)
Home Service Calls to Repair 5% 8% No (remains 13%)
Free-Standing Appliances such as
Stoves, Refrigerators, Washers,
Dryers, and Televisions
Home Insurance No GST 8% No (remains 8%)
Electricity and Heating 5% No RST Yes (changes to 13%)
(e.g., Natural Gas/Oil for Home)
Internet Access Services 5% No RST Yes (changes to 13%)
Home Service Calls by Electrician/ 5% No RST Yes (changes to 13%)
Plumber/Carpenter to Maintain or
Repair Furnace, Leaky Faucets,
Bathtub, Toilet, Electrical Wiring, etc.
Landscaping, Lawn-Care and 5% No RST Yes (changes to 13%)
Private Snow Removal
ACCOMMODATION AND TRAVEL:
GST-taxable before RST-taxable before Is there a change to the
July 1, 2010 July 1, 2010 amount of tax payable
under the HST?
Luggage, Briefcases, Bags, etc. 5% 8% No (remains 13%)
Municipal Public Transit No GST No RST No HST
GO Transit No GST No RST No HST
Hotel Rooms 5% 5% Yes (changes to 13%)
Taxis 5% No RST Yes (changes to 13%)
Camping Sites 5% No RST Yes (changes to 13%)
Domestic Air, Rail and Bus Travel 5% No RST Yes (changes to 13%)
originating in Ontario
page 2
3. AROUND THE HOUSE:
Did You Know?
The comprehensive tax package provides
Ontarians with $11.8 billion in tax relief over
three years.
GST-taxable before RST-taxable before Is there a change to the
July 1, 2010 July 1, 2010 amount of tax payable
under the HST?
Cleaning Products 5% 8% No (remains 13%)
Laundry Detergent, Fabric Softeners 5% 8% No (remains 13%)
Household Furniture 5% 8% No (remains 13%)
Refrigerators and Freezers 5% 8% No (remains 13%)
Pre-packaged Computer Software 5% 8% No (remains 13%)
Books (including Audio Books) 5% No RST No (remains 5%)
Newspapers 5% No RST No (remains 5%)
Magazines Purchased at Retail 5% 8% No (remains 13%)
Office Supplies, Stationary 5% 8% No (remains 13%)
Landscaping Materials 5% 8% No (remains 13%)
Including Sod, Seeds, Plants
Linens (e.g., Blankets, Towels, 5% 8% No (remains 13%)
Sheets)
Tents, Sleeping Bags, Camping 5% 8% No (remains 13%)
Supplies
Tools 5% 8% No (remains 13%)
Patio Furniture 5% 8% No (remains 13%)
Barbeques, Lawnmowers, 5% 8% No (remains 13%)
Snowblowers, Sprinklers
Toys (e.g., Puzzles, Games, Action 5% 8% No (remains 13%)
Figures, Dolls, Playsets)
Outdoor Play Equipment 5% 8% No (remains 13%)
(e.g., Swing Set, Sandbox, Slides)
Crafting Supplies 5% 8% No (remains 13%)
Building Materials (e.g., Lumber, 5% 8% No (remains 13%)
Concrete Mix)
Magazines Purchased by 5% No RST Yes (changes to 13%)
Subscription
Home Renovations 5% No RST Yes (changes to 13%)
page 3
4. MOTORIZED VEHICLES:
GST-taxable before RST-taxable before Is there a change to the
July 1, 2010 July 1, 2010 amount of tax payable
under the HST?
Vehicle Parts 5% 8% No (remains 13%)
Short-Term Auto Rentals 5% 8% No (remains 13%)
Lease of a Vehicle 5% 8% No (remains 13%)
Child Car Seats and Booster Seats 5% No RST No (remains 5%)
Auto Insurance No GST No RST No HST
Labour Charges to Repair Vehicle 5% 8% No (remains 13%)
Oil Change 5% 8% No (remains 13%)
Tires 5% 8% No (remains 13%)
Window Repair 5% 8% No (remains 13%)
Purchase of Vehicle from Dealer 5% 8% No (remains 13%)
Boats 5% 8% No (remains 13%)
Snowmobiles 5% 8% No (remains 13%)
Recreational Vehicles 5% 8% No (remains 13%)
Private Resale of Vehicles No GST 8% Yes2 (changes to 13%)
Gasoline/Diesel 5% No RST Yes (changes to 13%)
2
HST does not apply; however, Ontario will maintain the RST on private transfers of used vehicles at a rate of 13 per cent to help
ensure a level-playing field between sales by dealerships and private sales.
HOME PURCHASES:
GST-taxable before RST-taxable before Is there a change to the
July 1, 2010 July 1, 2010 amount of tax payable
under the HST?
New Homes up to $400,000 5% No RST No change3
New Homes over $400,000 5% No RST Yes3A
Resale Homes No GST No RST No HST
Real Estate Commissions 5% No RST Yes (changes to 13%)
3
The new housing rebate will be 75 per cent of the Ontario component of the HST, up to a maximum of $24,000. The rebate will
ensure that buyers of homes priced up to $400,000 will, on average, pay no more tax than under the RST system. However,
applicable RST on building supplies is embedded in the price of the home.
3A
New homes purchased as primary residences, valued at $400,000 or more will be eligible for the maximum new housing rebate of
$24,000.
page 4
5. HEALTH PRODUCTS AND SERVICES:
GST-taxable before RST-taxable before Is there a change to the
July 1, 2010 July 1, 2010 amount of tax payable
under the HST?
Audiologist Services No GST No RST No HST if offered by a
practitioner of the service.
Chiropractor Services No GST No RST No HST if offered by a
practitioner of the service.
Physiotherapist Services No GST No RST No HST if offered by a
practitioner of the service.
Pharmacist Dispensing Fees No GST No RST No HST
Over-the-Counter Medications 5% 8% No (remains 13%)
Prescription Drugs No GST No RST No HST
Some Medical Devices No GST No RST No HST
Includes walkers, hearing aids
Prescription glasses/contact lenses No GST No RST No HST
Feminine Hygiene Products 5% No RST No (remains 5%)
Adult Incontinence Products No GST No RST No HST
Diapers 5% No RST No (remains 5%)
Cosmetics 5% 8% No (remains 13%)
Hair Care Products (e.g., Shampoo, 5% 8% No (remains 13%)
Conditioner, Styling Products)
Dental Hygiene Products 5% 8% No (remains 13%)
(e.g., Toothpaste, Toothbrushes)
Massage Therapy Services 5% No RST Yes (changes to 13%)
Vitamins 5% No RST Yes (changes to 13%)
page 5
6. MEMBERSHIPS, ENTERTAINMENT AND SPORTS EQUIPMENT:
GST-taxable before RST-taxable before Is there a change to the
July 1, 2010 July 1, 2010 amount of tax payable
under the HST?
Admissions to Professional 5% 10% Combined rate going
Sporting Events down to 13% from
current 15%
Movie Tickets 5% 10% Combined rate going
down to 13% from
current 15%
Music Lessons No GST No RST No HST
Skis and Snowboards 5% 8% No (remains 13%)
Hockey Equipment 5% 8% No (remains 13%)
Golf Clubs 5% 8% No (remains 13%)
Green Fees for Golf 5% No RST Yes (changes to 13%)
Gym and Athletic Membership Fees 5% No RST Yes (changes to 13%)
Ballet, Karaté, Trampoline, Hockey, 5% No RST Yes4 (changes to 13%)
Soccer Lessons, etc.
Tickets for Live Theatre with 3,200 5% No RST Yes5 (changes to 13%)
Seats or Less
4
HST taxable, although some could be HST-exempt if provided by a public service body to children 14 and under and underprivileged
individuals with a disability.
5
HST taxable, although some could be exempt if maximum admission charged by a public service body is $1 or less, if the admissions
are made in the course of the fundraising events where charitable receipts for income tax purposes may be issued, or admissions are
to amateur performances.
LEASES AND RENTALS:
GST-taxable before RST-taxable before Is there a change to the
July 1, 2010 July 1, 2010 amount of tax payable
under the HST?
Condo Fees No GST6 No RST6 No HST6
Residential Rents No GST No RST No HST
Hockey Rink and Hall Rental Fees 5% No RST Yes (changes to 13%)
6
Residential condo fees charged to residents are exempt; however, purchases by condominium corporations will be subject to HST,
if applicable.
page 6
7. ELECTRONICS:
GST-taxable before RST-taxable before Is there a change to the
July 1, 2010 July 1, 2010 amount of tax payable
under the HST?
TVs 5% 8% No (remains 13%)
DVD and Blu-ray Players and 5% 8% No (remains 13%)
Accessories
MP3 Players 5% 8% No (remains 13%)
Cell Phones, Smart Phones 5% 8% No (remains 13%)
Cell phone service 5% 8% No (remains 13%)
CDs, DVDs and Blu-ray discs 5% 8% No (remains 13%)
PROFESSIONAL AND PERSONAL SERVICES:
Did You Know?
Approximately 2.8 million families and individuals would benefit from the
proposed Ontario Energy and Property Tax Credit, which would provide
over $1.2 billion annually in energy and property tax relief.
GST-taxable before RST-taxable before Is there a change to the
July 1, 2010 July 1, 2010 amount of tax payable
under the HST?
Child Care Services No GST No RST No HST
Legal Aid No GST No RST No HST
Coffins and Urns Purchased 5% 8% No (remains 13%)
Separately from a Package of
Funeral Services
Fitness Trainer 5% No RST Yes (changes to 13%)
Hair Stylist/Barber 5% No RST Yes (changes to 13%)
Esthetician Services 5% No RST Yes (changes to 13%)
(e.g. Manicures, Pedicures, Facials)
Funeral Services 5% No RST Yes (changes to 13%)
Legal Fees 5% No RST Yes (changes to 13%)
page 7