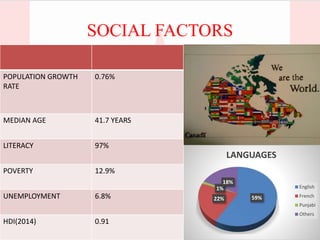
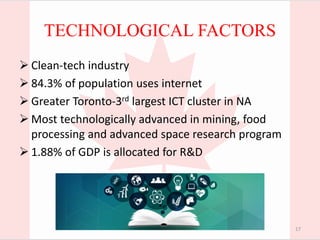
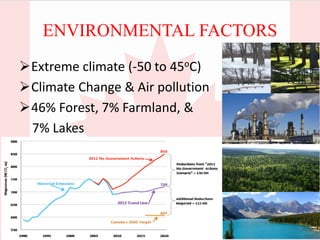
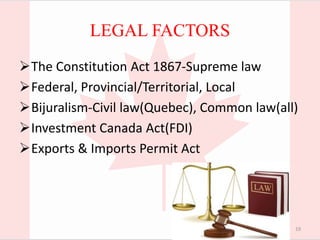
BHARATI VIDYAPEETH’S
INSTITUTE OF MANAGEMENT
STUDIES AND RESEARCH
Abhishek Dhar
Madhavi Sharma
Nidhi Khetalpar
Suresh Sundar
COUNTRY ANALYSIS
“O Canada”
THE GREAT WHITE NORTH
3
HISTORY-TIMELINE
1497-Exr. John Cabot, England15000 BC-First People arrive
1534- Exr. Jacques Carter, France 1763-7 year war, Treaty of Paris 4
TIMELINE
1867-Confederation 1965- Red White Maple leaf Flag
1969- Official languages 1982-Total Independence 5
OVERVIEW
CONTINENT NORTH AMERICA
AREA 99,84,670 sq.km
COAST LINE 2,02,080 km
BORDER 8,893 km
CAPITAL OTTAWA
CURRENCY CANADIAN DOLLAR(CAD)
POPULATION 36.286 Million 6
PEOPLE
HEAD OF THE STATE QUEEN ELIZABETH II
PRIME MINISTER JUSTIN TRUDEAU
GOVERNOR GENERAL DAVID JOHNSTON
7
CANADA EH!
8
Ice Hockey Lacrosse
Maple syrup Poutine
Canada Day St. Patrick’s Day
EXPLORE CANADA
9
Niagara Falls Banff National Park
Old Quebec Toronto CN Tower
Whistler Vancouver’s Stanley Park
ANALYSIS
10
POLITICAL FACTORS
Federal parliamentary representative
democracy under constitutional monarchy
Stable political and strong judiciary system
Immigration policies
Entrepreneurship support
Increased infrastructure spending
Apprenticeship tax credit policy
11
ECONOMICAL FACTORS
71%
28%
1%
% of GDP
Service
Industry
Agriculture
12
2016 (USD) 2017 E (USD)
GDP(PPP) 1.67 tn 1.742 tn
GDP(Per
capita)
43,280 44,412
Growth 1.4% 2.12%
Inflation 1.6% 2.1%
Unemployme
nt Rate
7% 7.1%
International
Reserves
82.7 bn
INDUSTRIES
SERVICES
• Finance & Insurance
• Retail
• Education
• Health care
• Tourism
AGRICULTURE
• Grains & oil seeds
• Dairy
• Livestock
• Food processing
MANUFACTURING
• Oil & Natural Gas
• Energy
• Mining
• Machinery & Equipment
INDIAN COMPANIES
• Essar-Energy
• Wipro-IT
• Aditya Birla-Retail
13
523.9USD 547.87USD
TRADE RELATIONS WITH INDIA
EXPORTS 0.88% of total
IMPORTS 0.74% of total
FDI INFLOW 0.89bn(USD)
FDI OUTFLOW 3.7bn(USD)
14
77
4 3 2 1
13
USA CHINA UK JAPAN MEXICO ROW
EXPORTS
USA CHINA UK JAPAN MEXICO ROW
53
12
6
3 3
23
USA CHINA MEXICO GERMAN JAPAN ROW
IMPORTS
USA CHINA MEXICO GERMAN JAPAN ROW
COMMODITIES
EXPORTS TO WORLD
• Vehicles
• Mineral fuels/oils
• Machinery
• Gems/Precious metals
• Wood
• Aircraft/Spacecraft
• Pharmaceuticals
EXPORTS TO INDIA
• Edible vegetable oils
• Metals
• Fertilizers
• Paper & Wood pulp
• Aircraft/Spacecraft
IMPORTS FROM WORLD
• Crude oil
• Natural Gas
• Electricity
• Food products
IMPORTS FROM INDIA
• Boilers & Appliances
• Mineral Fuels
• Pearls & Metals
• Textiles
• Pharmaceuticals
• Iron & Steel
15
SOCIAL FACTORS
16
59%22%
1%
18%
LANGUAGES
English
French
Punjabi
Others
POPULATION GROWTH
RATE
0.76%
MEDIAN AGE 41.7 YEARS
LITERACY 97%
POVERTY 12.9%
UNEMPLOYMENT 6.8%
HDI(2014) 0.91
TECHNOLOGICAL FACTORS
 Clean-tech industry
 84.3% of population uses internet
 Greater Toronto-3rd largest ICT cluster in NA
 Most technologically advanced in mining, food
processing and advanced space research program
 1.88% of GDP is allocated for R&D
17
ENVIRONMENTAL FACTORS
Extreme climate (-50 to 45oC)
Climate Change & Air pollution
46% Forest, 7% Farmland, &
7% Lakes
18
LEGAL FACTORS
The Constitution Act 1867-Supreme law
Federal, Provincial/Territorial, Local
Bijuralism-Civil law(Quebec), Common law(all)
Investment Canada Act(FDI)
Exports & Imports Permit Act
19
20
STRENGTHS
 Abundant and diversified natural resources
 High foreign exchange reserves
 Large service sector
 Entrepreneurial support by Government
 Strong financial sector
 Proximity to USA(trade surplus)
 Niche markets growth
(Ice wine, Canadian diamonds)
21
WEAKNESSES
 Greater dependency on USA
 Loonie(Dollar) connected to oil
 Fluctuating currency
 Transportation & pipeline infrastructure
22
OPPORTUNITIES
 Emerging markets-increase in export demand
 Oil sands(Keystone XL pipeline)
 Huge potential for service sector catering
23
THREATS
 Increasing dependency on immigrants for
human potential
 Appreciation of CAD
 EU debt crisis
 High public debts(91.5% of GDP)
24
“NATURAL PARTNERS”
Former British colonies
Type of government
Pluralism
More service sector orientation
Conservative banking system and spending
practices
25
INDO-CANADIAN RELATIONS
Fellow members of common wealth of nations,G20
Partners in Trade, FDI, Aid
Social security agreement
MoU between DRDO and York University(Defence
science and technology)
Bilateral Comprehensive Economic Partnership
Agreement(ongoing)
Foreign Investment promotion and Protection
Agreement(ongoing)
26
STANDALONE MEET AFTER 4
DECADES
Business for 1.62 billion CAD
Aerospace, Defence, Education, Energy, Mining,
Infrastructure, ICT
Cameco-Uranium
27
STRATEGIC OPPORTUNITIES
Export Diversification NAFTACEPA
Shell to sell it’s oil sand assets for $7.25bn
Food processing industries
Opening the telecom sector to foreign
investors
Government start up Visa-Technology
Need for capital-Financial sector
28
WHY INDIA FOR CANADA
1.2 bn people with 1.9 tn(USD) economy
“India will grow wealthy before it grows old”
600 mn people under 25 yrs of age
Energy demand- Fastest growing economy
Huge untapped potential for trade
Cross-cultural understanding
29
WHY CANADA FOR INDIA
• High economic stability and growth (G20)
• Safe haven for investors
• Good infrastructure
• Tax benefits
• Liberal laws
• Low labor and business costs
• Indian immigrants
30
REFERENCES
• www.wikipedia.org
• www.worldbank.org
• www.imf.org
• www.indexmundi.org
• www.canada.ca/en.html
• www.heritage.org
• www.theglobeandmail.com
• www.scribd.com
• www.business.financialpost.com
31
Anybody up for Donuts Eh?
32

WFC country analysis - Canada

  • 1.
    BHARATI VIDYAPEETH’S INSTITUTE OFMANAGEMENT STUDIES AND RESEARCH Abhishek Dhar Madhavi Sharma Nidhi Khetalpar Suresh Sundar
  • 2.
  • 3.
  • 4.
    HISTORY-TIMELINE 1497-Exr. John Cabot,England15000 BC-First People arrive 1534- Exr. Jacques Carter, France 1763-7 year war, Treaty of Paris 4
  • 5.
    TIMELINE 1867-Confederation 1965- RedWhite Maple leaf Flag 1969- Official languages 1982-Total Independence 5
  • 6.
    OVERVIEW CONTINENT NORTH AMERICA AREA99,84,670 sq.km COAST LINE 2,02,080 km BORDER 8,893 km CAPITAL OTTAWA CURRENCY CANADIAN DOLLAR(CAD) POPULATION 36.286 Million 6
  • 7.
    PEOPLE HEAD OF THESTATE QUEEN ELIZABETH II PRIME MINISTER JUSTIN TRUDEAU GOVERNOR GENERAL DAVID JOHNSTON 7
  • 8.
    CANADA EH! 8 Ice HockeyLacrosse Maple syrup Poutine Canada Day St. Patrick’s Day
  • 9.
    EXPLORE CANADA 9 Niagara FallsBanff National Park Old Quebec Toronto CN Tower Whistler Vancouver’s Stanley Park
  • 10.
  • 11.
    POLITICAL FACTORS Federal parliamentaryrepresentative democracy under constitutional monarchy Stable political and strong judiciary system Immigration policies Entrepreneurship support Increased infrastructure spending Apprenticeship tax credit policy 11
  • 12.
    ECONOMICAL FACTORS 71% 28% 1% % ofGDP Service Industry Agriculture 12 2016 (USD) 2017 E (USD) GDP(PPP) 1.67 tn 1.742 tn GDP(Per capita) 43,280 44,412 Growth 1.4% 2.12% Inflation 1.6% 2.1% Unemployme nt Rate 7% 7.1% International Reserves 82.7 bn
  • 13.
    INDUSTRIES SERVICES • Finance &Insurance • Retail • Education • Health care • Tourism AGRICULTURE • Grains & oil seeds • Dairy • Livestock • Food processing MANUFACTURING • Oil & Natural Gas • Energy • Mining • Machinery & Equipment INDIAN COMPANIES • Essar-Energy • Wipro-IT • Aditya Birla-Retail 13
  • 14.
    523.9USD 547.87USD TRADE RELATIONSWITH INDIA EXPORTS 0.88% of total IMPORTS 0.74% of total FDI INFLOW 0.89bn(USD) FDI OUTFLOW 3.7bn(USD) 14 77 4 3 2 1 13 USA CHINA UK JAPAN MEXICO ROW EXPORTS USA CHINA UK JAPAN MEXICO ROW 53 12 6 3 3 23 USA CHINA MEXICO GERMAN JAPAN ROW IMPORTS USA CHINA MEXICO GERMAN JAPAN ROW
  • 15.
    COMMODITIES EXPORTS TO WORLD •Vehicles • Mineral fuels/oils • Machinery • Gems/Precious metals • Wood • Aircraft/Spacecraft • Pharmaceuticals EXPORTS TO INDIA • Edible vegetable oils • Metals • Fertilizers • Paper & Wood pulp • Aircraft/Spacecraft IMPORTS FROM WORLD • Crude oil • Natural Gas • Electricity • Food products IMPORTS FROM INDIA • Boilers & Appliances • Mineral Fuels • Pearls & Metals • Textiles • Pharmaceuticals • Iron & Steel 15
  • 16.
    SOCIAL FACTORS 16 59%22% 1% 18% LANGUAGES English French Punjabi Others POPULATION GROWTH RATE 0.76% MEDIANAGE 41.7 YEARS LITERACY 97% POVERTY 12.9% UNEMPLOYMENT 6.8% HDI(2014) 0.91
  • 17.
    TECHNOLOGICAL FACTORS  Clean-techindustry  84.3% of population uses internet  Greater Toronto-3rd largest ICT cluster in NA  Most technologically advanced in mining, food processing and advanced space research program  1.88% of GDP is allocated for R&D 17
  • 18.
    ENVIRONMENTAL FACTORS Extreme climate(-50 to 45oC) Climate Change & Air pollution 46% Forest, 7% Farmland, & 7% Lakes 18
  • 19.
    LEGAL FACTORS The ConstitutionAct 1867-Supreme law Federal, Provincial/Territorial, Local Bijuralism-Civil law(Quebec), Common law(all) Investment Canada Act(FDI) Exports & Imports Permit Act 19
  • 20.
  • 21.
    STRENGTHS  Abundant anddiversified natural resources  High foreign exchange reserves  Large service sector  Entrepreneurial support by Government  Strong financial sector  Proximity to USA(trade surplus)  Niche markets growth (Ice wine, Canadian diamonds) 21
  • 22.
    WEAKNESSES  Greater dependencyon USA  Loonie(Dollar) connected to oil  Fluctuating currency  Transportation & pipeline infrastructure 22
  • 23.
    OPPORTUNITIES  Emerging markets-increasein export demand  Oil sands(Keystone XL pipeline)  Huge potential for service sector catering 23
  • 24.
    THREATS  Increasing dependencyon immigrants for human potential  Appreciation of CAD  EU debt crisis  High public debts(91.5% of GDP) 24
  • 25.
    “NATURAL PARTNERS” Former Britishcolonies Type of government Pluralism More service sector orientation Conservative banking system and spending practices 25
  • 26.
    INDO-CANADIAN RELATIONS Fellow membersof common wealth of nations,G20 Partners in Trade, FDI, Aid Social security agreement MoU between DRDO and York University(Defence science and technology) Bilateral Comprehensive Economic Partnership Agreement(ongoing) Foreign Investment promotion and Protection Agreement(ongoing) 26
  • 27.
    STANDALONE MEET AFTER4 DECADES Business for 1.62 billion CAD Aerospace, Defence, Education, Energy, Mining, Infrastructure, ICT Cameco-Uranium 27
  • 28.
    STRATEGIC OPPORTUNITIES Export DiversificationNAFTACEPA Shell to sell it’s oil sand assets for $7.25bn Food processing industries Opening the telecom sector to foreign investors Government start up Visa-Technology Need for capital-Financial sector 28
  • 29.
    WHY INDIA FORCANADA 1.2 bn people with 1.9 tn(USD) economy “India will grow wealthy before it grows old” 600 mn people under 25 yrs of age Energy demand- Fastest growing economy Huge untapped potential for trade Cross-cultural understanding 29
  • 30.
    WHY CANADA FORINDIA • High economic stability and growth (G20) • Safe haven for investors • Good infrastructure • Tax benefits • Liberal laws • Low labor and business costs • Indian immigrants 30
  • 31.
    REFERENCES • www.wikipedia.org • www.worldbank.org •www.imf.org • www.indexmundi.org • www.canada.ca/en.html • www.heritage.org • www.theglobeandmail.com • www.scribd.com • www.business.financialpost.com 31
  • 32.
    Anybody up forDonuts Eh? 32